Insurance Analytics Dashboard Landing Page Template
The Actuarial landing page template is built for insurance analytics teams who need to show exactly what their platform can do, and why spreadsheets cannot keep up. It pairs a dark Dashboard Pro visual system with a structured comparison table, animated data widgets, and a friction-light upload form to move analytics leads from curiosity to conversion without a single sales call.
by Rocket studio
Quick summary
This is a purpose-built landing page for a B2B insurance analytics platform that replaces manual spreadsheet work with one-click data ingestion. The page follows a Problem to Solution Arc, opening with industry trust signals, moving through a head-to-head comparison table, and closing with a three-field upload form. Every design choice serves one goal: prove the product's value before asking for anything in return.
Who this template is for
This landing page template was designed for analytics-led teams inside the insurance industry who need to communicate a clear technical edge to a skeptical audience. These are professionals who live inside data every day and can spot a vague value proposition immediately. The template gives them a page that earns credibility before it makes any ask.
- Analytics leads at mid-market carriers who are tired of normalizing bordereaux files by hand
- Managing general agent (MGA) principals who need to prove their book's profitability to capacity providers
- Reinsurance treaty pricing teams working off stale data and looking for a faster, cleaner process
What problem this template solves
The insurance industry relies on enormous volumes of raw claims data, policy portfolios, and loss runs. The problem is that most teams spend more time wrangling that data than actually reading it. A generic landing page cannot explain this pain with the specificity it deserves. This template solves that by building the problem directly into the page structure, so visitors feel seen before they ever reach the call to action.
- Spreadsheet workflows bury severity trends, geographic claim clusters, and reserve adequacy signals that actuarial analysis would surface immediately
- Generic business intelligence tools lack insurance-specific data models, leaving claims processing gaps that erode confidence in the numbers
- Standard marketing pages fail to demonstrate product capability; this template shows the comparison gap visually before asking for a single data point
What you get with this template
This template delivers a complete, conversion-focused landing page with every section needed to take an insurance analytics prospect from doubt to action. The layout is dense with purpose but clean in execution. Each section feeds the next, tightening the case as visitors scroll.
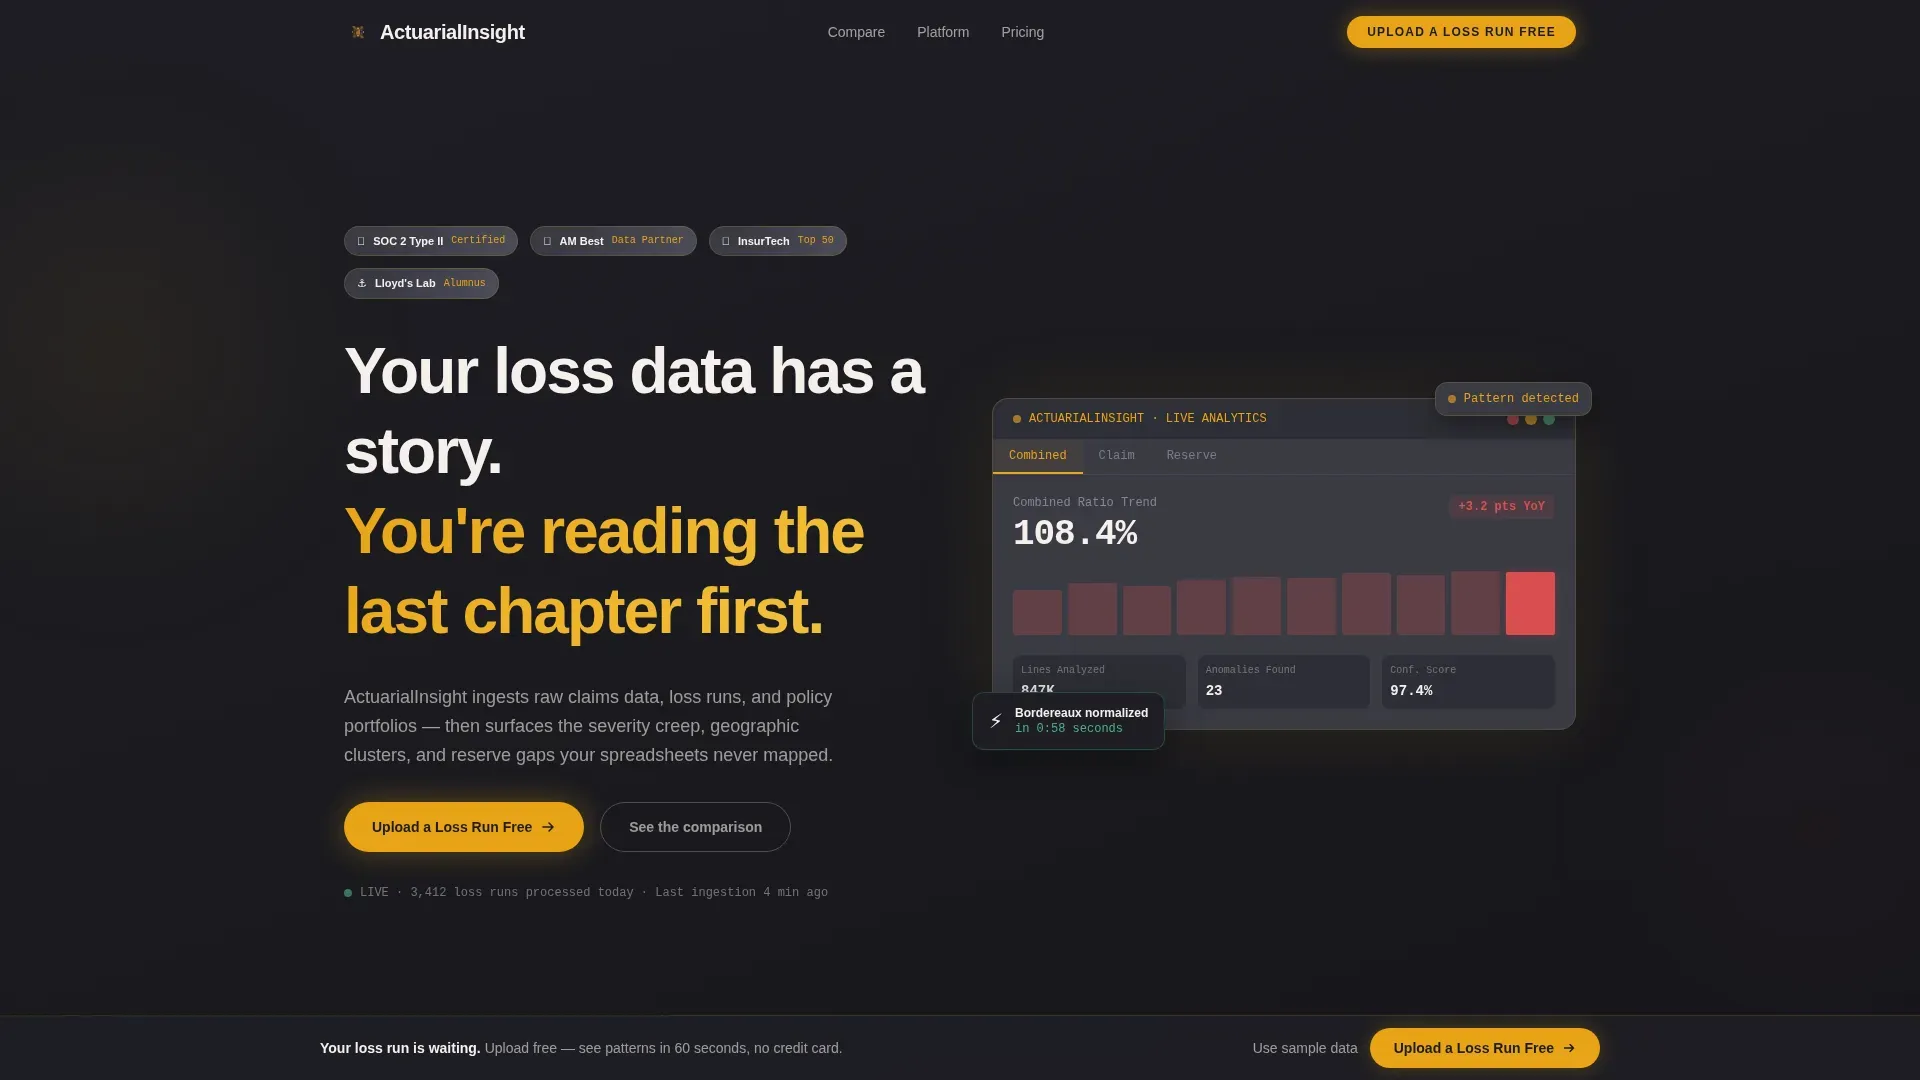
- A hero section with animated dashboard widget, trust badge row, and a catchy headline that frames the core value proposition immediately
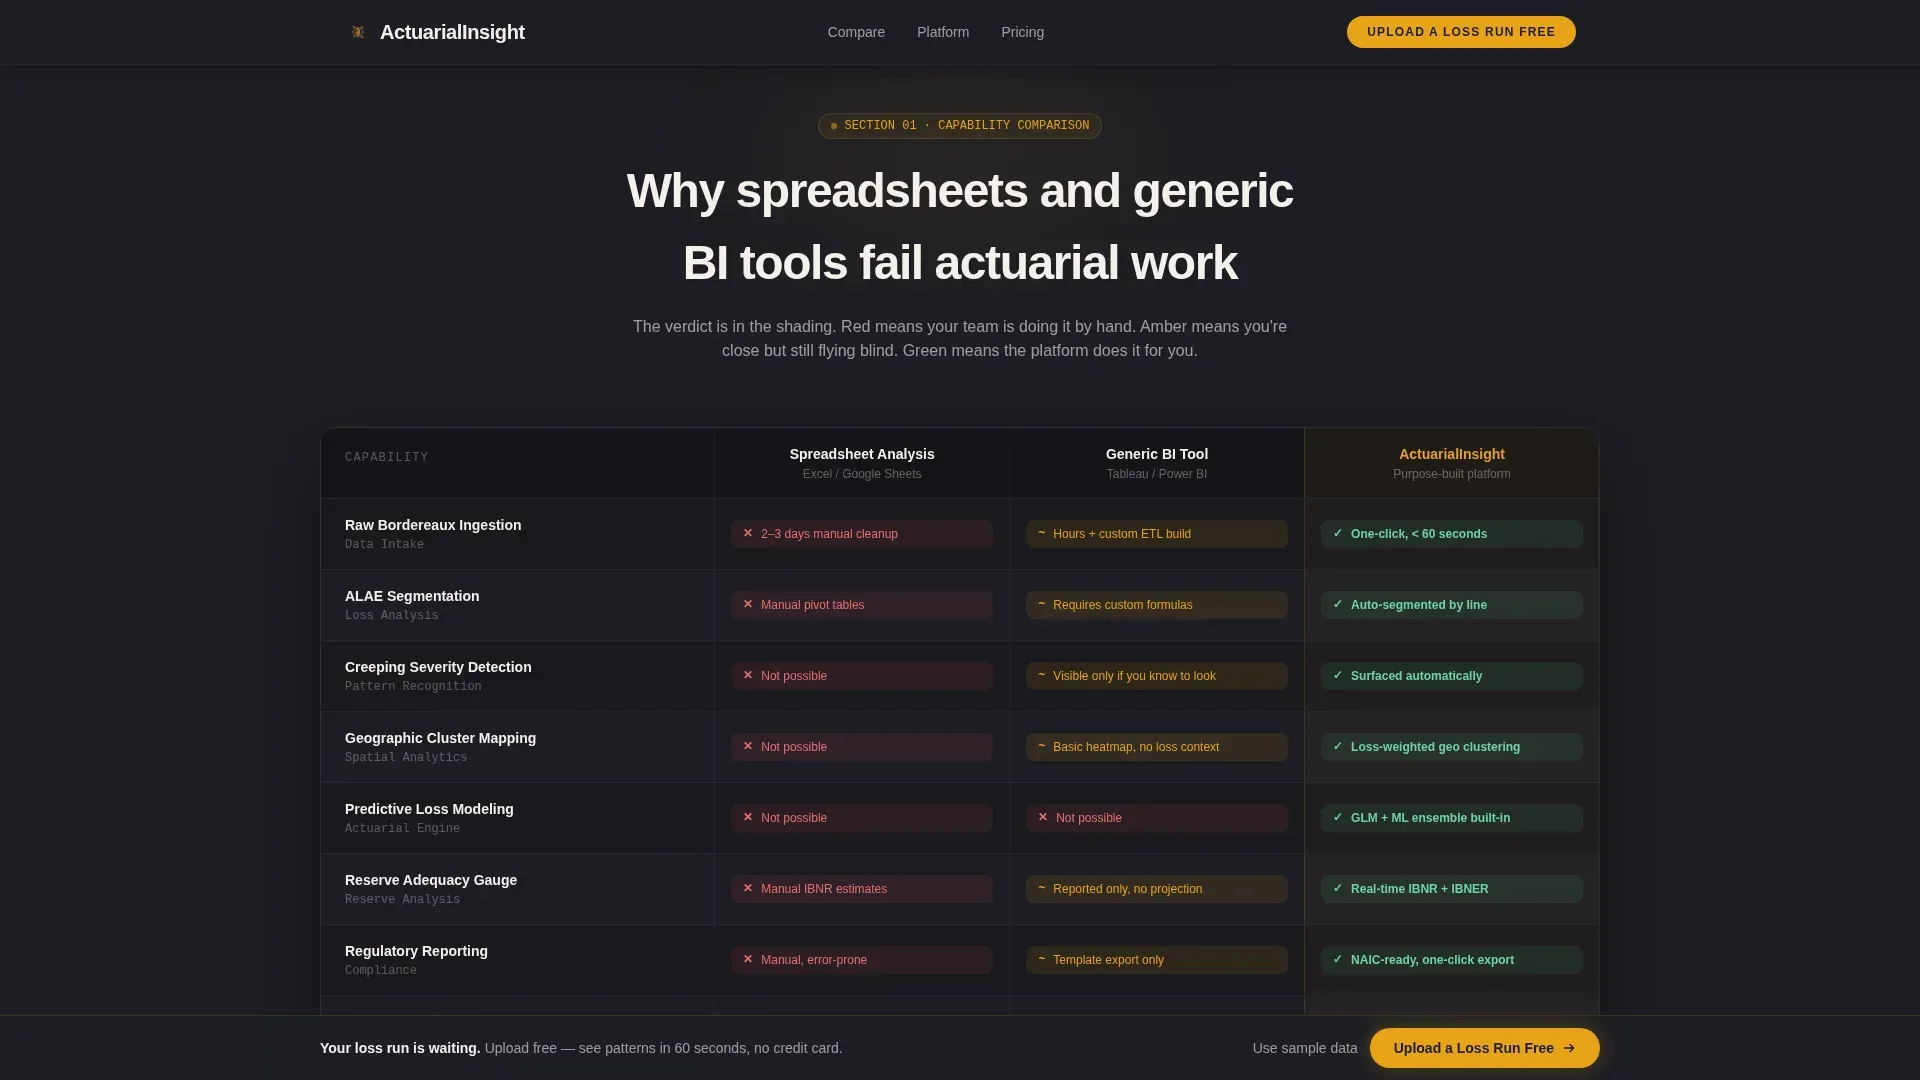
- A three-column comparison table contrasting spreadsheet workflows, generic business intelligence tools, and the platform itself across rows including data ingestion time, predictive loss modeling, ALAE segmentation, and regulatory reporting
- A three-field upload form with drag-and-drop functionality, a sticky bottom call to action bar, and a secondary sample-data escape route for visitors not ready to upload proprietary files
Feature list
This template includes several key features that work together to create a high-converting landing page experience tailored to insurance analytics buyers.
Animated Hero with Trust Signals
The hero image area opens on a row of polished trust signals rendered as metallic badge emblems: SOC 2 Type II certified, AM Best data partner, InsurTech Top 50, and Lloyd's Lab alumnus. A miniature animated dashboard widget sits below the headline, cycling through live-style metrics including combined ratio trending, claim severity heat map, and reserve adequacy gauge. Trust signals like these are critical for building credibility on insurance landing pages, where potential customers need reassurance before they share proprietary data.
Three-Column Comparison Table
The comparison table is the structural core of this landing page. It places three options side by side: spreadsheet analysis, a generic business intelligence tool, and the platform. Rows cover insurance KPIs like data ingestion time, ALAE segmentation, predictive loss modeling, claim frequency tracking, and regulatory reporting. Cell shading moves from red to amber to green, making the verdict clear before visitors read a single label. Side-by-side feature comparison tables like this one are proven to highlight unique selling points, including automated fraud detection and predictive analytics, in a format that is immediately legible to a technical audience.
Animated Pain Stat Section
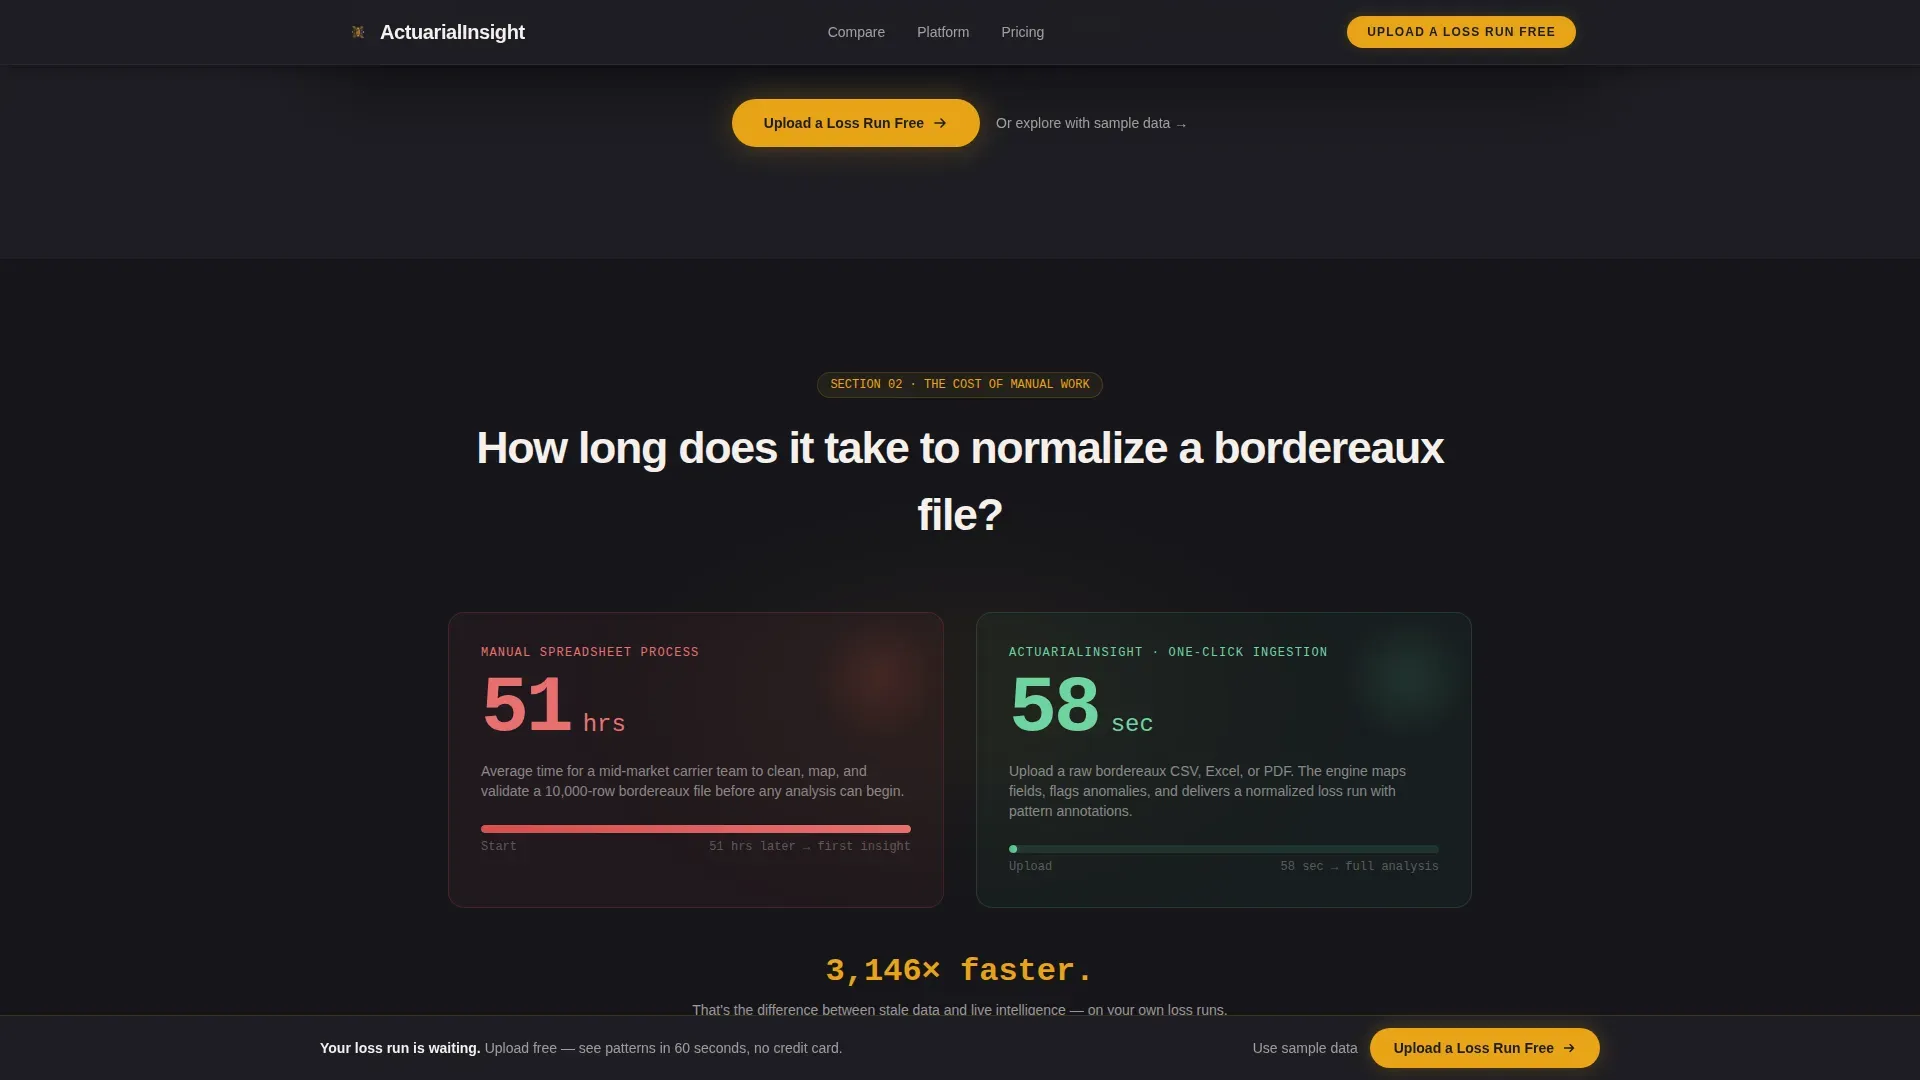
A single animated counter shows how long it takes to normalize a bordereaux file manually versus one click. This before-versus-after process mapping visualizes the transformation from manual workflows to automated ones in a way no paragraph can match. Data-driven ROI comparisons like this one, contrasting traditional methods with metrics such as reduced claims processing time by 50 percent or a lowered loss ratio by 15 percent, are among the most effective conversion tools for insurance analytics landing pages.
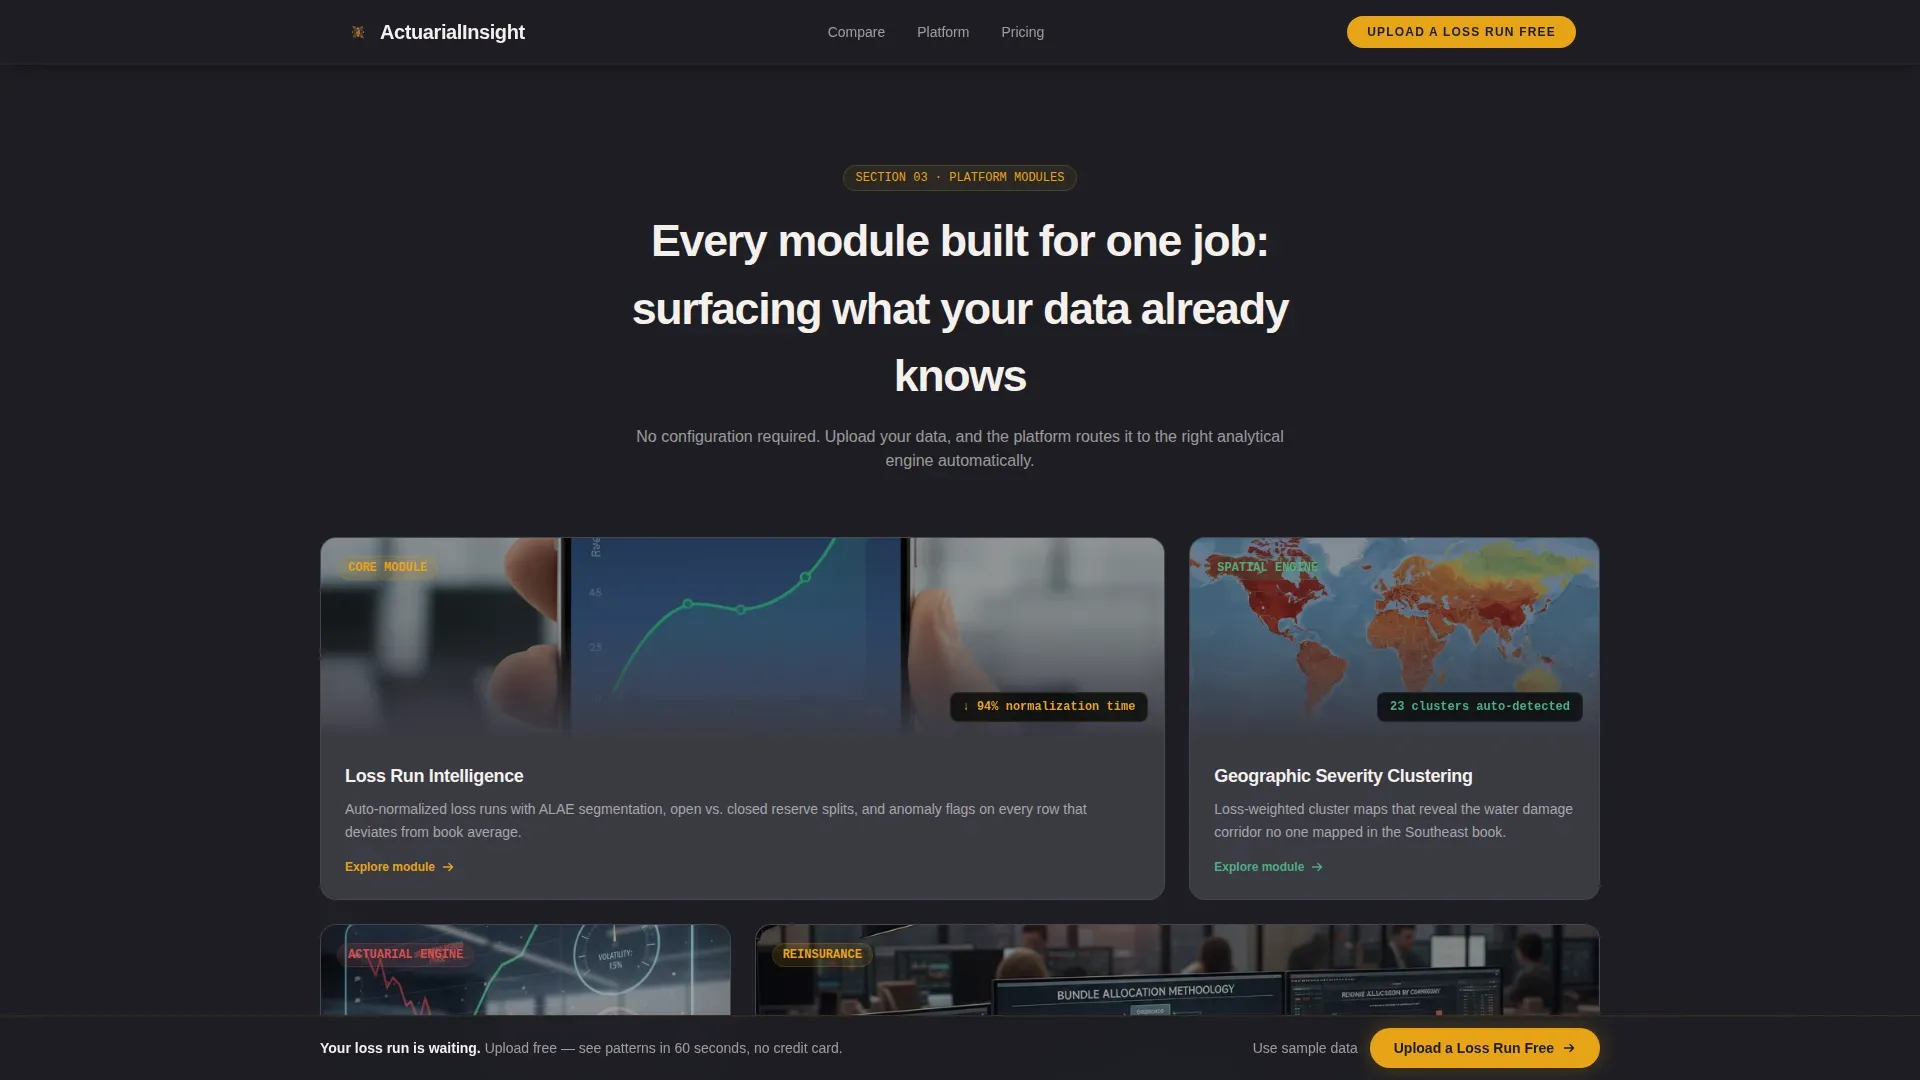
Interactive Dashboard Showcase
Full interactive screenshot cards expand on hover, giving visitors a preview of the insurance analytics dashboard in action. Static versus dynamic visuals display the difference between outdated reports and the kind of interactive dashboard that provides real-time actionable insights. This section helps visitors understand what the product actually looks like before they commit to uploading anything.
Friction-Light Upload Form and Sticky Call to Action
The upload section uses a short form with just three fields: work email, carrier or MGA name, and a drag-and-drop zone accepting CSV, Excel, or bordereaux PDF files. A sticky bottom bar pins the primary call to action after the second scroll, keeping the conversion path visible without overwhelming visitors. A secondary text link reads "Or explore with sample data" for those not ready to share proprietary files, lowering the barrier and keeping users engaged through the full page.
Problem to Solution Arc Layout
The page is structured as a deliberate narrative arc. Section one presents the comparison. Section two zooms into the pain with the animated stat. Section three reveals the dashboard. The scroll accelerates from frustration to relief to ambition. This structure ensures that every element on the landing page works toward conversion, including clear messaging and a strong call to action, in a sequence that mirrors how a real buyer's skepticism dissolves.
Page sections overview
| Section | Purpose |
|---|---|
| Hero with Badges | Open with trust signals, animated widget, and headline |
| Comparison Table | Show platform advantage across key insurance rows |
| Pain Stat Counter | Animate bordereaux normalization time versus one click |
| Dashboard Showcase | Expand interactive screenshot cards on hover |
| Upload call to action Form | Collect email, carrier name, and sample loss run file |
| Sticky Bottom Bar | Keep primary call to action pinned after second scroll |
| Footer | Close with horizontal flow layout and secondary links |
Design & branding system
The visual identity follows a Dashboard Pro theme built on a Charcoal and Amber color system. The palette feels like a Bloomberg terminal rebuilt by someone who respects the analyst's eyes: dark enough for a late-night treaty review, bright wherever the data demands attention. Typography pairs DM Sans for headings with JetBrains Mono for all data and number elements, reinforcing the product's technical credibility at a glance.
- Deep soot charcoal (#1E1E24) for primary backgrounds, mid-graphite (#3A3A44) for card surfaces, warm amber (#E8A317) for every data highlight and interactive accent, and bone white (#F5F0EB) for all body type and chart labels
- White space is used deliberately: the clean layout avoids overwhelming visitors while keeping data-dense sections scannable and readable
- Animation is set to high intensity, including scroll-linked reveals, hover expansions on dashboard cards, and cycling widget motion in the hero area
Mobile & speed optimization
While this template is designed desktop-first for analytics leads working on large monitors during treaty review, the underlying layout remains fully responsive. A mobile view ensures that the comparison table, trust badge row, and upload form all reformat cleanly for smaller screens. The page loads fast by separating server-rendered static sections from client-rendered animated components, so a slow-loading experience does not cost the page its audience.
- Desktop-first layout optimized for wide-monitor data review, with a clean mobile view for on-the-go access
- Server components handle static content; client components handle animated counters, hover expansions, and the cycling dashboard widget
- Large tap targets and scannable text ensure the mobile view remains usable, following mobile responsiveness best practices for insurance landing pages
How this template helps you convert
A well-designed landing page can make the difference between a curious visitor and a real potential customer. This template is built to drive conversions at every scroll depth, not just at the form. The structure guides visitors logically through evidence before presenting the ask, which is one of the most reliable patterns for high-converting landing pages in the insurance analytics space.
- The comparison table delivers the value proposition visually before any copy is read, letting the data speak first and keeping users engaged long enough to reach the upload form
- The sticky call to action bar and the friction-light short form reduce abandonment by keeping the conversion path visible and the commitment small, no credit card, no sales call required
- Trust signals including industry awards, certification badges, and social proof positioned above the fold help guide visitors past hesitation and toward uploading their first loss run
Other information about this template
This template is a great example of how insurance landing pages can serve highly technical audiences without sacrificing conversion discipline. The page applies best practices drawn from insurance marketing and data analytics together, creating a page that speaks credibly to both the business and the analytical sides of the buyer. Companies using landing pages generate 55 percent more leads than those that do not, and this template is structured to capture that advantage fully.
- The page is designed for the insurance business context where data analysis is a daily activity, not a quarterly report
- Insurance is one of the most data-rich industries, and this template's comparison table and dashboard showcase reflect that reality directly
- The template can support coverage for multiple insurance product lines: commercial auto insurance books, health insurance portfolios, travel insurance programs, and property lines all fit naturally into the comparison rows and dashboard views
- Each type of insurance benefits from its own dedicated landing page, and the template's flexible row structure makes it easy to adapt coverage labels to any specific insurance product
- Total premium tracking, claims ratio reporting, retention rate visibility, and key performance indicators for the full book are the kinds of insurance KPIs this template is built to showcase
- Actuarial analysis is central to the platform's value, and the template surfaces that through the comparison table rows rather than burying it in body copy
- Power BI is a common reference point for analytics leads evaluating tools; this template's side-by-side comparison directly addresses how the platform differs from a generic business intelligence setup like Power BI in areas including insurance coverage modeling, claim frequency analysis, and insurance dashboard interactivity
- The insurance industry relies on data credibility, and trust badges displaying awards and certifications enhance the reliability of the data models presented on the page
- Customer success stories, including potential video testimonials from insurers showcasing improvements in Gross Written Premium (GWP), fit naturally into the dashboard showcase section
- Digital marketing best practices support A/B testing different headlines, button colors, or form layouts on insurance landing pages to find what works best for conversion rate improvement
- Landing pages with hyper-segmented messages achieve higher conversion rates by 42 percent, and this template's audience-specific messaging is built around that principle
- The page structure ensures that every paragraph leads toward the form, following the rule that a good insurance landing page should not clutter itself with irrelevant information
- For teams planning a blog post or resource hub alongside the landing page, the footer's horizontal flow layout includes space for secondary navigation links
- Continuous iteration and A/B testing of the page elements remains a best practice for improving the conversion rate over time
- Start building with this template by customizing the comparison table rows to match your specific insurance product lines and uploading your own dashboard screenshots into the interactive card section
Theme
Dashboard Pro
Creative direction
Problem→Solution Arc
Color system
Charcoal & Amber
Style
Comparison Table
Direction
Freemium/Trial
Page Sections
Animated Hero with Award Badge Row
Three-column Comparison Table with Cell Shading
Animated Bordereaux Pain Stat Counter
Interactive Dashboard Showcase Cards
Friction-light Upload Form with Sticky Call to Action Bar
Problem to Solution Arc Page Structure
Related questions
Who is this landing page template designed for?
Can I adapt the comparison table rows for different insurance lines?
How does the upload form work for first-time visitors?
Does this template follow best practices for insurance landing pages?
Is this template suitable for a health insurance landing page use case?


