Groundwater Monitoring Gallery Landing Page Template
Aquifer is a gallery and detail landing page template built for groundwater monitoring services. It guides visitors through a full hydrological year using seasonal project photography, animated well log visualizations, and expand-on-click detail panels. The layout is designed for water district engineers, environmental consultants, and agricultural cooperatives seeking a credible partnership inquiry experience.
by Rocket studio
Quick summary
Aquifer is a single-page template for sensor-based groundwater monitoring services. It scrolls through four seasons of field project photography, data visualizations, and site detail panels. The design follows a Japanese Zen aesthetic, favoring generous negative space and mineral tones. Two conversion paths guide visitors toward a partnership inquiry form or a gated seasonal data brief.
Who this template is for
This template is built for environmental technology providers and groundwater monitoring services that work in business-to-business contexts. It speaks directly to technical buyers who need evidence before they commit to a conversation.
- Water district engineers tracking aquifer drawdown during drought declarations
- Environmental consultants preparing compliance reports for state regulatory agencies
- Agricultural cooperatives monitoring salinity movement toward crop root zones
What problem this template solves
Groundwater monitoring services often struggle to communicate the depth and continuity of their work to cautious, evidence-driven buyers. A generic service page cannot hold the attention of a hydrogeologist or a water district engineer long enough to build trust. This template addresses that gap directly.
- It shows four seasons of documented field work before asking for any contact information
- It presents site specifications, sensor arrays, and specific insights inside expandable detail panels
- It offers a secondary lead capture path for buyers who want to study methodology before speaking
What you get with this template
You get a fully structured landing page that moves visitors through a deliberate seasonal narrative. Every section is designed to earn trust incrementally, ending with a clear partnership inquiry form that feels earned rather than forced.
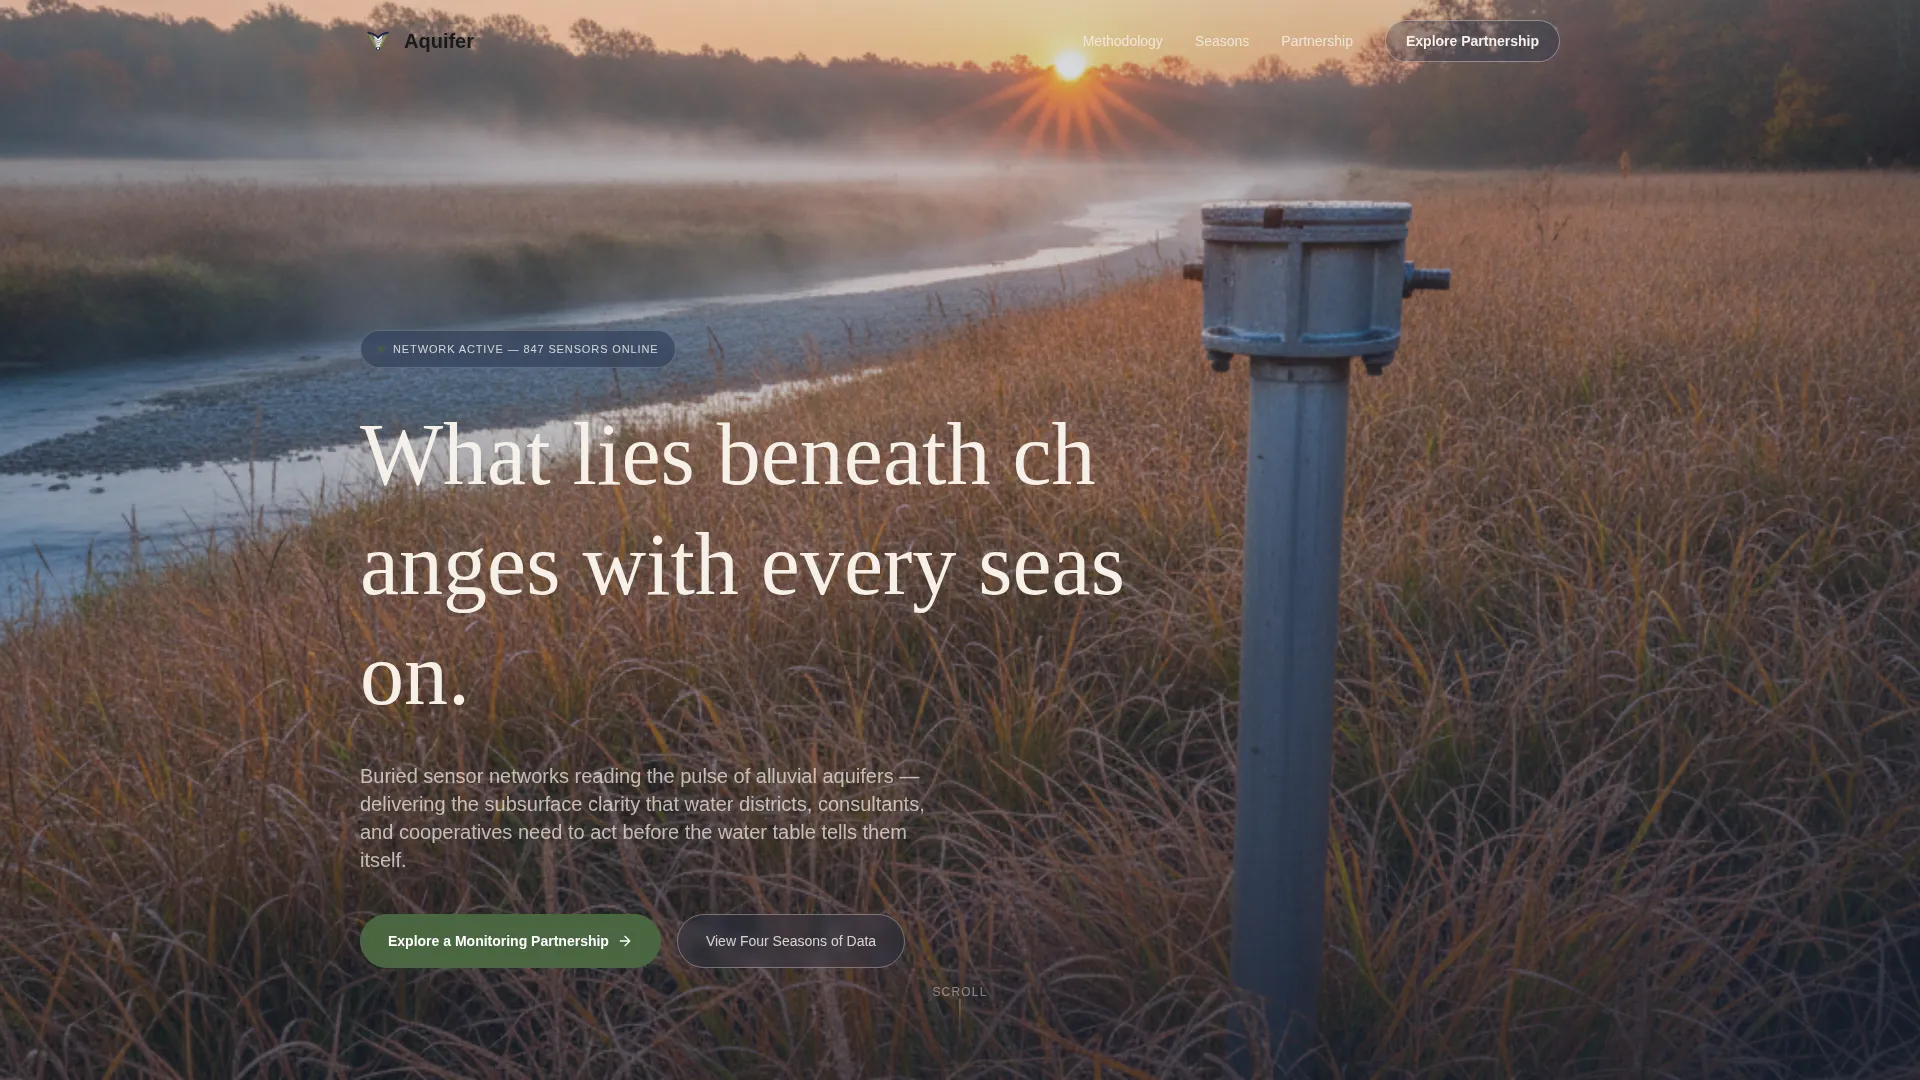
- A cinematic hero section with a full-viewport seasonal photograph and an animated headline reveal
- Four seasonal gallery rows with expand-on-click project detail panels showing site specs and sensor data
- A primary partnership inquiry form and a secondary gated data brief modal for two distinct buyer journeys
Feature list
This template includes a range of built-in components designed for technical service providers in the water and environmental sector.
Cinematic Hero with Typewriter Headline
The header uses a full-viewport late-autumn field photograph. A single headline appears letter by letter, styled to feel like ink absorbing into paper. The composition places two-thirds sky and fog above one-third earth and instrument, conveying depth before a word is read.
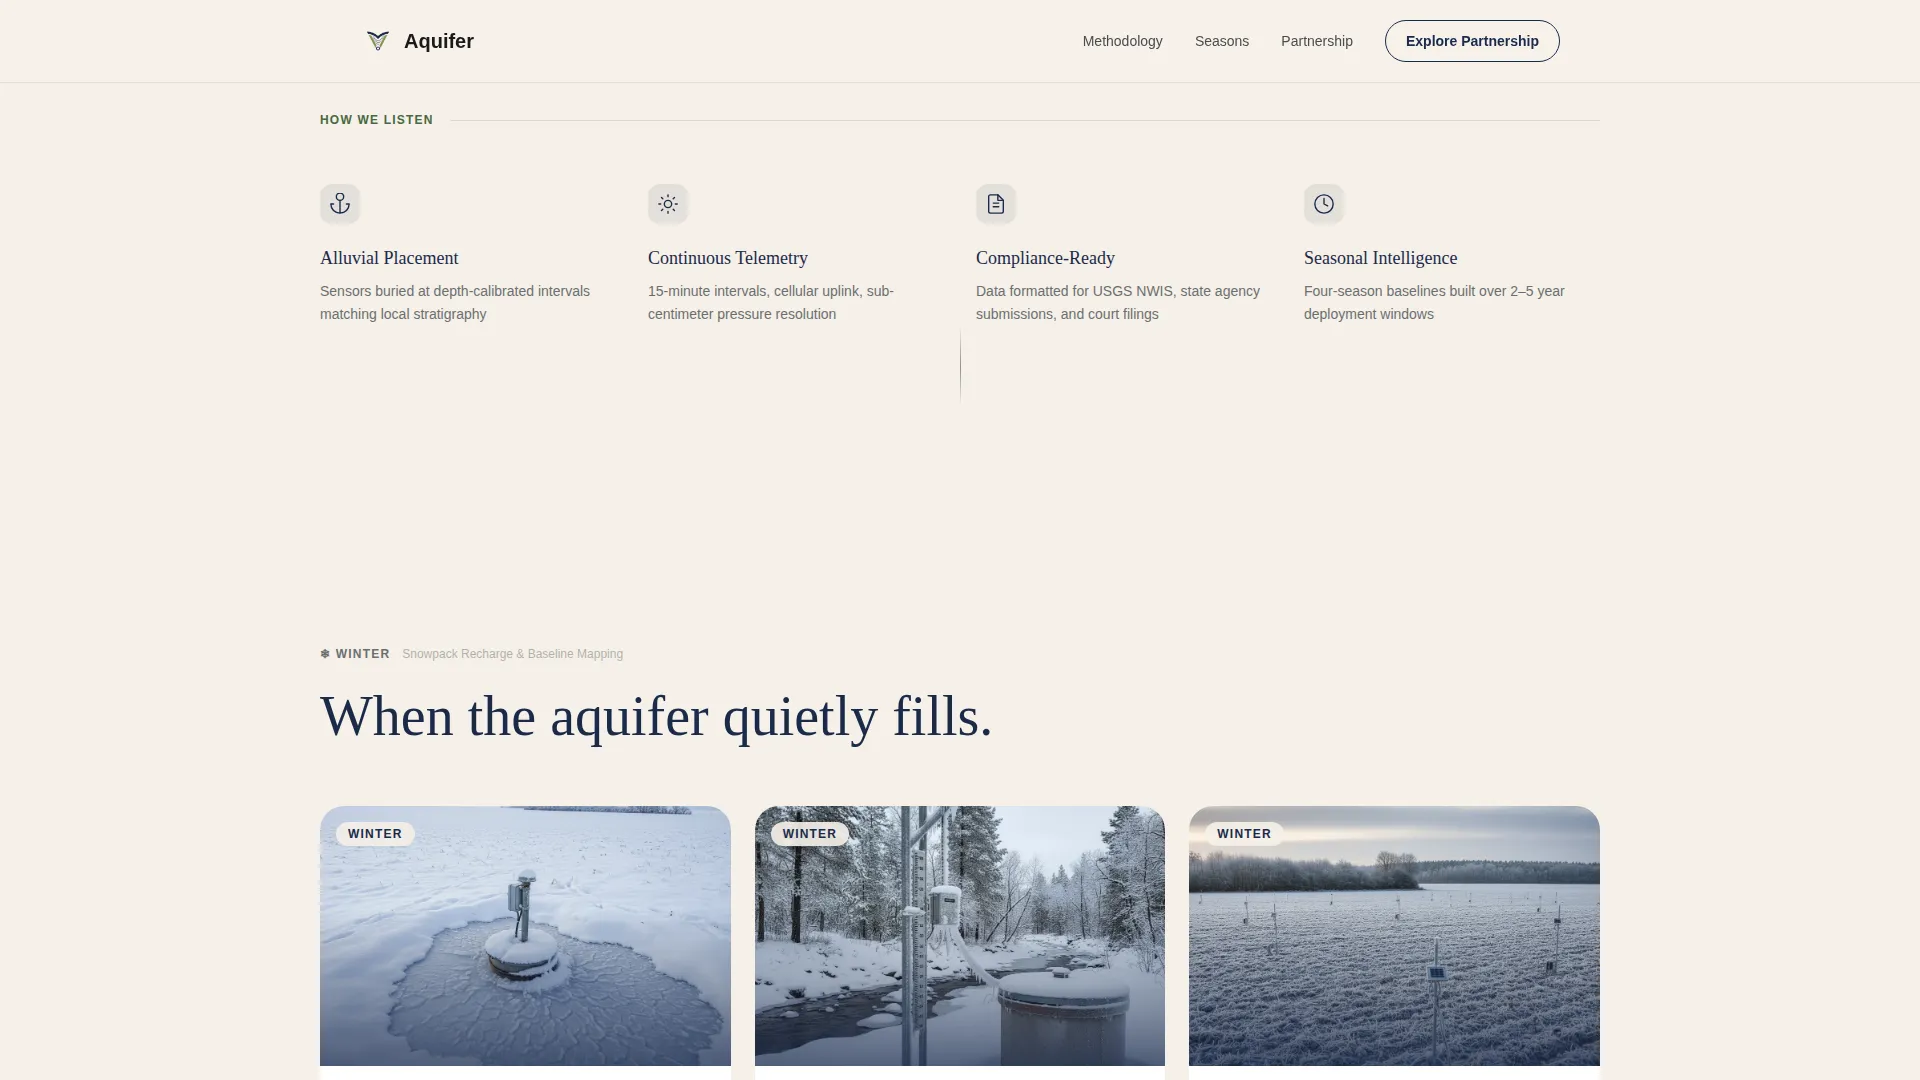
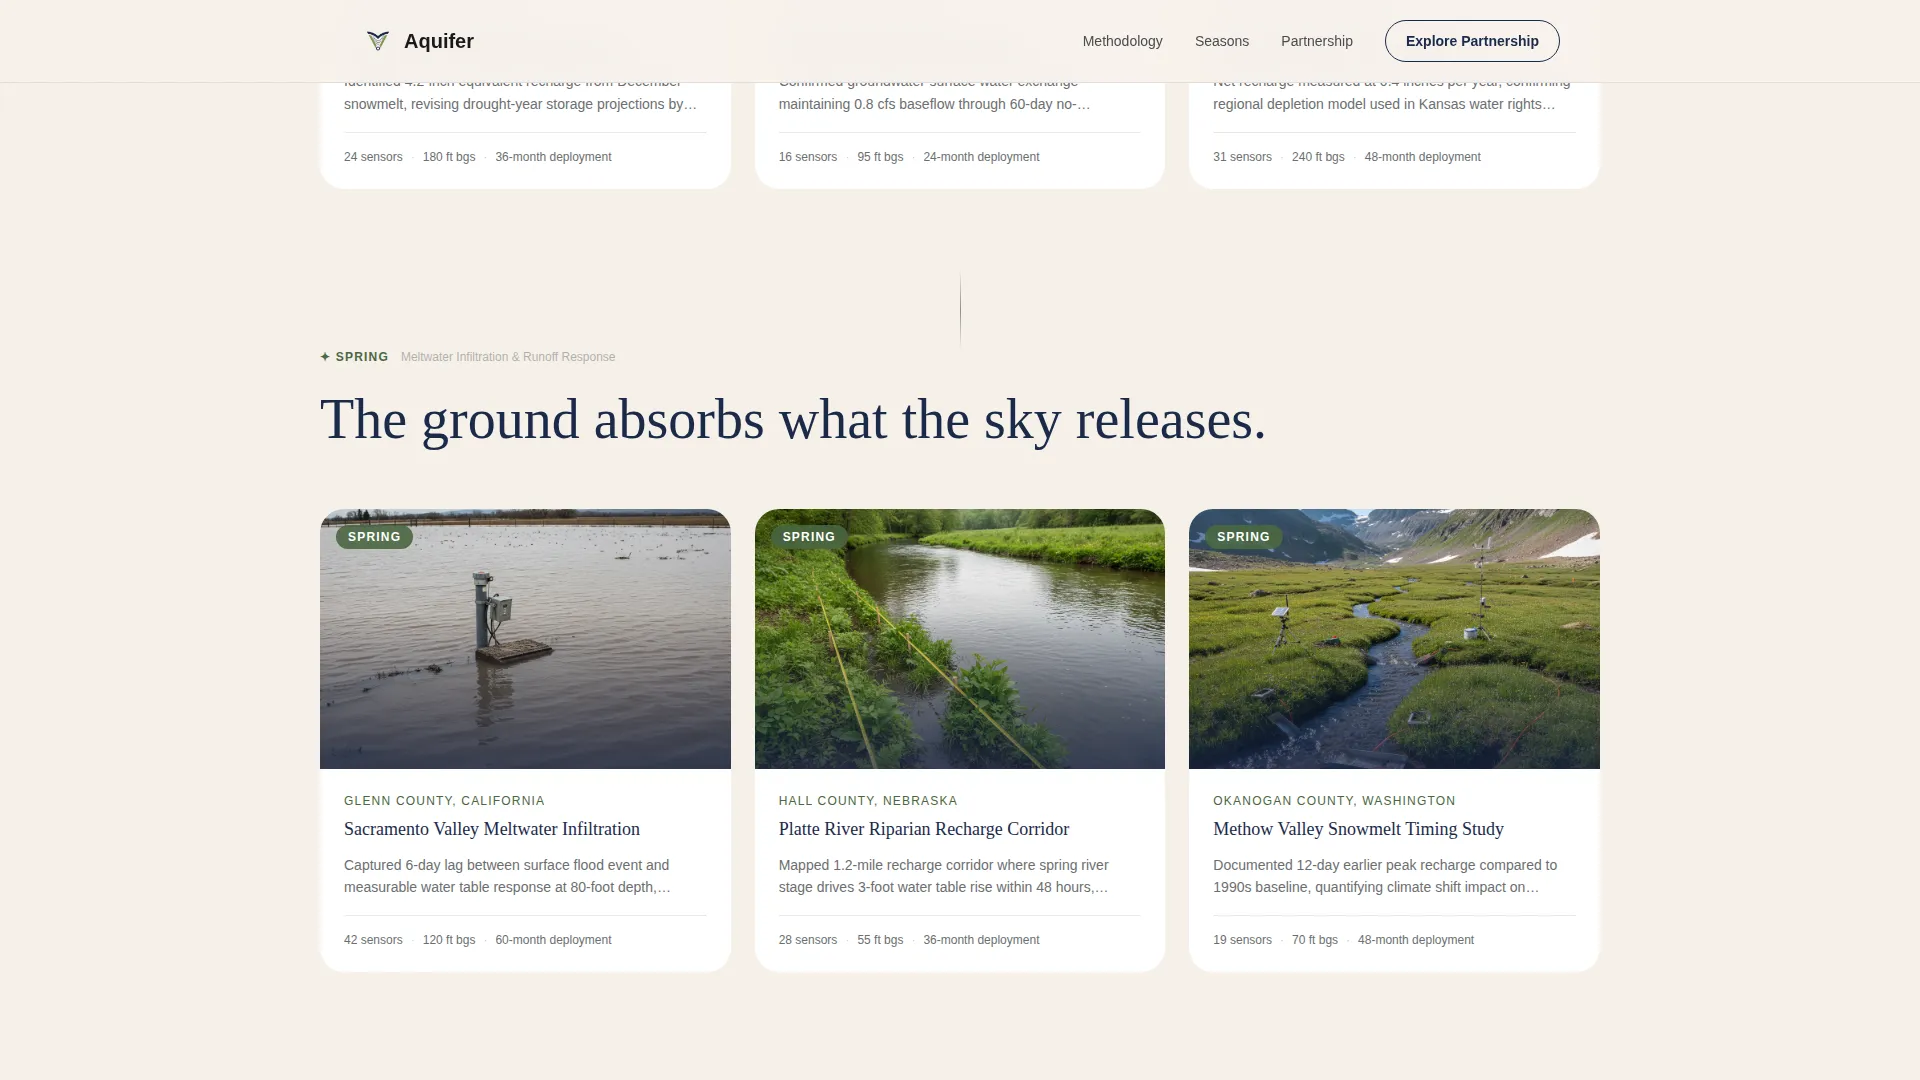
Seasonal Gallery with Expand-on-Click Panels
Four gallery rows correspond to winter, spring, summer, and autumn. Each row contains three to four project photographs. Clicking any image opens a detail panel showing site specifications, the sensor array deployed, and the specific insight that monitoring delivered.
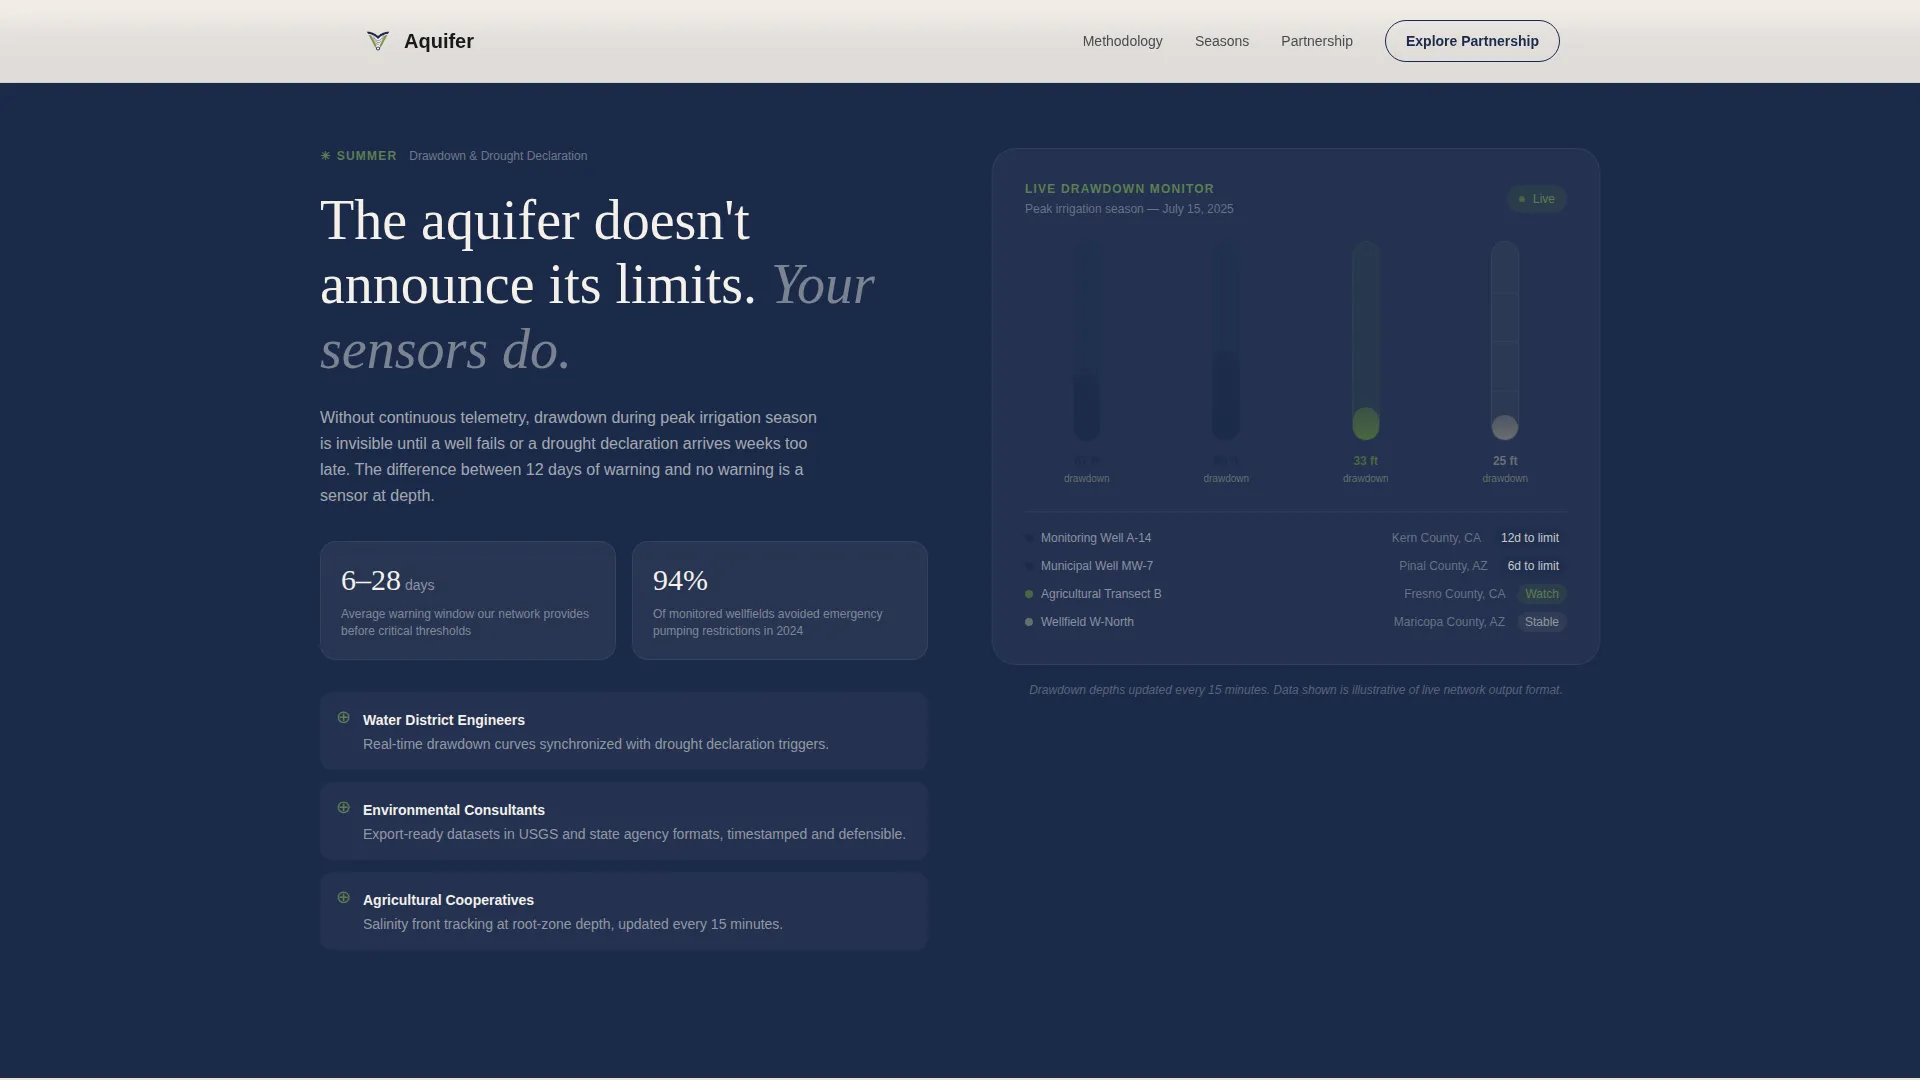
Animated Summer Drawdown Visualization
The summer section includes a scroll-linked well log animation. As the visitor scrolls, the log descends visually, making the stakes of unmonitored aquifer drawdown tangible without requiring prior technical knowledge.
Partnership Inquiry Form
The primary conversion form appears immediately after the summer drawdown section. It asks for watershed or basin name first, then organization type, then a free-text field prompting the visitor to describe the specific question their groundwater needs to answer.
Gated Seasonal Data Brief
A secondary conversion path offers a downloadable seasonal data brief. Access is gated behind an email address and a role field, qualifying leads who are researching methodology but are not yet ready for a direct conversation.
Seasonal Scroll Progression
GSAP ScrollTrigger drives the page's rhythm. Gallery tiles reveal with staggered animations. Each seasonal transition uses generous whitespace to create a contemplative, unhurried pace that matches the nature of long-cycle hydrological data.
Page sections overview
| Section | Purpose |
|---|---|
| Hero: Seasonal Photo | Establishes credibility and emotional tone through a cinematic full-viewport field image and animated headline |
| Winter and Spring Gallery | Shows field installations with meltwater context and recharge graph references in expandable project panels |
| Summer Drawdown Gallery | Visualizes well log descent through scroll-linked animation, raising the stakes of unmonitored aquifers |
| Partnership call to action Form | Captures primary leads with a three-field inquiry form positioned at the moment of highest perceived risk |
| Autumn Recovery Gallery | Completes the hydrological year narrative with time-lapse data curves and recovery project photography |
| Gated Data Brief | Offers a downloadable methodology document behind email and role fields for early-stage leads |
| Footer: Arc Split | Provides logo and tagline on the left with navigation links on the right for clean page closure |
Design & branding system
The visual identity follows a Nature-Inspired theme interpreted through a Japanese Zen color system. Every color placement is intentional, reflecting the logic of a raked stone garden where each element earns its position.
- Four palette values: crane white (#F5F0E8) for card surfaces, deep well indigo (#1B2A4A) for data-rich panels, stone garden gray (#6B6E70) for alternating backgrounds, and moss after rain (#4A6741) reserved for active states and live-data indicators
- Typography pairs Fraunces serif display type for headings with DM Sans for all body copy, balancing contemplative elegance with technical readability
- Negative space is treated as a design element throughout, with generous whitespace between seasonal sections to let data and imagery breathe
Mobile & speed optimization
The template is built desktop-first, reflecting the reality that the primary audience reviews detailed project data at workstations. Full mobile responsiveness is included so that the page remains functional and readable across all screen sizes.
- Server Components handle all static page sections to keep initial load efficient
- Client Components are isolated to animation-heavy areas including the typewriter hero, scroll-linked well log, and staggered gallery reveals
- Gallery detail panels and the gated data brief modal are built for touch-friendly interaction on smaller screens
How this template helps you convert
The page is structured to build trust across four seasons of proof before presenting any conversion request. This sequence mirrors how technical buyers in water management actually make decisions.
- The primary partnership inquiry form appears after the summer drawdown section, when the cost of unmonitored aquifers is most clearly felt, making the call to action feel like a natural response rather than an interruption
- The gated seasonal data brief provides a lower-commitment entry point, capturing email addresses and role data from buyers who are evaluating methodology before committing to a conversation
- The expand-on-click detail panels replace vague service claims with documented field evidence, including sensor array configurations and specific insights delivered at named sites
Other information about this template
This template is suited to environmental technology providers who operate across multiple watershed regions and need a single page that communicates rigor, continuity, and field experience to skeptical technical buyers.
- The template style is Gallery and Detail, combining visual storytelling with structured data presentation
- Creative direction follows a Seasonal and Moment framework, scrolling through the full hydrological year from winter snowpack recharge through autumn aquifer recovery
- The header concept uses Seasonal Imagery, specifically a late-autumn monitoring well photograph with morning mist and first low-angle light
- The landing page direction is Partnership and Business-to-Business, with both form paths oriented toward qualified lead capture rather than immediate transaction
- The category context is Agriculture and Environment, with a specific focus on soil and water conservation and the groundwater monitoring niche
Theme
Nature-Inspired
Creative direction
Seasonal/Moment
Color system
Japanese Zen
Style
Gallery + Detail
Direction
Partnership/B2B
Page Sections
Cinematic Hero with Animated Headline
Seasonal Gallery with Detail Panels
Scroll-linked Well Log Animation
Partnership Inquiry Form
Gated Seasonal Data Brief
Japanese Zen Layout System
Related questions
Who is this template designed for?
What conversion paths does this template include?
What animations are built into this template?
Can I update the seasonal gallery with my own project photography?
Is this template suitable for a service covering multiple watershed regions?


