Manufacturing Compensation | Free Website Template | Rocket
A manufacturing compensation benchmarking landing page built for HR directors, compensation analysts, and CFOs at mid-market manufacturers. The page uses a blurred salary table, a turnover cost section, a geographic wage map, and a multi-step pay competitiveness quiz to move visitors from recognizing their data gap to requesting a full benchmarking snapshot.
by Rocket studio
Quick summary
This landing page template is designed for a manufacturing compensation benchmarking platform. It opens with a bold accusatory headline on a navy background, walks visitors through blurred-then-revealed salary data, and drives them toward a multi-step assessment. The goal is to convert VP-level compensation analysts and HR directors into qualified leads by showing them exactly what they are missing.
Who this template is for
This template is built for teams selling data intelligence to manufacturing organizations. It speaks directly to the people who own compensation decisions at production-heavy companies.
- Compensation analysts and HR directors at mid-market manufacturers with 200 to 5,000 employees
- CFOs at automotive suppliers and food processing plants reconciling wage inflation against margin pressure
- Product and marketing teams launching a manufacturing pay benchmarking platform to a B2B audience
What problem this template solves
Most manufacturers still rely on annual salary surveys that are outdated the moment they are published. When a toolmaker gets a better offer from the plant across town, there is no time to wait for the next survey cycle.
- Compensation teams have no fast, role-specific way to check whether their current pay rates are competitive in their region
- HR directors cannot quantify the real cost of losing a skilled machinist until it is already too late
- CFOs need to tie wage decisions to margin data, but existing benchmarking tools are too broad to be actionable
What you get with this template
You get a fully structured, single-page landing page designed around a Problem to Solution narrative arc. Every section builds informational tension that resolves only when the visitor completes the assessment.
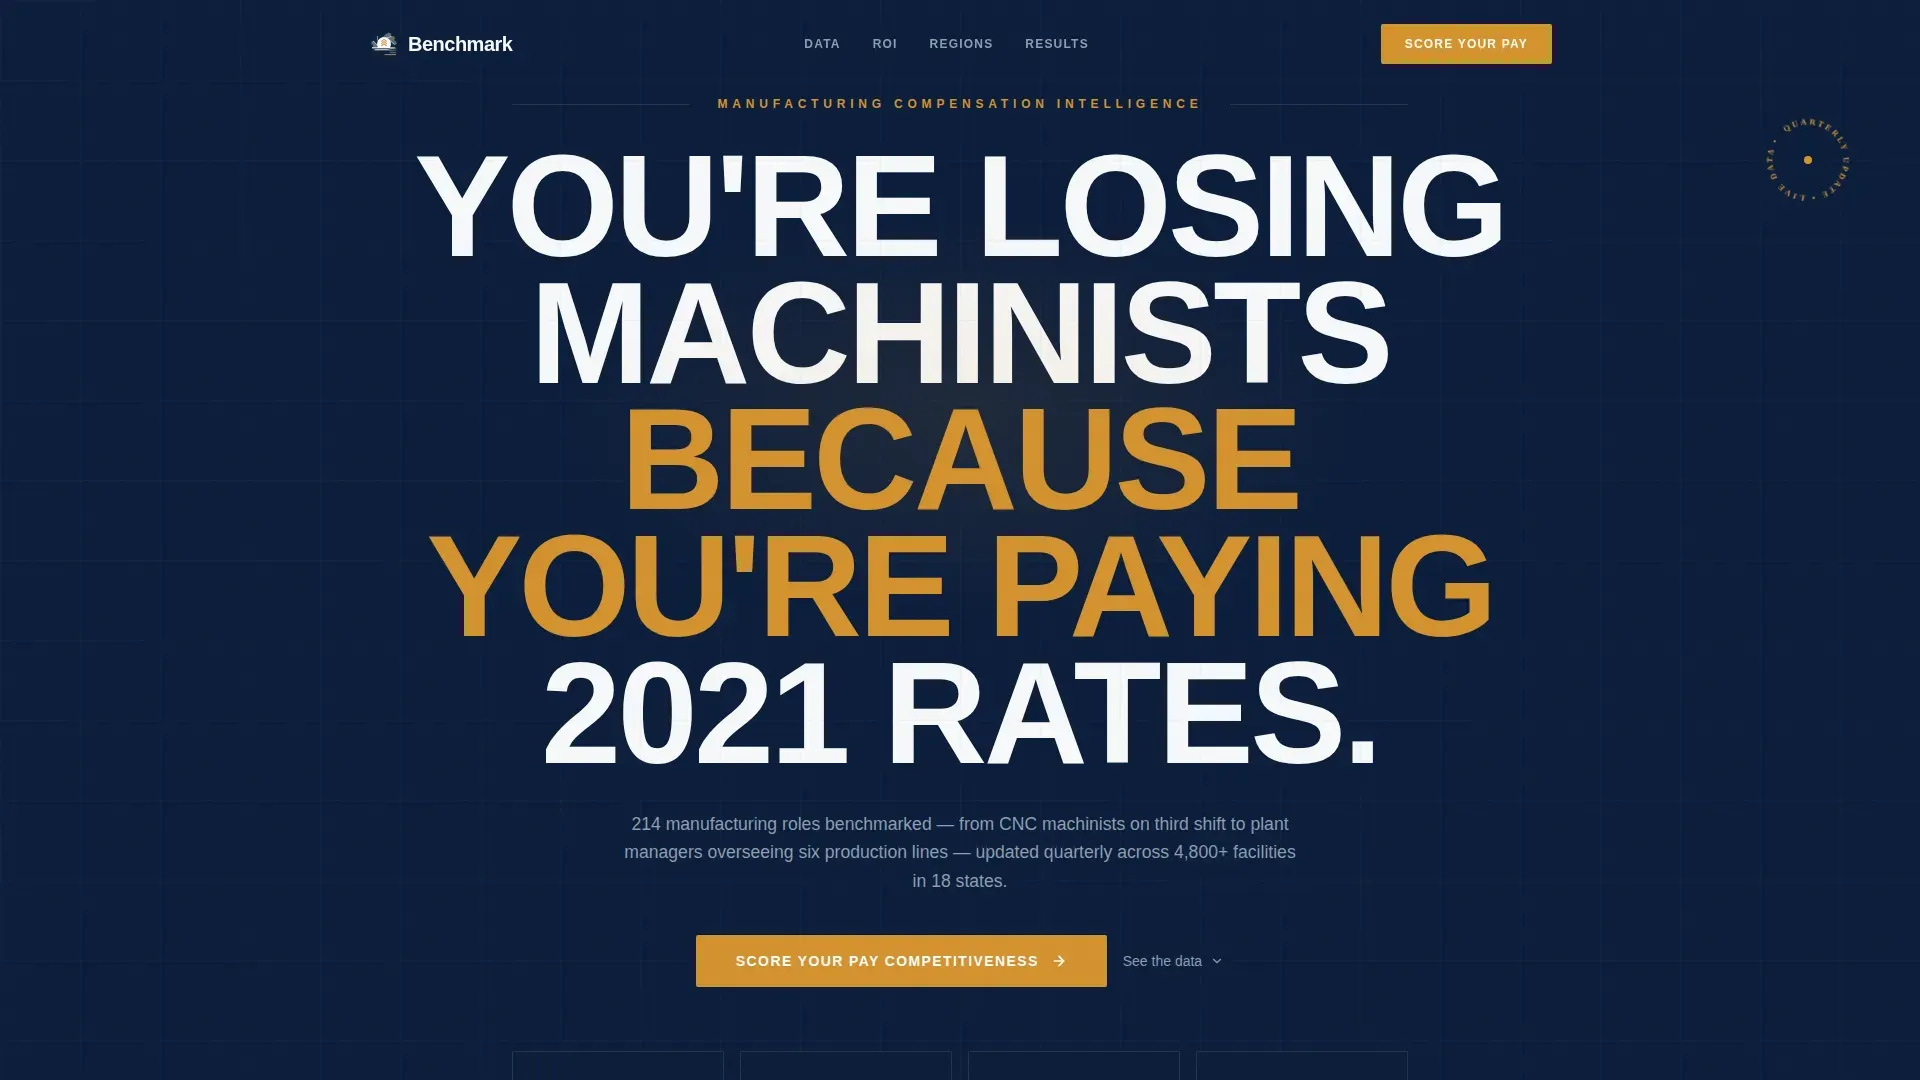
- A navy-dominant hero section with a large, accusatory headline and glassmorphic stat cards
- A blurred salary comparison table with one unlocked teaser row, a turnover cost section, a geographic wage map, testimonials, and a quiz-driven call to action
- A multi-step pay competitiveness quiz that collects sector, plant size, region, and role data before showing a preliminary grade and requesting a work email
Feature list
This template ships with six purpose-built sections and interactive components. Each one is designed to move a skeptical compensation professional closer to submitting their information.
Accusatory Hero with Stat Cards
The hero centers a heavy condensed headline on a full-width navy field. Below it, glassmorphic stat cards display platform-level numbers such as roles benchmarked, update frequency, and facility coverage. There is no image. The headline and data carry the visual weight.
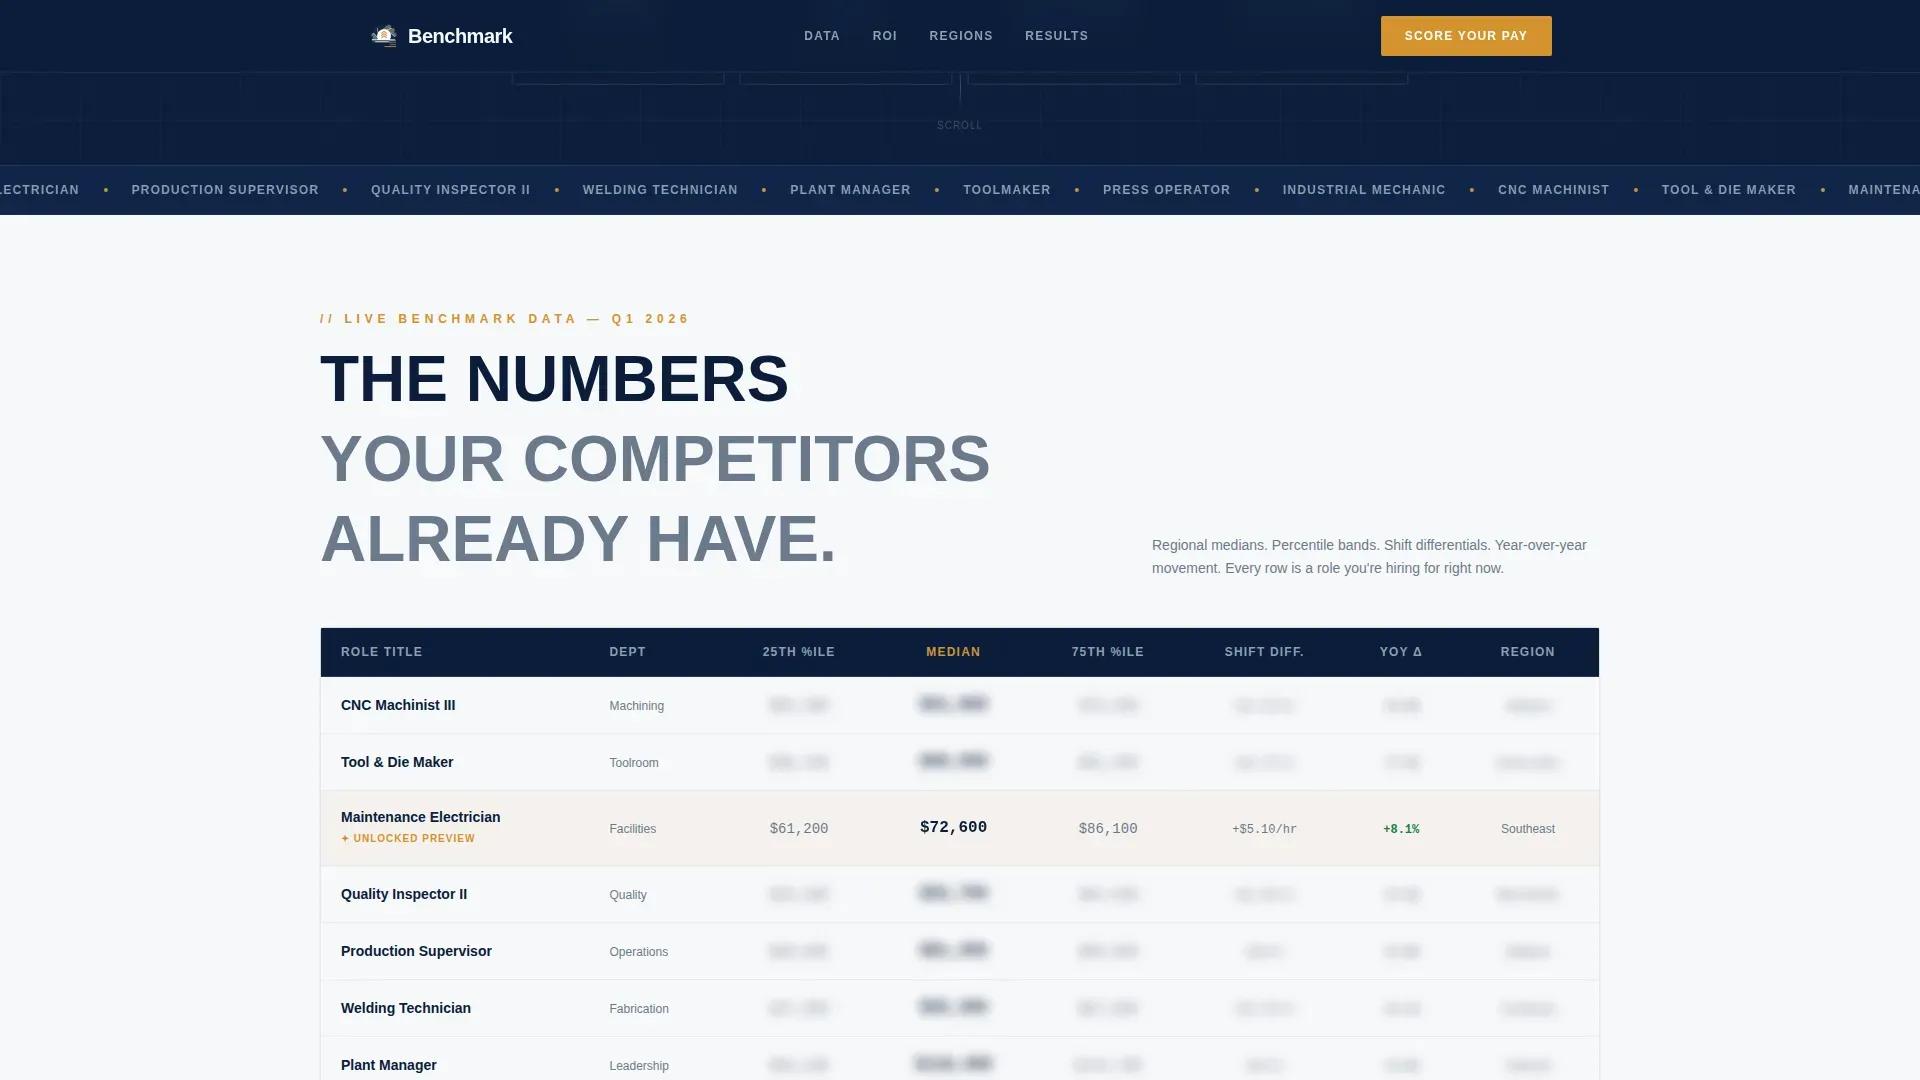
Blurred Salary Comparison Table
A structured comparison table shows real manufacturing job titles including Quality Inspector II, Maintenance Electrician, and Production Supervisor. Regional medians, percentile bands, and shift differentials are visible in layout but blurred. One row unlocks in full clarity as a teaser, making the data feel close enough to act on.
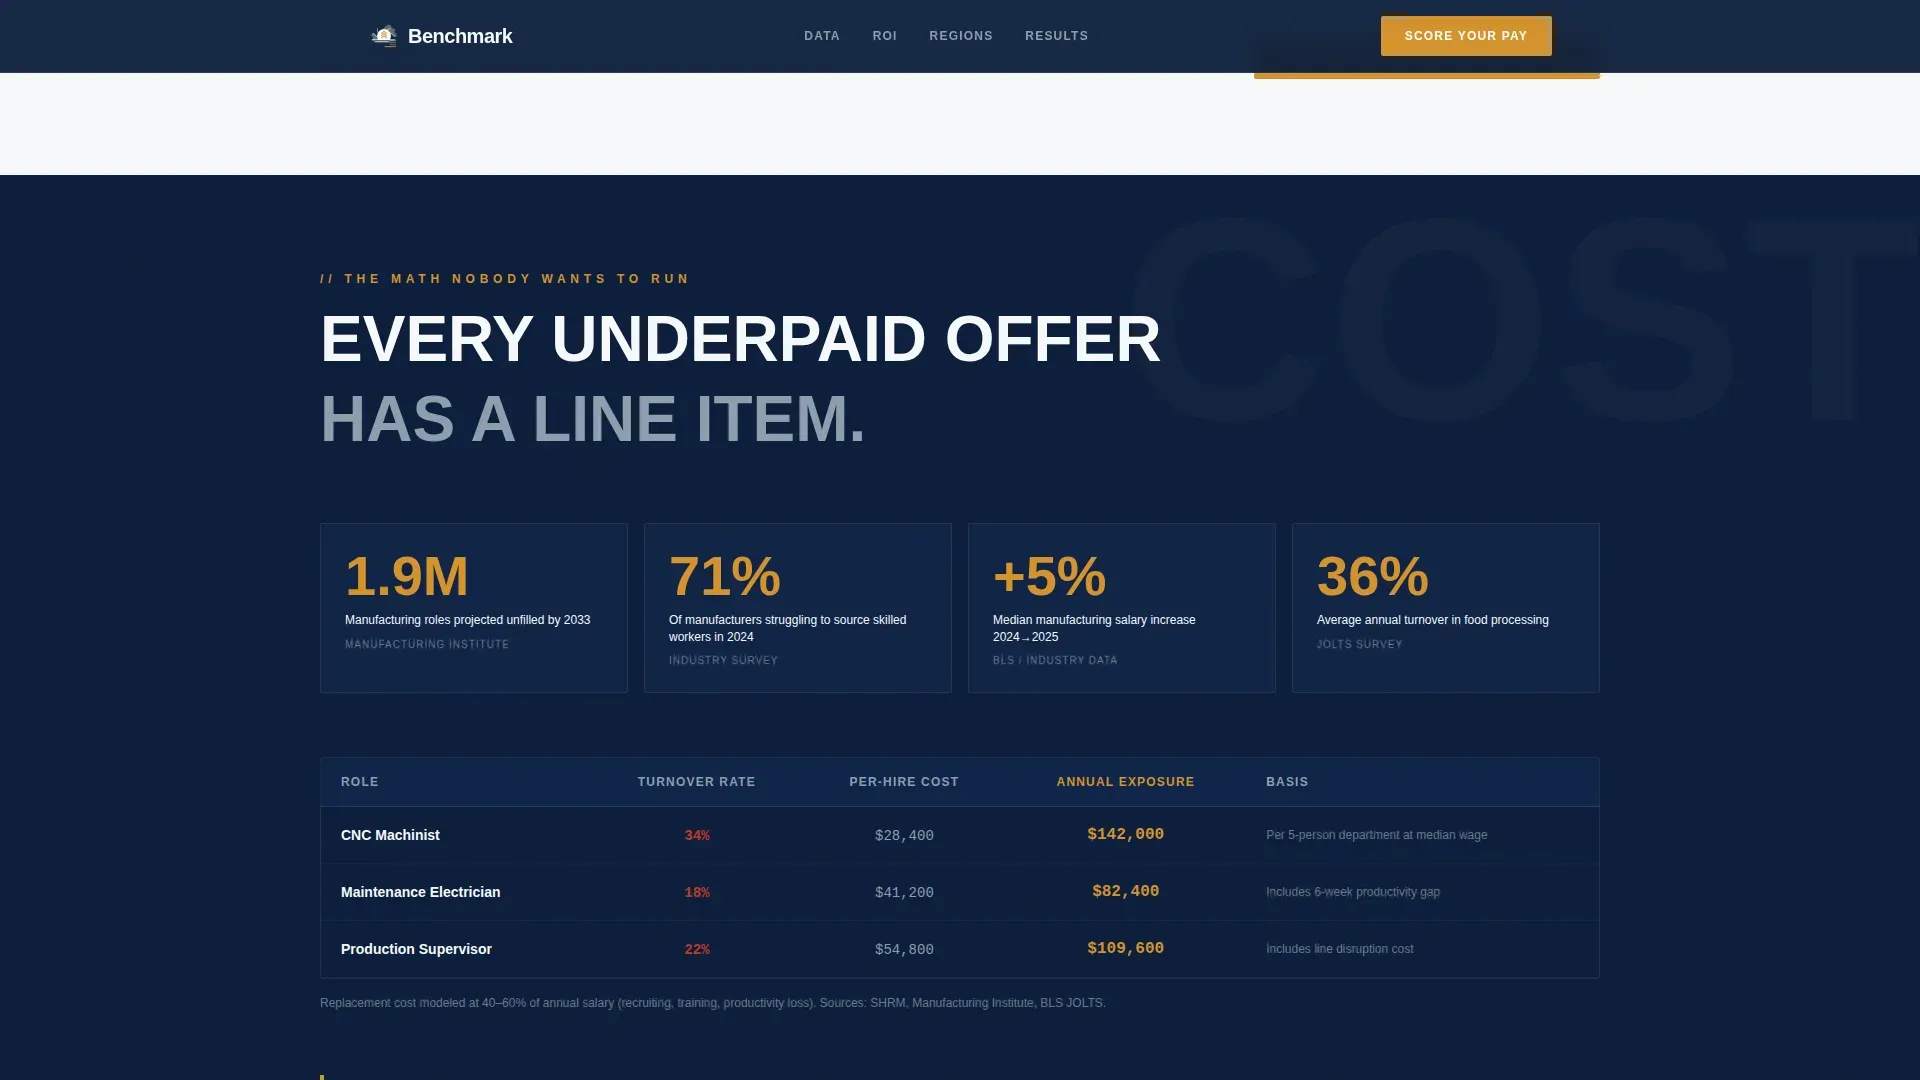
Cost of Inaction Section
This section converts turnover into specific dollar figures. It uses counter animations and visible math to show what a single skilled-trades vacancy costs in recruiting, training, and lost productivity. The numbers make inaction feel expensive rather than safe.
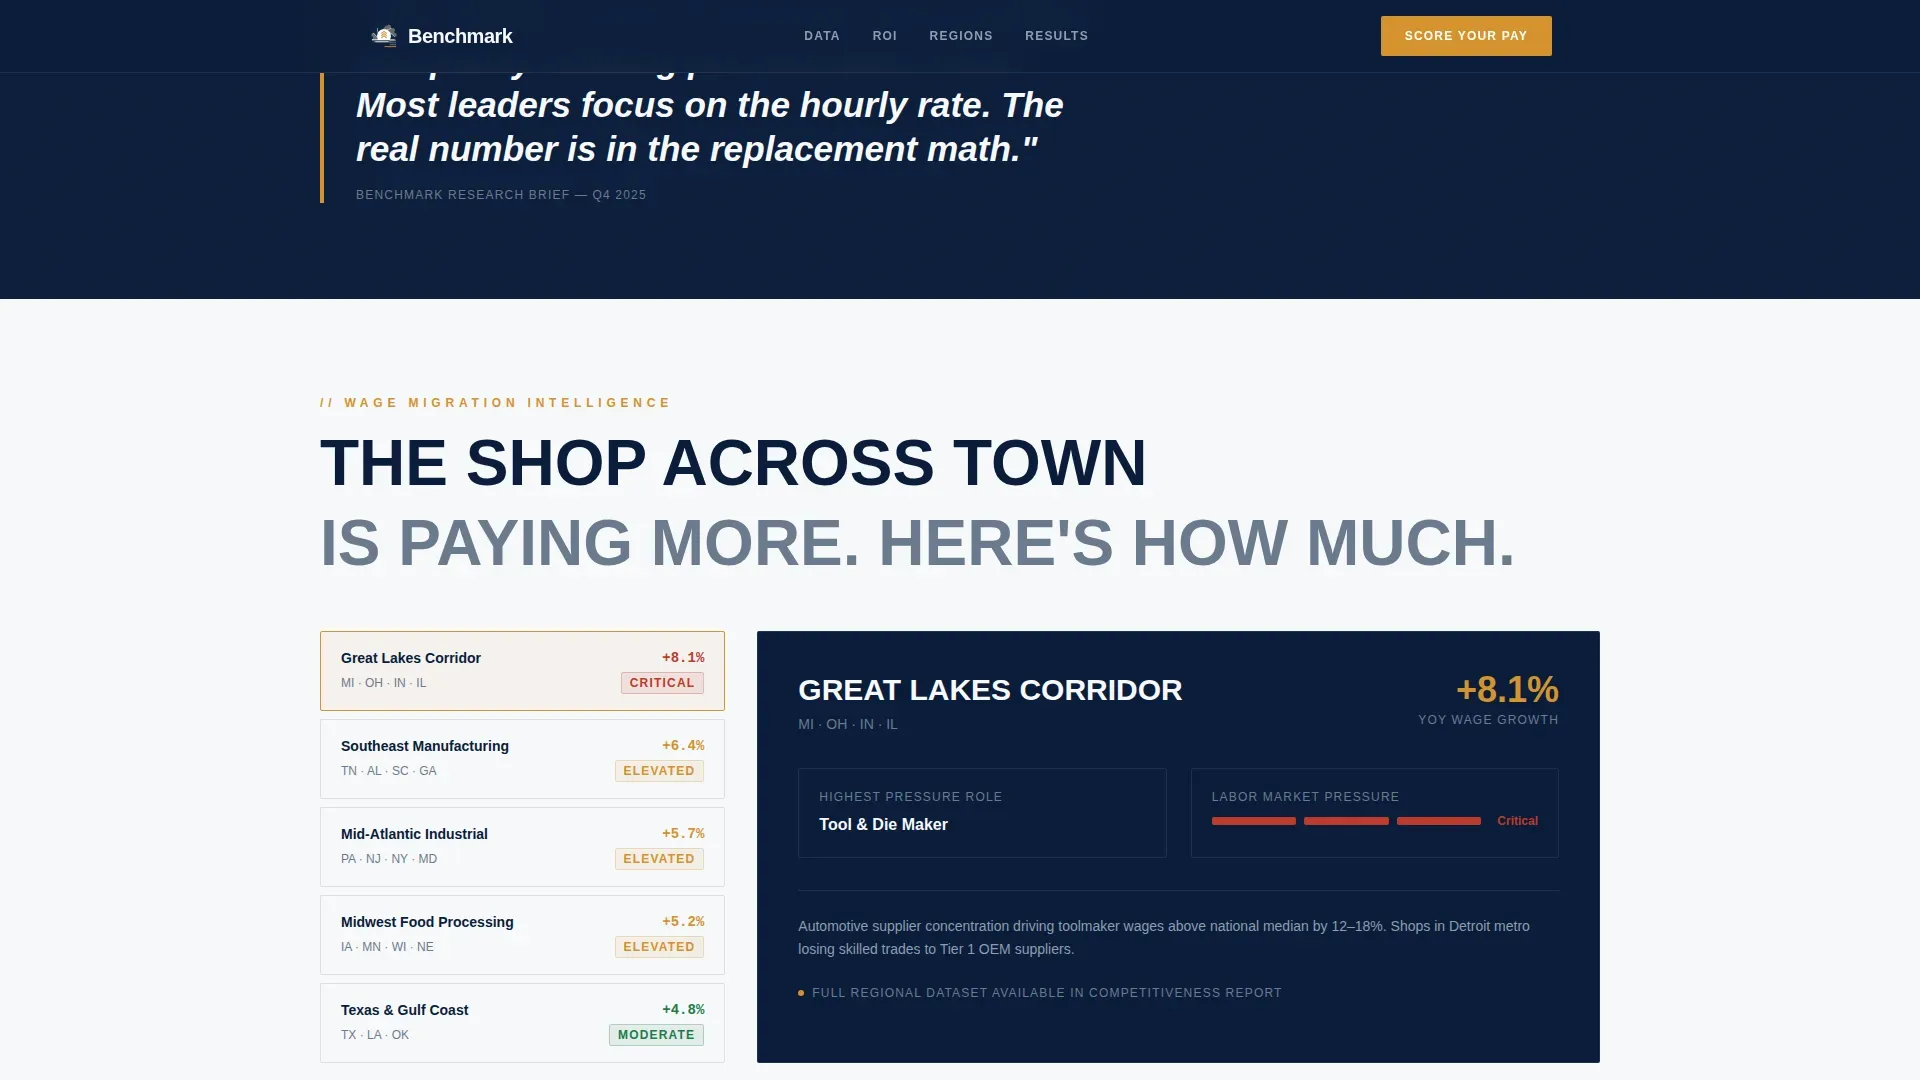
Geographic Wage Heat Map
A visual heat map narrative illustrates wage migration patterns across the Midwest, Southeast, and Mid-Atlantic regions. It shows visitors where pay rates are rising fastest and which directions skilled workers are moving. The section adds regional urgency to the platform's value.
Testimonials from Compensation Directors
Named testimonials appear with job titles, company types, and specific outcome metrics such as offer acceptance rate improvements and turnover reduction percentages. Social proof at this level of specificity is more credible than generic endorsements.
Multi-Step Pay Competitiveness Quiz
The assessment opens with sector selection, then narrows through plant size, region, and three to five hard-to-fill roles. Visitors receive a preliminary red, amber, or green competitiveness grade before seeing an email field. The quiz is built as a client-side component with a multi-step flow, separate from the static server-rendered sections.
Page sections overview
| Section | Purpose |
|---|---|
| Hero Headline | State the pay-gap accusation and display key platform stats |
| Blurred Salary Table | Show structured role data with a teaser unlock to create informational tension |
| Cost of Inaction | Quantify turnover costs in specific dollar terms to make inaction feel risky |
| Geographic Wage Map | Visualize regional wage migration patterns across major US manufacturing corridors |
| Testimonials Block | Deliver named social proof with measurable outcomes from comp and HR leaders |
| Quiz Call to Action | Guide visitors through a scored assessment before collecting their work email |
| Footer | Single-row developer-minimal footer with essential links |
Design & branding system
The visual identity follows a Corporate Precision theme. The palette is drawn from a classified-document aesthetic: authoritative, restrained, and built to direct the eye toward action.
- Navy (#0B1D3A) dominates headers and section backgrounds; machined steel (#6B7B8D) carries body text and table borders; clean-room white (#F7F8FA) creates breathing room between data-dense blocks
- Decision-point amber (#D4922E) is reserved exclusively for calls to action and key data highlights, appearing sparingly so the eye snaps to it immediately
- Typography pairs Barlow Condensed for headlines with DM Sans for body copy, reinforcing the precision and authority tone throughout
Mobile & speed optimization
The template is designed desktop-first. The data tables and multi-step assessment require desktop real estate to display correctly. A responsive breakpoint at 768 pixels ensures the layout adapts for tablet and mobile visitors.
- Static page sections are built as server components for fast initial load; the interactive quiz runs as a client component to keep interactivity smooth without slowing static content
- Scroll-triggered animations include blur-to-clear reveals, counter animations, a marquee ticker, and stagger reveals, all set to medium intensity so they add drama without hindering usability
How this template helps you convert
The conversion strategy is built on a principle of giving value before asking for identity. Every scroll tightens the information gap until the email field feels like a reasonable trade.
- The blurred salary table creates immediate informational hunger by showing visitors the structure of data they cannot yet read, then unlocking one row to prove the data is real and specific
- The turnover cost section and geographic wage map shift the emotional state from curiosity to urgency, making the cost of not having current benchmarks feel concrete and personal
- The multi-step quiz delivers a preliminary competitiveness grade before the email gate, so the visitor already has partial value in hand and sees the full snapshot as worth one work email
Other information about this template
This template is well suited for teams building or marketing a manufacturing compensation benchmarking platform in the B2B SaaS or data intelligence space. A few additional details worth noting before you choose or customize it:
- The page uses English copy with USD figures and US-centric regional data covering the Midwest, Southeast, and Mid-Atlantic
- Animation intensity is set to medium; the blur reveal, counter animations, and stagger reveals can be adjusted to match your brand's motion preferences
- The footer follows a single-row, developer-minimal pattern that keeps the page focused on the primary conversion goal
- This template supports a desktop-first experience while remaining responsive at 768px for secondary device visitors
Theme
Corporate Precision
Creative direction
Problem→Solution Arc
Color system
Navy Authority
Style
Comparison Table
Direction
Quiz/Assessment
Page Sections
Blurred Comparison Table with Teaser Unlock
Multi-step Pay Competitiveness Quiz
Turnover Cost Section with Counter Animations
Geographic Wage Heat Map Narrative
Named Testimonials with Outcome Metrics
Accusatory Hero with Glassmorphic Stat Cards
Related questions
Who is the primary audience this landing page is built to attract?
How does the blurred salary table work as a conversion tool?
When does the template ask visitors for their email address?
Can the quiz steps be customized for different sectors or regions?
What level of social proof does the template include?


