Powerful Franchisecompensation | Free Website Template | Rocket
Benchmark is a franchise compensation benchmarking landing page built for multi-unit operators who need real pay data, not guesswork. The modular card grid visualizes comp ranges across brand categories, roles, and metro markets. A seven-step quiz scores your comp plan instantly and delivers a personalized Comp Gap Score, gating the full report behind a short sign-up.
by Rocket studio
Quick summary
Benchmark is a data-driven franchise compensation landing page template built around a seven-step quiz, a modular card grid, and a sharp visual identity. It turns anonymous pay data across thousands of franchise locations into a personalized Comp Gap Score. The template is designed to convert multi-unit franchisees and franchise development professionals from curious visitors into qualified leads.
Who this template is for
This template is built for franchise operators and HR decision-makers who need accurate, location-specific pay data to stay competitive. It speaks directly to people making real compensation decisions at scale.
- Multi-unit franchisees managing ten or more locations who are losing talent to better-informed competitors
- Franchise development vice presidents writing offer letters and building brand-wide compensation frameworks
- Emerging franchise brand founders whose current comp plans are based on informal research rather than verified market data
What problem this template solves
Franchise operators consistently underpay or overpay because they lack access to real-time, role-specific compensation benchmarks. Generic salary tools do not account for brand category, metro market, or franchise-specific role structures. This template makes that gap visible and actionable.
- No clear view of how your pay rates compare to other operators in the same metro market or brand category
- Offer letters built on outdated or aggregated data that cause hiring losses before the conversation even starts
- No structured tool to score a comp plan or quantify the cost of misaligned pay at scale
What you get with this template
You get a fully structured, single-page landing experience built around lead generation through quiz completion. Every visual section is designed to communicate data credibility and drive forward motion toward the Comp Gap Score report.
- A hero section with a cinematic team photo, a bold floating stat ("14,212 franchise locations benchmarked this quarter"), and a primary call-to-action button labeled "Score Your Comp Plan"
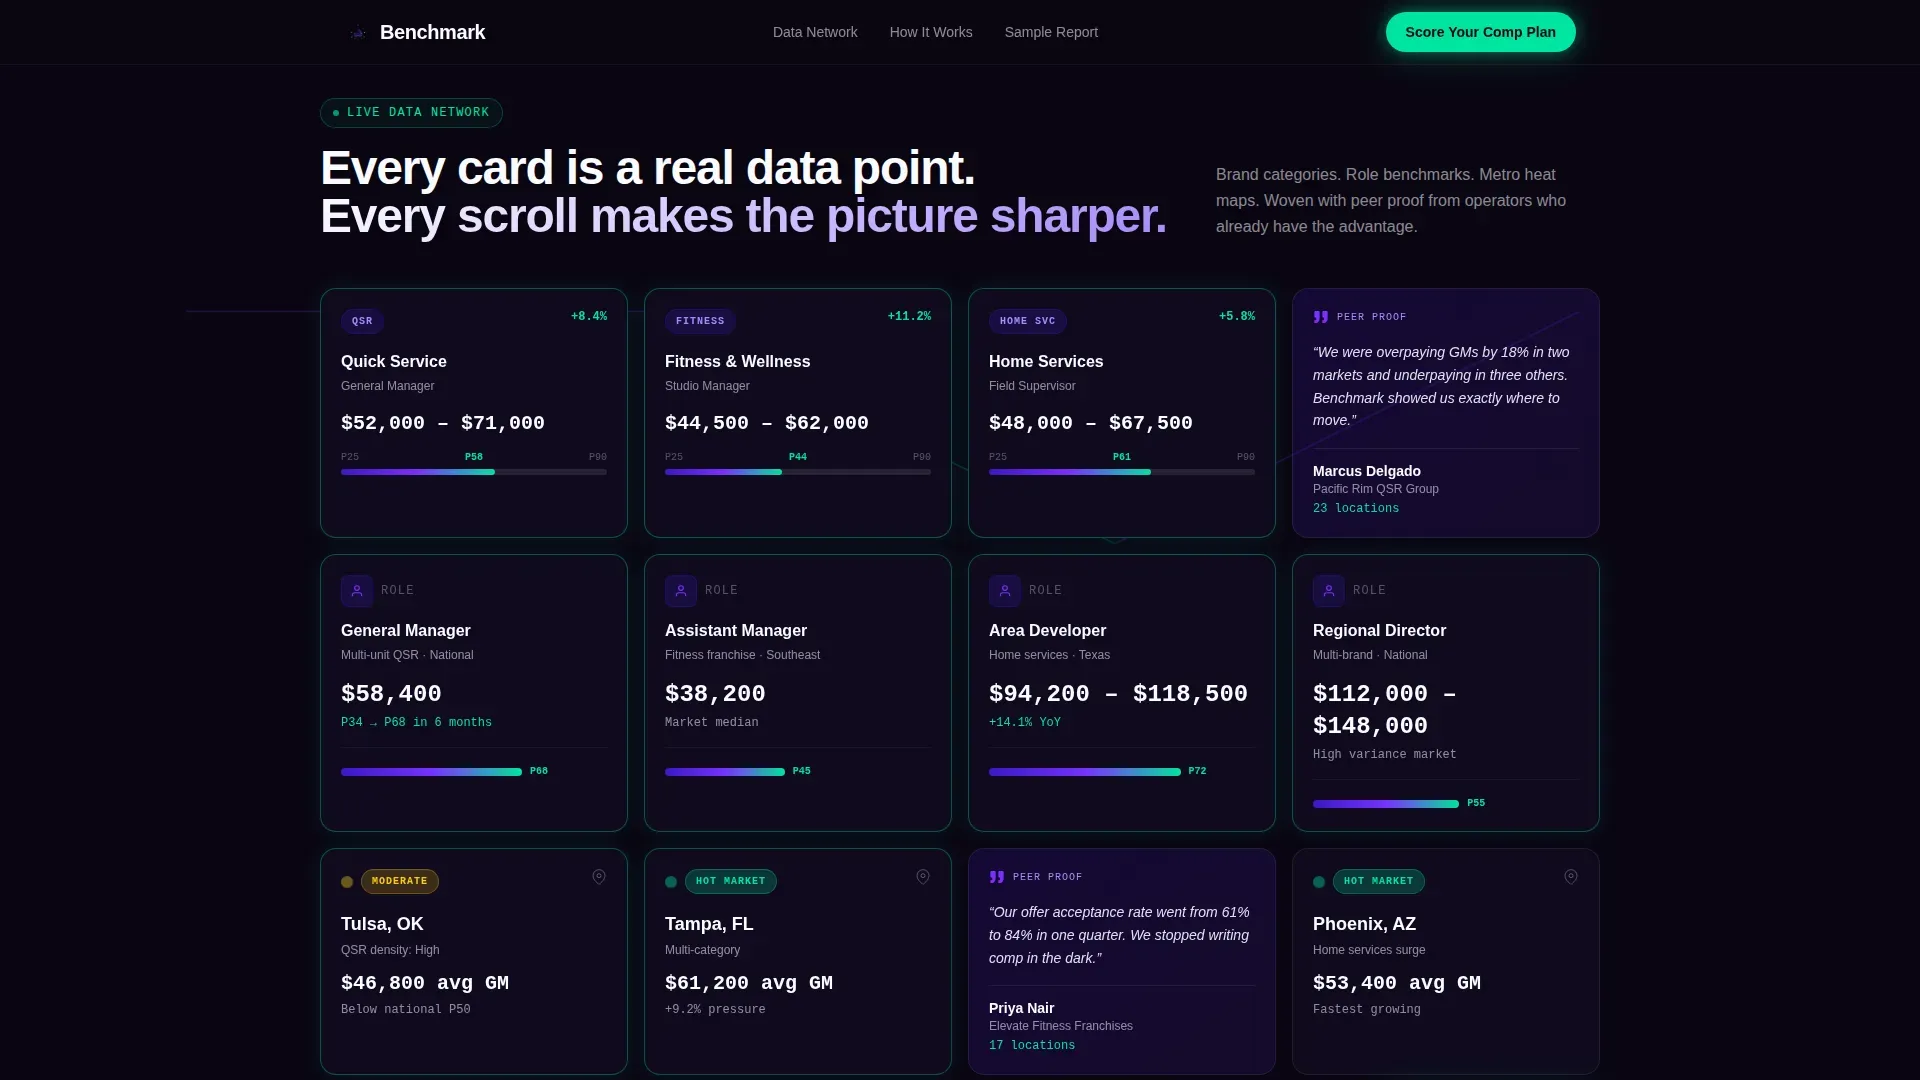
- A modular card grid organized by brand category, role type, and metro market, with animated connection lines that grow as the visitor scrolls
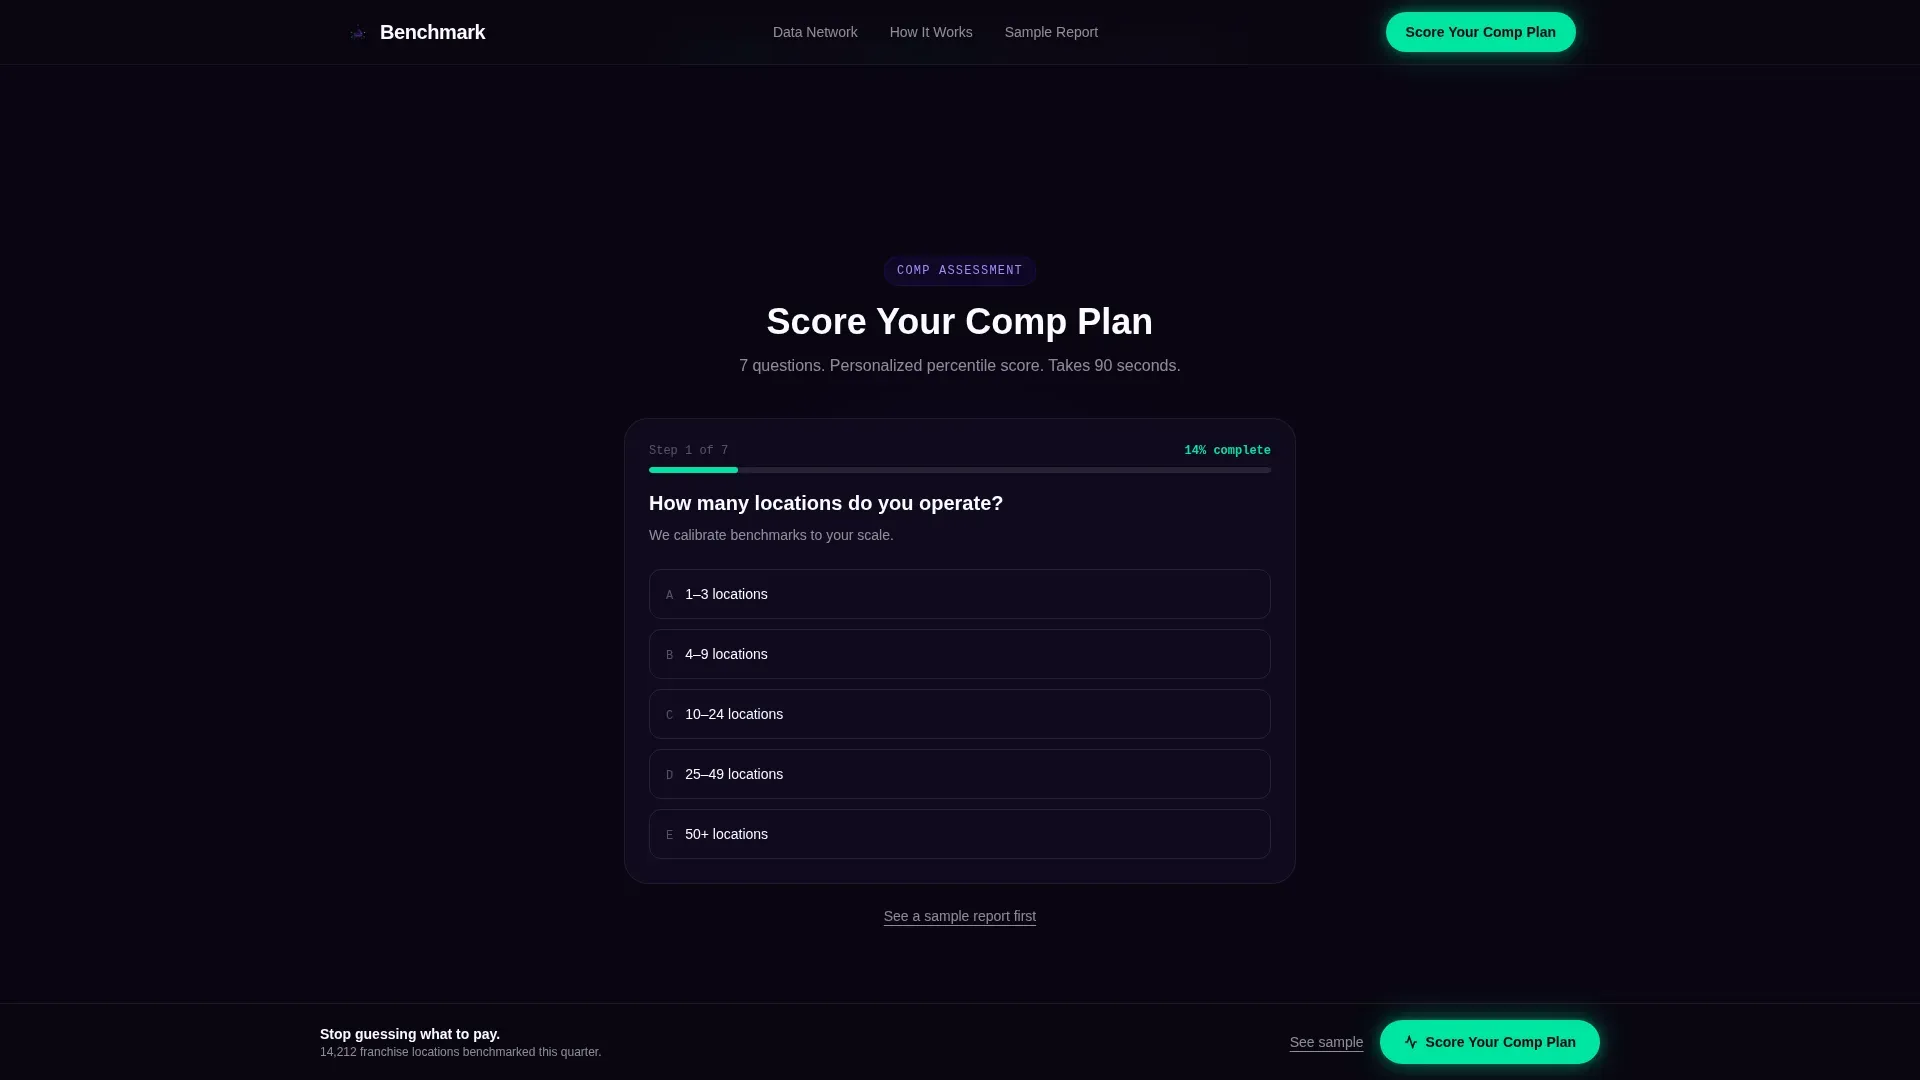
- A seven-step interactive quiz with a neon progress bar, per-step micro-insights, and a gated final report screen requiring name, email, and brand affiliation
Feature list
This template packages several purpose-built components into one cohesive lead-generation experience. Each feature below is directly grounded in the design brief.
Animated Network Card Grid
The card grid is organized into three rows: brand-category cards (quick-service restaurants, fitness, home services), role cards (general manager, assistant manager, area developer), and metro market cards with geographic heat dots. As the visitor scrolls, cards illuminate and connect with thin animated lines that visually grow the sense of a live data network.
Seven-Step Compensation Quiz
The quiz opens with the lowest-friction question first ("How many locations do you operate?") and progressively collects franchise brand, top hiring roles, current base pay ranges, and zip codes. Each of the seven steps reveals a micro-insight tied to the visitor's input, such as a percentile callout for general manager base pay in their market.
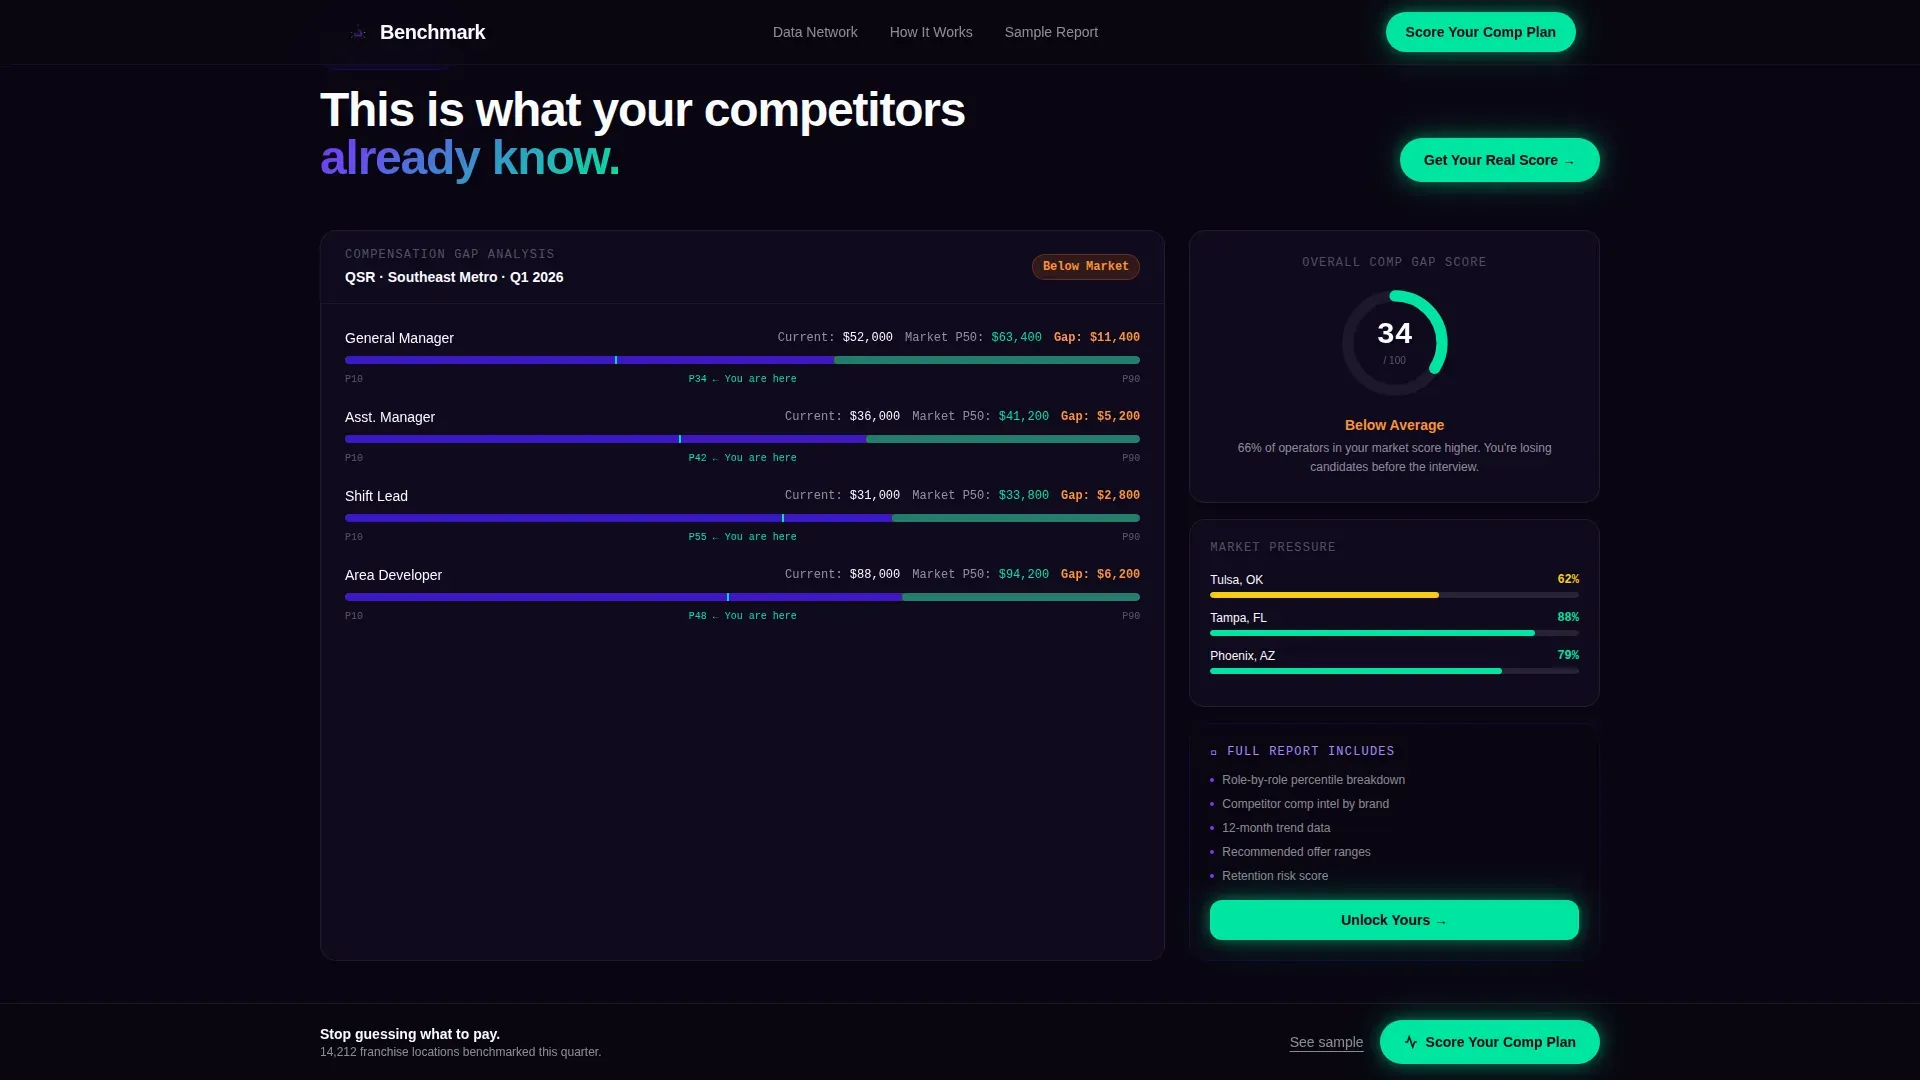
Gated Comp Gap Score Report
The final quiz screen delivers a personalized Comp Gap Score with a teaser visualization. The full report is gated behind a short form collecting name, email, and brand affiliation. A "See Sample Report" link beneath the primary call-to-action gives hesitant visitors a proof path before they commit.
Sticky Call-to-Action Bar
A sticky bottom bar reading "Score Your Comp Plan" appears after the visitor passes the second scroll point. It keeps the primary conversion action visible throughout the entire page without interrupting the reading experience.
Peer Proof Woven Into the Grid
Franchisee testimonial cards are shuffled directly into the data card grid rather than isolated in a separate section. This placement makes social proof feel like part of the dataset itself, reinforcing credibility at every scroll position.
Sample Report Teaser Section
A dedicated section previews the report visualization before the gate. It gives data-skeptical visitors a concrete sense of what the full Comp Gap Score report looks like, reducing hesitation and supporting quiz completion.
Page sections overview
| Section | Purpose |
|---|---|
| Hero with stat | Establish credibility and drive first call-to-action click |
| Network card grid | Show live compensation data breadth across categories, roles, and markets |
| Seven-step quiz | Collect visitor data while delivering real-time percentile micro-insights |
| Testimonials in grid | Reinforce peer proof at multiple scroll positions inside the data grid |
| Sample report teaser | Preview the gated report visualization to reduce sign-up hesitation |
| Sticky call to action bar | Keep the primary conversion action visible after the second scroll |
| Footer | Provide horizontal navigation and brand trust closure |
Design & branding system
The visual identity follows a Startup Velocity theme built around an Electric Indigo color system. The palette is intentionally data-dense and luminous, evoking a financial terminal rebuilt with early-stage startup energy.
- Core colors: deep mission-control indigo (#3D17C6) for backgrounds and structure, charged violet (#7B2FFF) for hover states and active cards, stark white (#FAFBFF) for card surfaces, and neon green (#00E5A0) for data callouts and progress indicators
- Typography: DM Sans for headings and body copy, JetBrains Mono for all numerical data and percentile displays
- Visual tone: high-contrast, dark, and luminous with card illumination on scroll, thin animated network lines, and overexposed natural lighting in the hero team photo
Mobile & speed optimization
The template is built desktop-first to honor the data-heavy dashboard aesthetic of the brief. The layout adapts to smaller screens without sacrificing the core quiz or card grid interactions.
- Desktop-first layout prioritizing the card grid density and quiz readability on large screens
- Responsive mobile layout that preserves the sticky call-to-action bar, the quiz progress bar, and the key stat callouts
- Server Components handle static sections while Client Components power the quiz interactivity and card animations, keeping the page load practical for data-rich content
How this template helps you convert
The conversion architecture of this template is deliberate and layered. Every section either builds trust in the data or moves the visitor one step closer to completing the quiz.
- The hero floating stat ("14,212 franchise locations benchmarked this quarter") establishes data scale immediately, giving first-time visitors a reason to trust the platform before scrolling further.
- The progressive seven-step quiz delivers micro-insights at each step, rewarding engagement and making the Comp Gap Score feel personally earned rather than generic, which increases form completion intent.
- The "See Sample Report" secondary path captures visitors who are not yet ready to submit their information, keeping them in the funnel rather than losing them to bounce.
Other information about this template
This template is purpose-built for the franchise compensation benchmarking niche within the broader HR and hiring category. It is not a generic HR landing page but a specialized tool for franchise-specific pay intelligence.
- The template style is Card Grid (Modular), making individual data cards easy to update with new brand categories, roles, or metro markets as the dataset grows
- The quiz flow is designed around progressive disclosure, a pattern that consistently reduces drop-off by starting with the easiest question and building toward higher-commitment inputs
- Regional specificity such as metro references (Tulsa, Tampa, and similar markets) is baked into the design language to signal local data depth to visitors who operate in specific territories
- The footer follows a Vercel Horizontal Flow pattern, providing clean navigation closure without visual noise that would distract from the conversion path above

Theme
Startup Velocity
Creative direction
Network Effect
Color system
Electric Indigo
Style
Card Grid (Modular)
Direction
Quiz/Assessment
Page Sections
Animated Network Card Grid
Seven-step Compensation Quiz
Gated Comp Gap Score Report
Sticky Score Your Comp Plan Bar
Peer Proof Inside the Grid
Sample Report Teaser Section
Related questions
Who is this template designed for?
What does the seven-step quiz collect from visitors?
Can a visitor preview the report before submitting their details?
What makes this different from a generic HR landing page template?
How is the Comp Gap Score delivered to the visitor?


