Precision Automotive Sustainability Landing Page Template
This audit precision carbon tracing automotive sustainability landing page template is built for decarbonization consultancies serving VP-level sustainability officers at OEMs and Tier-1 suppliers. It combines a data-driven header, a five-phase zigzag methodology reveal, and a lead capture form into one high-conviction, single-page experience designed to convert serious B2B buyers before they ever fill out a form.
by Rocket studio
Quick summary
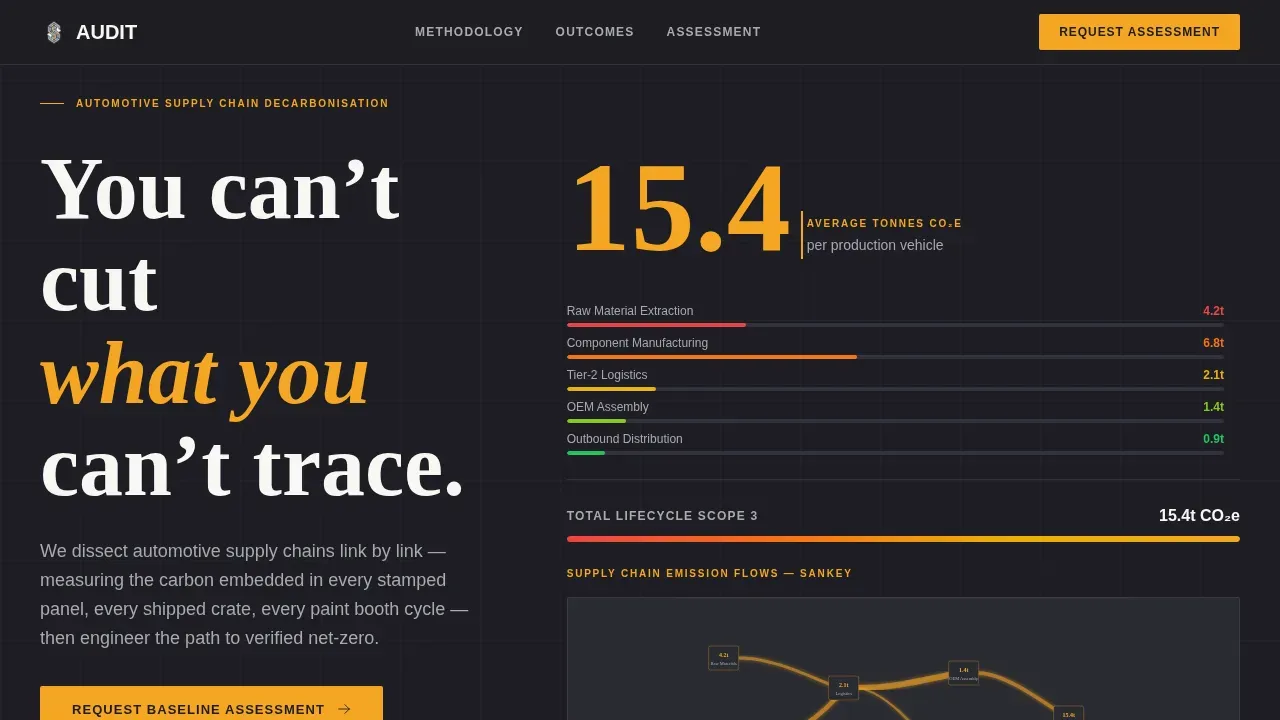
This template gives an automotive sustainability consultancy a precise, industrial-grade landing page. It opens with an animated carbon counter and a live Sankey diagram, then walks visitors through five methodology phases using alternating zigzag sections. Every scroll reveals how messy supply chain data becomes verified, regulator-ready reporting. The page closes with a dual-path lead capture: a baseline assessment request form and a gated Scope 3 readiness checklist.
Who this template is for
This template is designed for B2B consultancies that work inside automotive supply chains and need to earn trust with senior decision-makers before asking for a conversation. It is a strong fit for teams that lead with data and methodology rather than marketing language.
- Decarbonization consultancies serving OEMs and Tier-1 suppliers on EU CSRD, CDP, or SBTi compliance
- Sustainability advisory practices that conduct carbon audits, life cycle assessment work, and Scope 3 emissions reporting
- Environmental services firms building a lead pipeline among VP-level sustainability officers and procurement teams who demand verified credentials
What problem this template solves
Automotive supply chains carry enormous hidden carbon risk. Scope 3 emissions from upstream suppliers, inbound logistics, and energy-intensive paint and stamping processes often account for the majority of a vehicle's total carbon footprint. Yet most consultancy websites fail to demonstrate the rigor needed to win trust at the VP level. The result is a long sales cycle driven by doubt rather than evidence.
This template solves that credibility gap by showing methodology before asking for anything.
- No proof, no pipeline: Sustainability officers reviewing a generic services page have no reason to submit a form. This template puts quantified data and structured processes front and center to remove that hesitation.
- Fragmented reporting pressure: Companies face overlapping regulatory requirements from CSRD, the Greenhouse Gas Protocol, and procurement-led lifecycle assessment demands. The page frames those pressures clearly and positions the consultancy as the structured answer.
- Weak differentiation: Most carbon consultancy pages look identical. This template uses industrial precision design and a transparent process reveal to create a distinct, memorable first impression that supports a longer diligence process.
What you get with this template
This is a fully structured, single-page template with every section pre-built to the brief. You get a complete layout ready to customize with your consultancy's data, client outcomes, and brand copy. No layout decisions to make, no components to assemble from scratch.
- Full zigzag section layout covering five methodology phases, each with a chaos-input side and a structured-output side connected by amber progress bars
- Pre-built lead capture form collecting company name, production volume range, primary reporting framework, and a single open-ended question about the visitor's biggest reporting gap
- Gated Scope 3 checklist module offering a secondary conversion path behind an email capture, so visitors who are not ready to book a call can still enter the pipeline
Feature list
This template was assembled from a detailed brief that specifies every component. Each feature below reflects something explicitly built into the layout.
Animated CO₂ Counter and Sankey Header
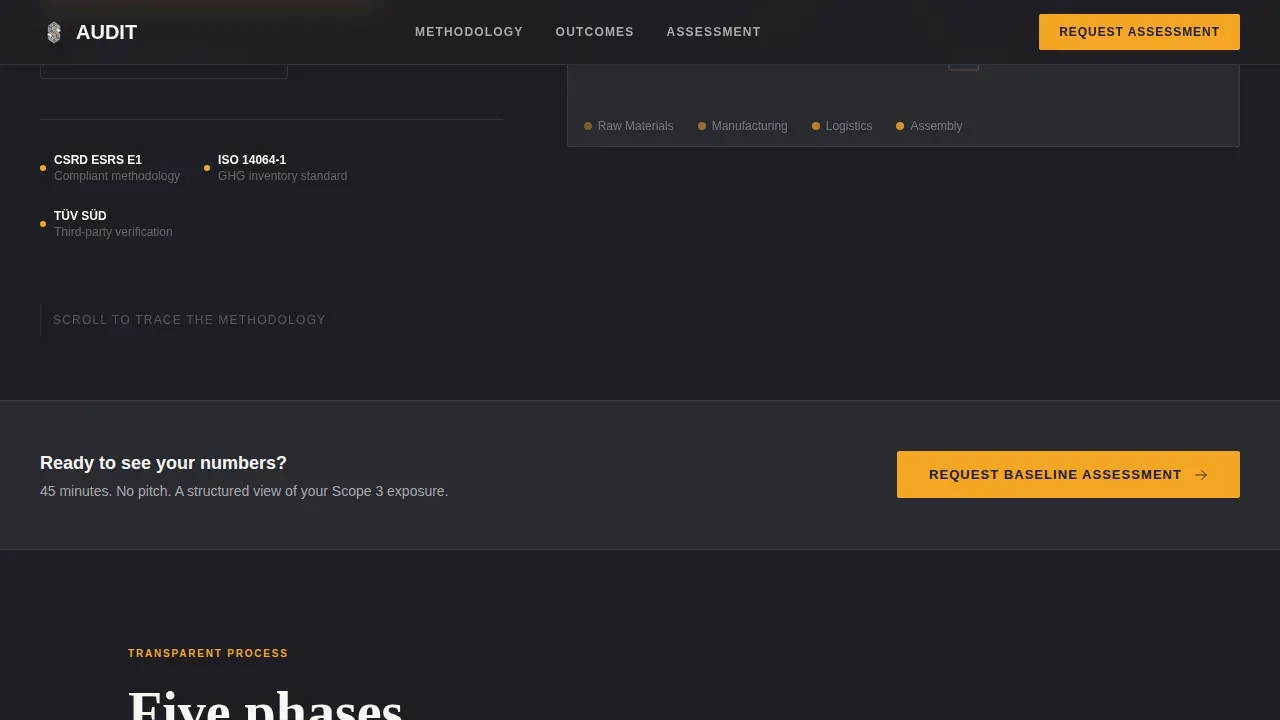
The header section replaces stock imagery with live data. An animated counter tallies the average hidden carbon embedded in a single production vehicle, climbing from raw material extraction through assembly to dealer delivery. A minimal Sankey diagram traces emission flows across supply chain stages in real time. There is no hero photograph. The data is the visual, and the headline "You can't cut what you can't trace" fades beneath it.
This approach reflects a core truth in carbon reporting: organizations can only reduce emissions they have already learned to measure. Carbon footprint calculation software helps organizations measure their greenhouse gas emissions precisely, and this header makes that need visceral before any copy explains it.
Five-Phase Zigzag Methodology Reveal
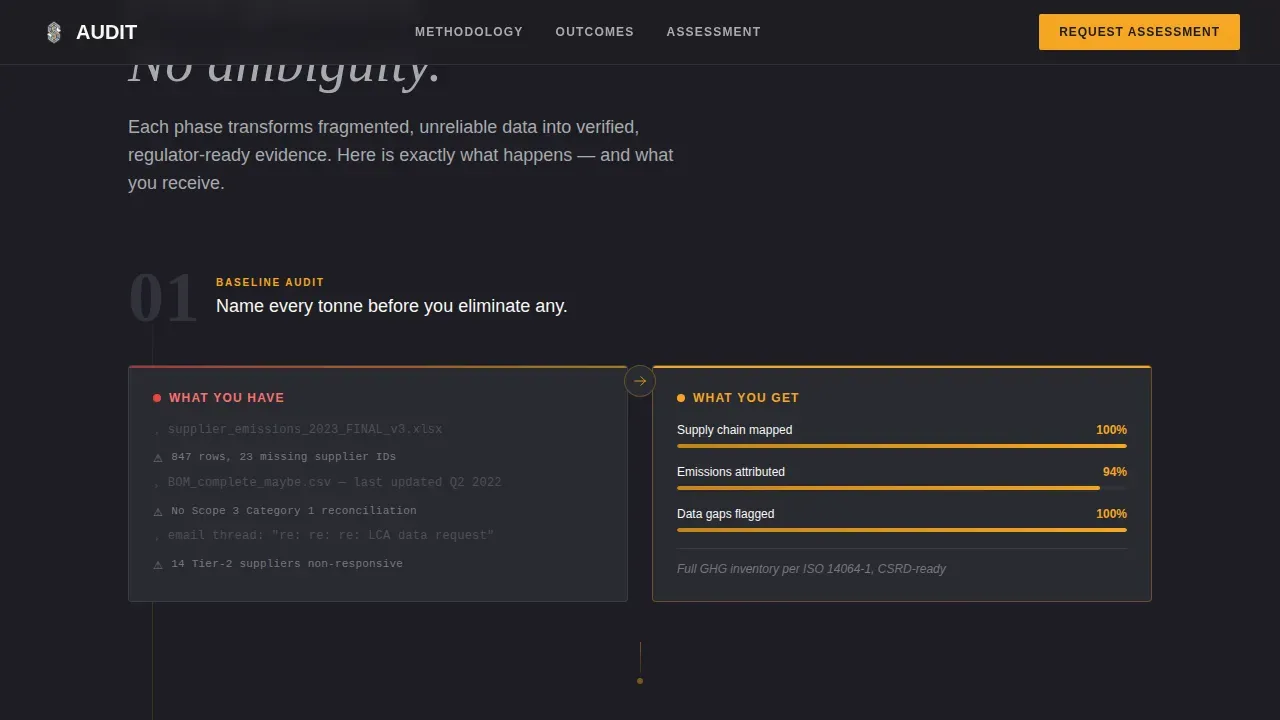
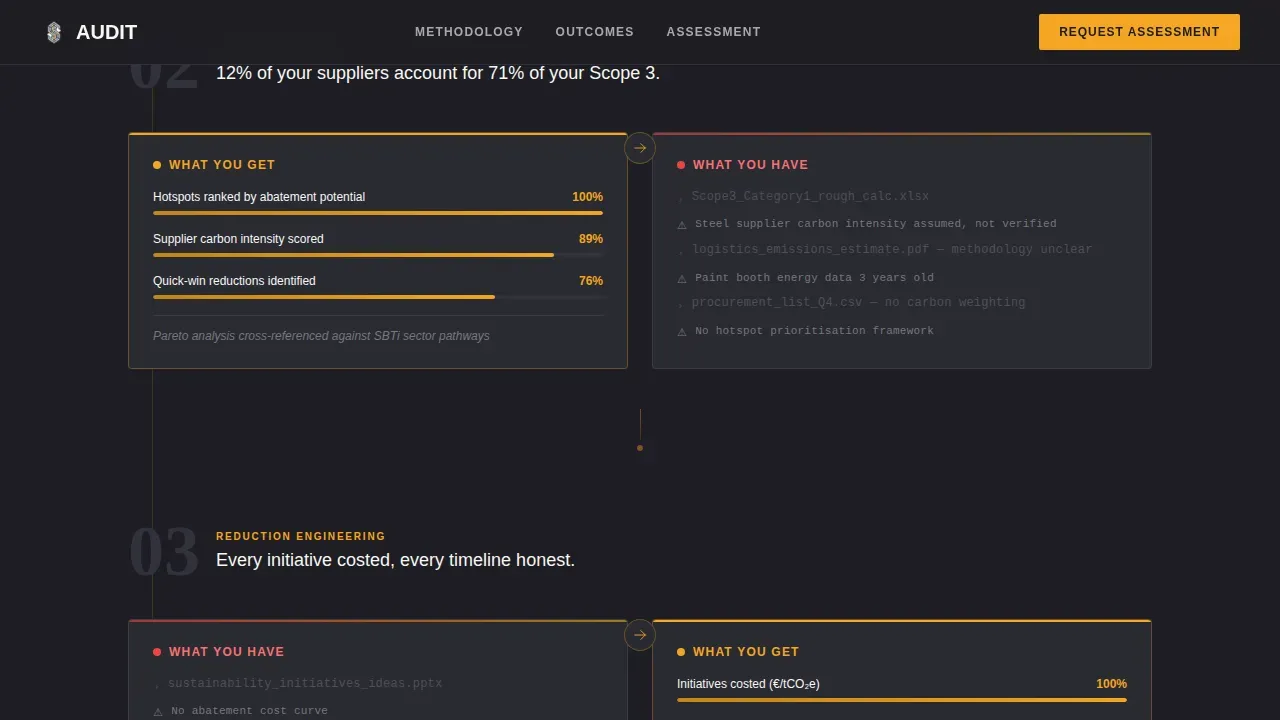
Five alternating sections scroll the user through the full consultancy methodology: Baseline Audit, Hotspot Mapping, Reduction Engineering, Supplier Alignment, and Certification and Reporting. Left-side panels display the raw input state, including messy spreadsheets, unstructured bill-of-materials data, and fragmented supplier disclosures. Right-side panels display the structured output: interactive dashboards, verified reduction curves, and regulator-ready documentation.
Amber progress bars connect each pair. The scroll sequence is designed so that the transformation from disorder to control becomes the central narrative. Scope Categorization within this flow organizes emissions into Direct, Indirect, and Value Chain categories to satisfy audit compliance at each stage.
Dual Lead Capture with Baseline Assessment Form
The primary call to action, "Request Your Baseline Assessment," appears first after the header data sequence and repeats after the methodology reveal. The form captures four inputs: company name, annual production volume range, primary reporting framework selected from a CSRD, CDP, and SBTi dropdown, and a single open field asking about the visitor's biggest reporting gap right now.
This structure gives the consultancy immediately qualified lead data. Every submission carries context about the prospect's scale, regulatory pressure, and specific pain point, enabling a focused first conversation.
Gated Scope 3 Readiness Checklist
A secondary conversion path sits below the primary form. Visitors who are not ready to book a call can download a Scope 3 readiness checklist by providing only their email address. This low-friction option keeps cautious buyers in the pipeline. It also demonstrates that the consultancy is willing to provide information and detailed guidance before any commercial commitment.
The checklist download reinforces the page's core promise: proof of rigor first, conversation second.
Evidence, Statistics, and Testimonial Sections
Between the methodology reveal and the lead form, the template includes a quantified outcomes block. Amber data highlights display reduction percentages, compliance milestones, and timeline metrics. A testimonials section features specific quotes from named sustainability VPs with company roles and regulatory outcomes noted.
Social proof at this level reduces the risk perception for a VP who is about to recommend a vendor to their board. Named, role-specific testimonials carry far more weight than generic endorsements.
Corporate Precision Design System
The Charcoal and Amber color system runs throughout the layout. Deep graphite (#1E1E24) anchors primary backgrounds. Machined aluminum (#A8A9AD) surfaces secondary areas. Signal amber (#F5A623) marks data highlights and interactive accents. Clean-sheet white (#F7F7F2) provides text and breathing space. DM Sans handles body precision; Fraunces handles editorial headlines. The palette evokes a factory floor after hours: controlled, industrial, and hard to ignore.
Page sections overview
| Section | Purpose |
|---|---|
| Animated Data Header | Opens with CO₂ counter and Sankey diagram to anchor the data-first narrative |
| Baseline Audit Phase | Shows raw supply chain inputs against a structured audit output |
| Hotspot Mapping Phase | Visualizes where carbon emissions concentrate across the supply chain |
| Reduction Engineering Phase | Contrasts unstructured energy data with costed reduction pathways |
| Supplier Alignment Phase | Highlights the shift from fragmented supplier disclosures to verified data |
| Certification and Reporting Phase | Displays regulator-ready documentation as the methodology's final output |
| Evidence and Stats Block | Presents quantified outcomes with amber-highlighted metrics |
| Client Testimonials | Named VP-level quotes with specific reduction percentages and compliance results |
| Primary Lead Form | Captures baseline assessment requests with four qualifying fields |
| Scope 3 Checklist Download | Secondary email-gated conversion path for earlier-stage prospects |
| Linear Footer | Single-row footer with navigation and contact essentials |
Design & branding system
The template's visual identity is built on Corporate Precision: zero decoration, maximum data clarity. Every design decision reinforces the idea that this consultancy operates at the level of engineering rigor, not marketing polish.
- Color system: Deep graphite (#1E1E24) primary, signal amber (#F5A623) accent for data and interactivity, machined aluminum (#A8A9AD) for secondary surfaces, and clean-sheet white (#F7F7F2) for text. The palette communicates control and authority without relying on environmental green clichés.
- Typography: DM Sans for all body and data copy, chosen for precision and readability at small sizes. Fraunces for editorial headline moments, adding weight and editorial confidence where the narrative needs emphasis.
- Motion and interactivity: High animation fidelity throughout. The CO₂ counter animates on load. The Sankey diagram renders in real time. Zigzag sections scroll-reveal in sequence. Progress bars between chaos and clarity panels animate as the user scrolls, making the methodology feel alive rather than static.
Mobile & speed optimization
The template is specified as desktop-first, reflecting the reality that VP-level decision-makers reviewing detailed carbon methodology are typically on large screens at their desks. The design prioritizes information density and data clarity at full viewport widths.
- Desktop-first layout: The zigzag sections, Sankey diagram, and side-by-side chaos-to-clarity panels are designed for wide viewports where the full transformation is visible at a glance. Mobile layouts preserve section order and readability without sacrificing the core data narrative.
- Component-level rendering strategy: Static sections such as testimonials, evidence blocks, and form structure use server-side rendering. Interactive components including the animated counter, Sankey diagram, and scroll-reveal zigzag transitions use client-side rendering. This separation keeps the page focused and intentional in how it loads.
How this template helps you convert
This template earns the conversion by demonstrating competence before making any request. The page is structured so that a VP-level visitor encounters evidence, methodology, and quantified outcomes in that order, arriving at the lead form already convinced of the consultancy's rigor.
- Proof before ask: The animated header and five-phase methodology reveal show the consultancy's process in detail. By the time the visitor sees "Request Your Baseline Assessment," they have already watched disorder resolve into verified, regulator-ready reporting. The form feels like a logical next step rather than a cold ask.
- Dual-path capture: Not every visitor is ready to schedule a call. The gated Scope 3 readiness checklist captures earlier-stage buyers with a low-friction email-only download. Both paths feed the same pipeline, so no qualified lead is lost to hesitation.
- Qualifying form structure: The four-field baseline assessment form is not just a contact form. It collects production volume, primary reporting framework, and a self-described reporting gap. The consultancy enters every first conversation already knowing the prospect's scale, regulatory pressure, and immediate pain point.
Other information about this template
This template is built specifically for the intersection of automotive consulting and sustainability services, where the diligence process demands are high and the audience is deeply skeptical of generic claims. Understanding the broader reporting landscape helps contextualize what this template is designed to support.
- The automotive industry faces growing pressure to address greenhouse gas emissions across manufacturing and logistics operations. It is becoming a standard expectation for OEM suppliers to quantify, disclose, and reduce their greenhouse gas emissions with a long-term outlook toward carbon neutrality.
- The Greenhouse Gas Protocol provides the standard framework for calculating corporate greenhouse gas emissions. Scope 1, 2, and 3 emissions are critical components of this reporting structure. Quantifying Scope 3 impact is increasingly important for all segments of the supply chain to address climate change at scale.
- A Lifecycle Assessment (LCA) Dashboard visualizes the carbon footprint from raw material sourcing through manufacturing to end-of-life. A life cycle assessment of this kind is increasingly required by procurement teams at OEMs before awarding contracts to suppliers.
- Carbon footprint calculation software helps organizations measure their greenhouse gas emissions at a granular level. Real-time data integration involves API connections to IoT sensors or Enterprise Resource Planning (ERP) systems for automatic emissions data collection. The software can generate reports for Scope 1, 2, and 3 emissions in real time, and it can integrate with existing accounting systems to streamline data input. Many organizations are using carbon footprint calculation software to comply with regulatory requirements, and the software is designed to be user-friendly so that non-technical employees can input data easily.
- A Document Repository provides a secure, centralized space for auditing source data such as invoices and energy bills. The Due Diligence Reporting Template (DDRT) addresses challenges in supply chain transparency and compliance with regulations like the Uyghur Forced Labor Prevention Act (UFLPA). The DDRT standardizes submissions across OEMs to reduce manual effort and validate evidence, and it creates a defensible baseline for the diligence process by requiring direct supplier disclosures.
- Supply chain transparency is increasingly important for compliance with global regulations. Companies must provide detailed emissions data to demonstrate environmental responsibility and protect their reputations. Proactive reporting and reduction strategies can save energy, time, and money for companies throughout the supply chain.
- An interactive dashboard displaying Scope 1, 2, and 3 emissions data is referred to as a Carbon Transparency Module. Measurable Goals and Progress Reports show specific key performance indicators (KPIs) indicating progress toward sustainability targets. A driver-based forecasting approach can model different scenarios and policy impacts using different conversion factors to reach verified emission levels.
- Verified certifications and standards, such as ISO and B Corp badges, can validate environmental claims made by consultancies and their clients. The automotive industry is integrating carbon data into the International Material Data System (IMDS) via the eCARB initiative, which creates new data exchange requirements for suppliers operating globally across multiple countries.
- The U.S. Department of Energy offers tools and resources to support manufacturers in developing energy management programs and identifying energy efficiency opportunities. Companies throughout the supply chain can save energy, time, and money with proactive reporting and reduction strategies that go beyond compliance into meaningful action.
- Embedding sustainability into procurement, product development, and supplier assessment processes is no longer optional for companies operating globally. This template gives a consultancy the landing page infrastructure to support that business case with visible evidence, before a single sales call takes place.
- A Supply Chain Traceability Map allows users to track the origin of components with interactive elements, supporting the kind of verified documentation that multiple customers across an OEM's supplier network will need to produce as regulatory requirements tighten across countries worldwide.
- Deloitte has created a Carbon Forecasting Model using Anaplan to help measure future emissions. The Carbon Forecasting Model integrates with strategic workforce and financial planning models to facilitate cohesive decision-making at board level.
Theme
Corporate Precision
Creative direction
Transparent Process
Color system
Charcoal & Amber
Style
Zigzag/Alternating
Direction
Lead Generation
Page Sections
Animated Co₂ Counter and Sankey Diagram Header
Five-phase Zigzag Methodology Sections
Qualifying Baseline Assessment Lead Form
Gated Scope 3 Readiness Checklist Module
Quantified Outcomes and Named Testimonial Blocks
Corporate Precision Charcoal and Amber Design System
Related questions
Who is the primary audience for this landing page template?
Can I customize the five methodology phases with my own process names?
How does the lead form help qualify prospects before the first call?
Is the Scope 3 checklist download built into the template?
Is this template suitable for consultancies working across multiple reporting frameworks?