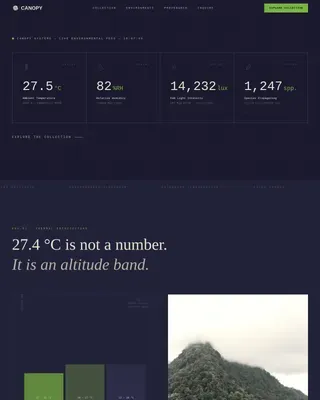
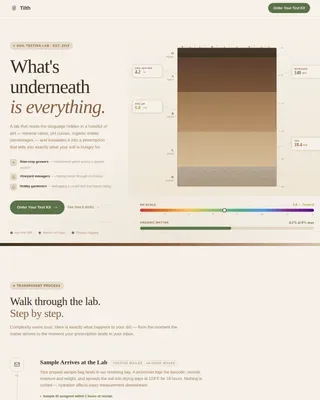
Specialist Climate & Environmental Monitoring Privacy Policy & Terms Website Template
Greenhouse is a precision greenhouse gas monitoring landing page template built for environmental compliance professionals. It features a zigzag alternating layout, an Engineering Blueprint visual style, and a Rainforest color system. The page walks visitors from emission source to regulatory consequence, earns trust with three ungated data visualizations, then converts with a gated Monitoring Playbook download.
by Rocket studio
Quick summary
Greenhouse is a single-page template designed for industrial greenhouse gas monitoring platforms. It uses a zigzag alternating layout to guide compliance officers through a cause-and-effect narrative, from raw sensor readings to regulatory filing. Three ungated data visualizations build trust before the gated download form asks for anything in return.
Who this template is for
This template is built for B2B environmental technology platforms that need to convert serious compliance professionals, not casual browsers. The layout, language, and conversion flow are all calibrated for high-stakes, deadline-driven buyers.
- Environmental compliance officers at cement plants and industrial facilities filing quarterly EPA reports
- Sustainability directors at large corporations building Scope 1 greenhouse gas inventories
- Municipal climate analysts tracking methane plumes across landfill and infrastructure networks
What problem this template solves
Compliance professionals distrust generic marketing pages. They need to see real data, understand the regulatory stakes, and feel confident before downloading anything or sharing a work email. Most landing pages fail this audience by leading with features instead of evidence.
- Visitors arrive skeptical and leave before a call to action because the page offers no proof upfront
- Compliance buyers need to see regulatory context (EPA deadlines, Scope 1 frameworks) before they engage
- Generic layouts do not convey the rugged, calibrated credibility that industrial audiences expect
What you get with this template
You get a fully structured, single-page layout with every section pre-built and ready to populate with your platform's data and messaging. The page is designed to earn trust before asking for it, using a deliberate content sequence that mirrors how compliance buyers actually evaluate tools.
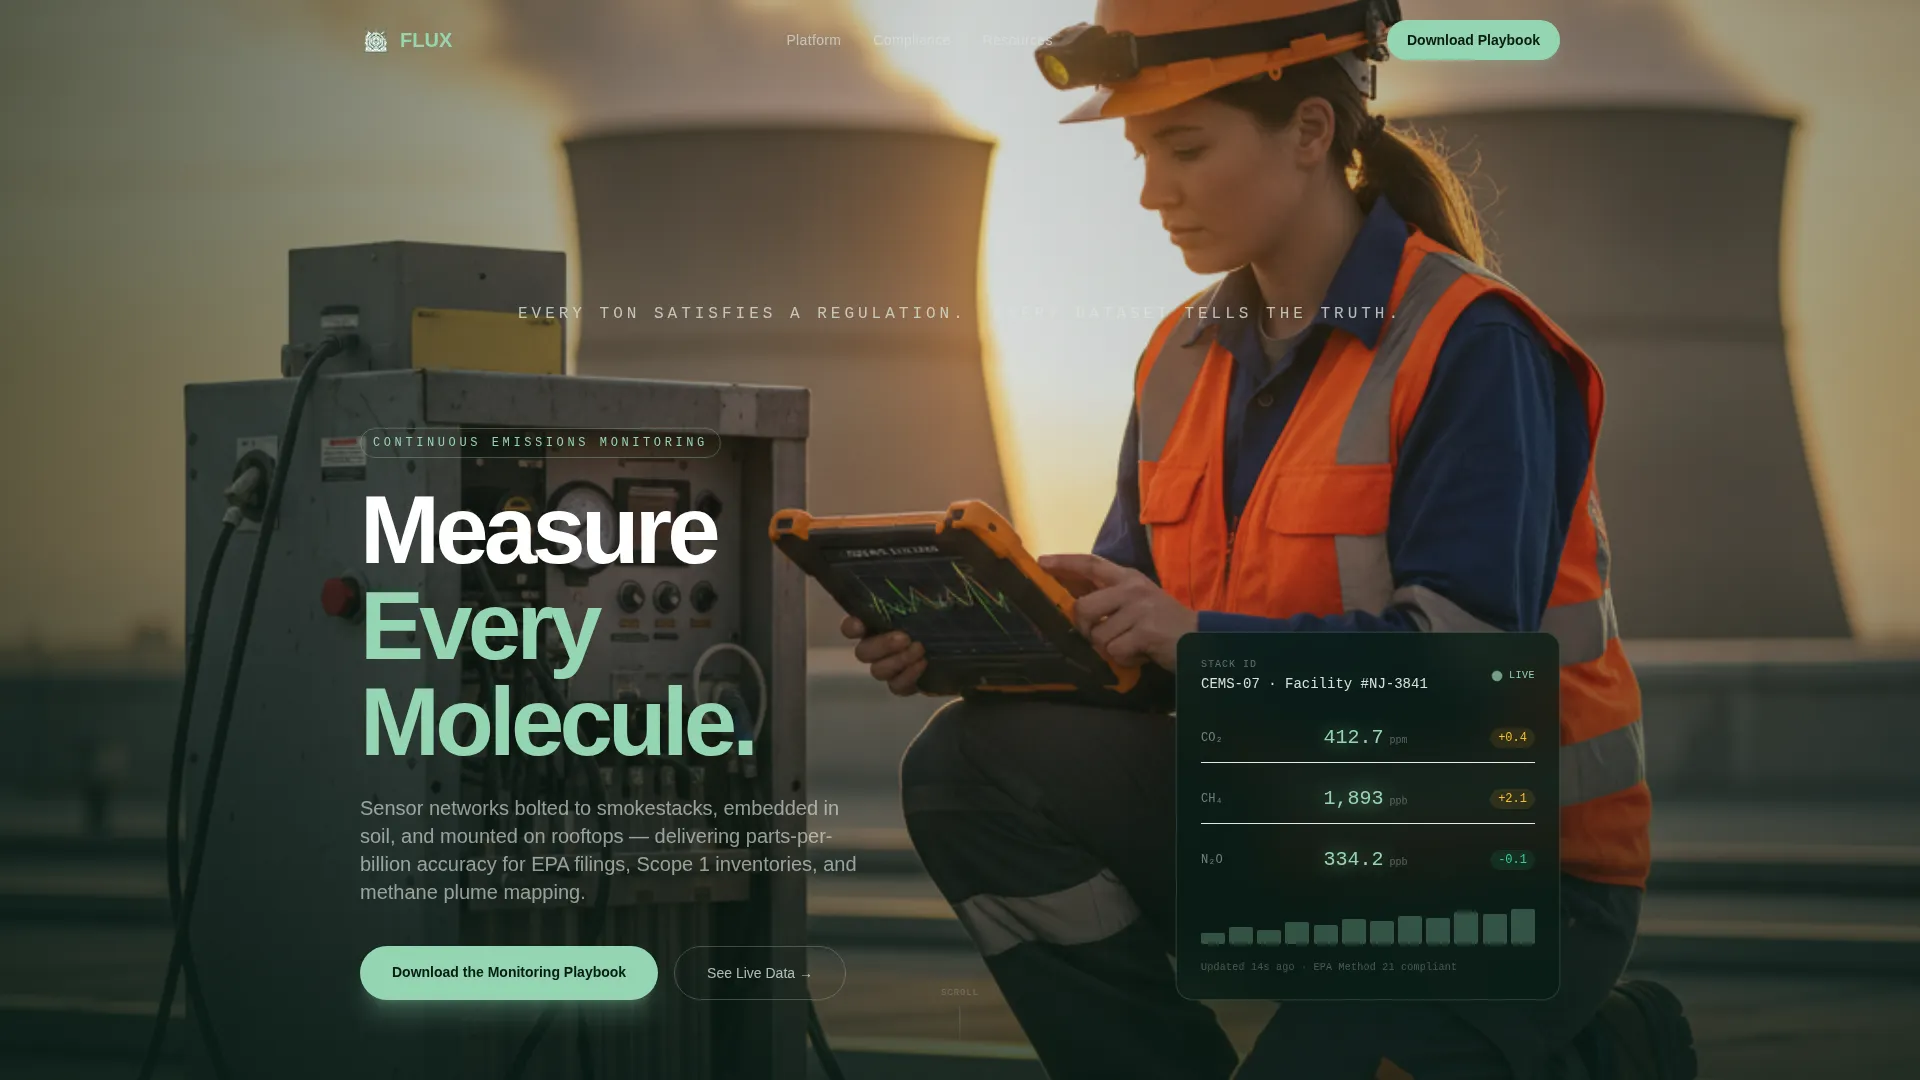
- A hero section with a lifestyle shot composition, a tagline fade-in, and a floating live data card showing carbon dioxide and methane concentration curves
- Six structured content sections including a scroll-reveal molecule journey, three zigzag cause-and-effect blocks, and a resource hub with secondary calls to action
- A two-field gated form (work email and facility type dropdown) connected to the Monitoring Playbook download, plus three ungated data visualizations placed before the gate
Feature list
This template includes a focused set of purpose-built components. Each one serves the cause-and-effect narrative and the compliance-oriented conversion goal.
Zigzag Cause-and-Effect Layout
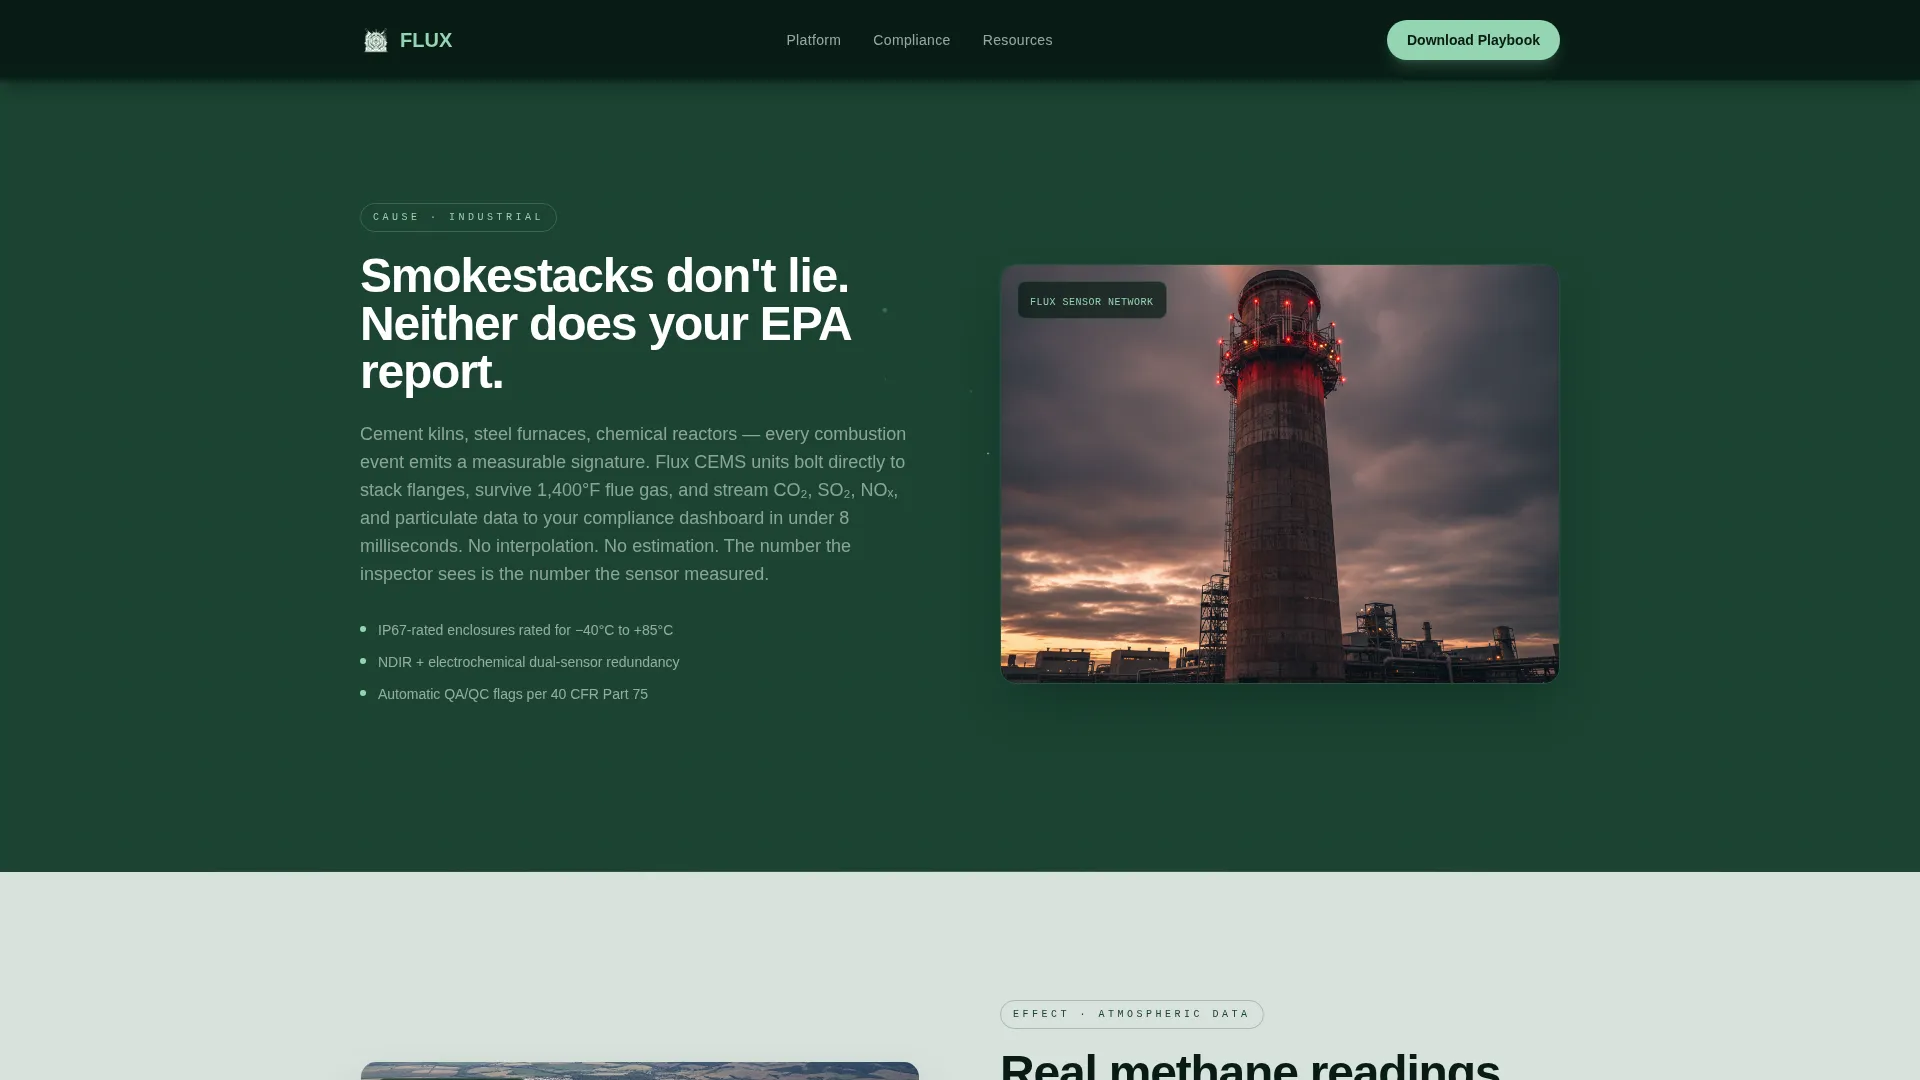
Each section pair alternates between an industrial emission source and its measurable atmospheric consequence. Animated particle trails connect the two sides across the gutter, reinforcing the platform's core narrative of emission to data to regulatory outcome.
Three Ungated Data Visualizations
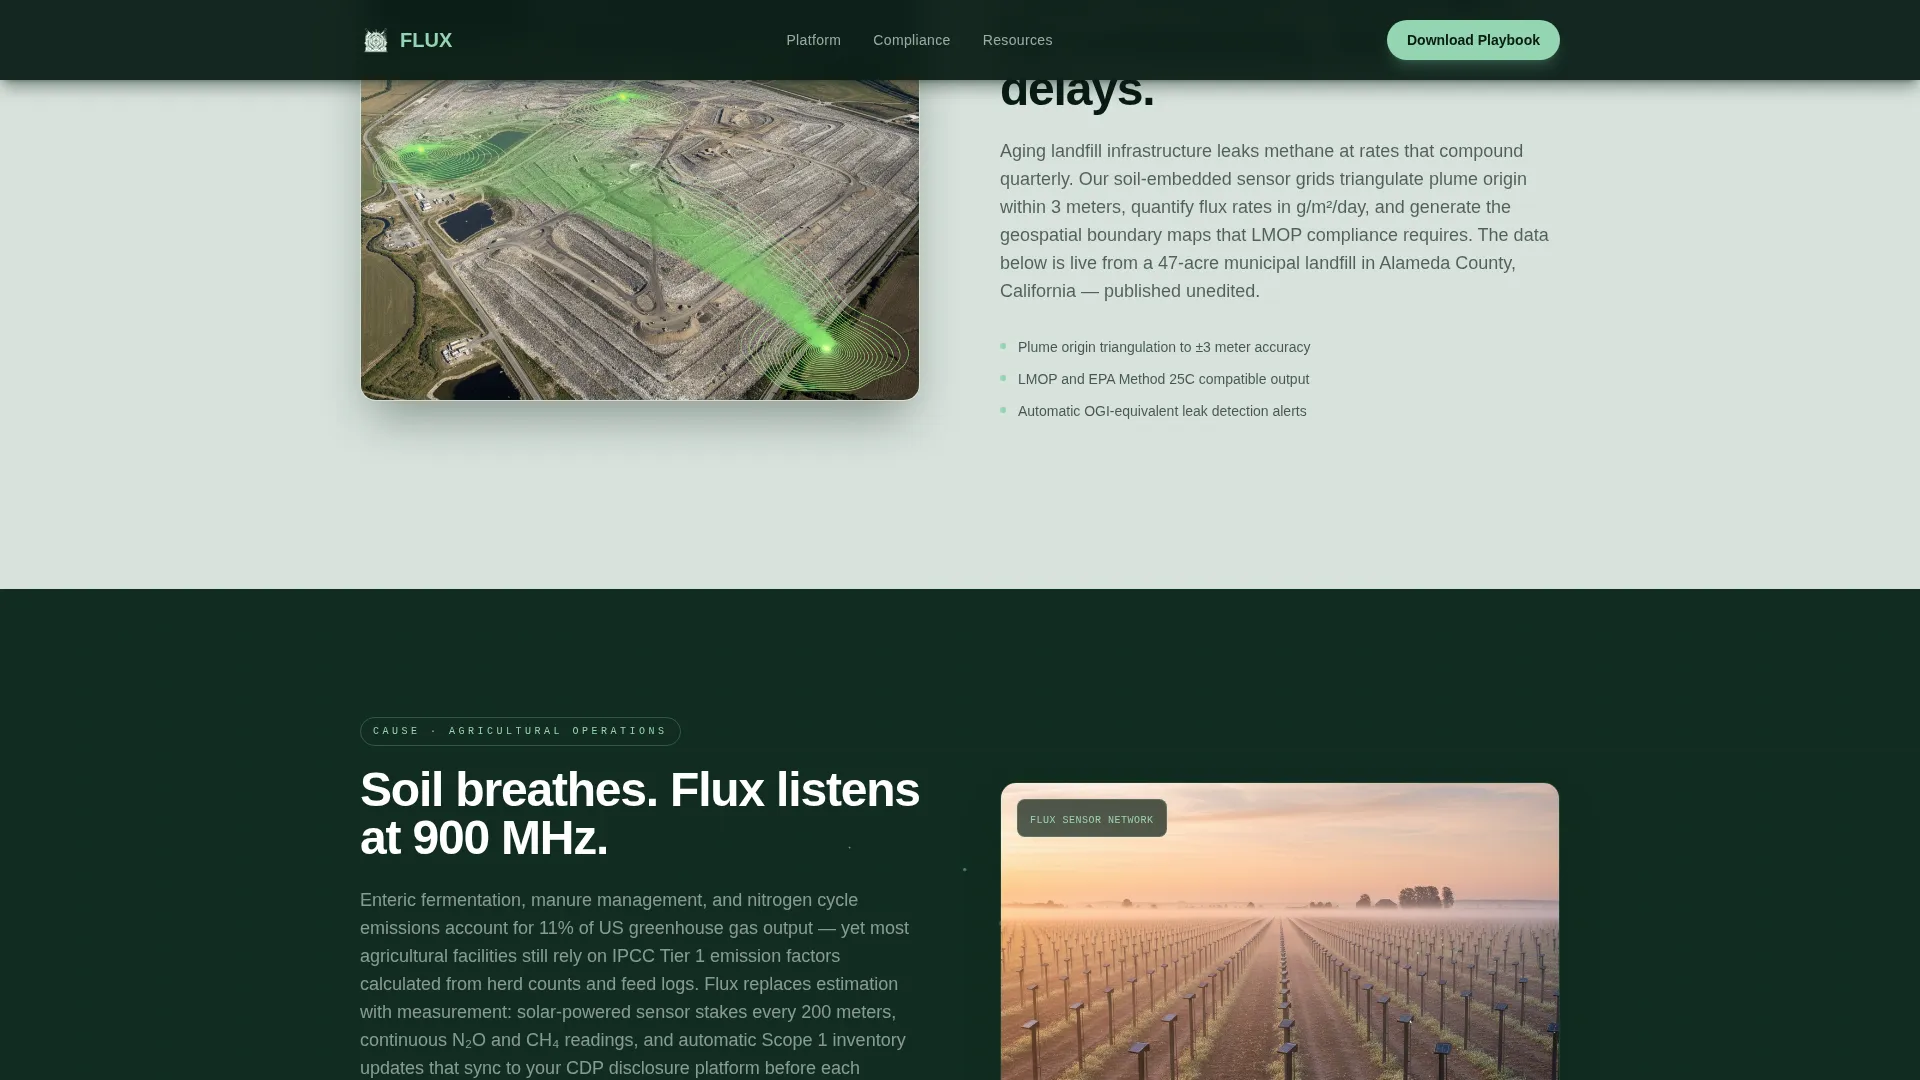
Real methane readings, a regulatory timeline, and a cost-of-noncompliance calculator appear before the gated download form. Visitors engage with live, credible data before surrendering their email, which meaningfully increases form conversion for this skeptical audience.
Gated Monitoring Playbook Form
A clean two-field form captures work email and facility type via a dropdown (industrial, municipal, agricultural, commercial). The gate appears only after the three ungated visualizations have already established the platform's data credibility.
Scroll-Reveal Molecule Journey
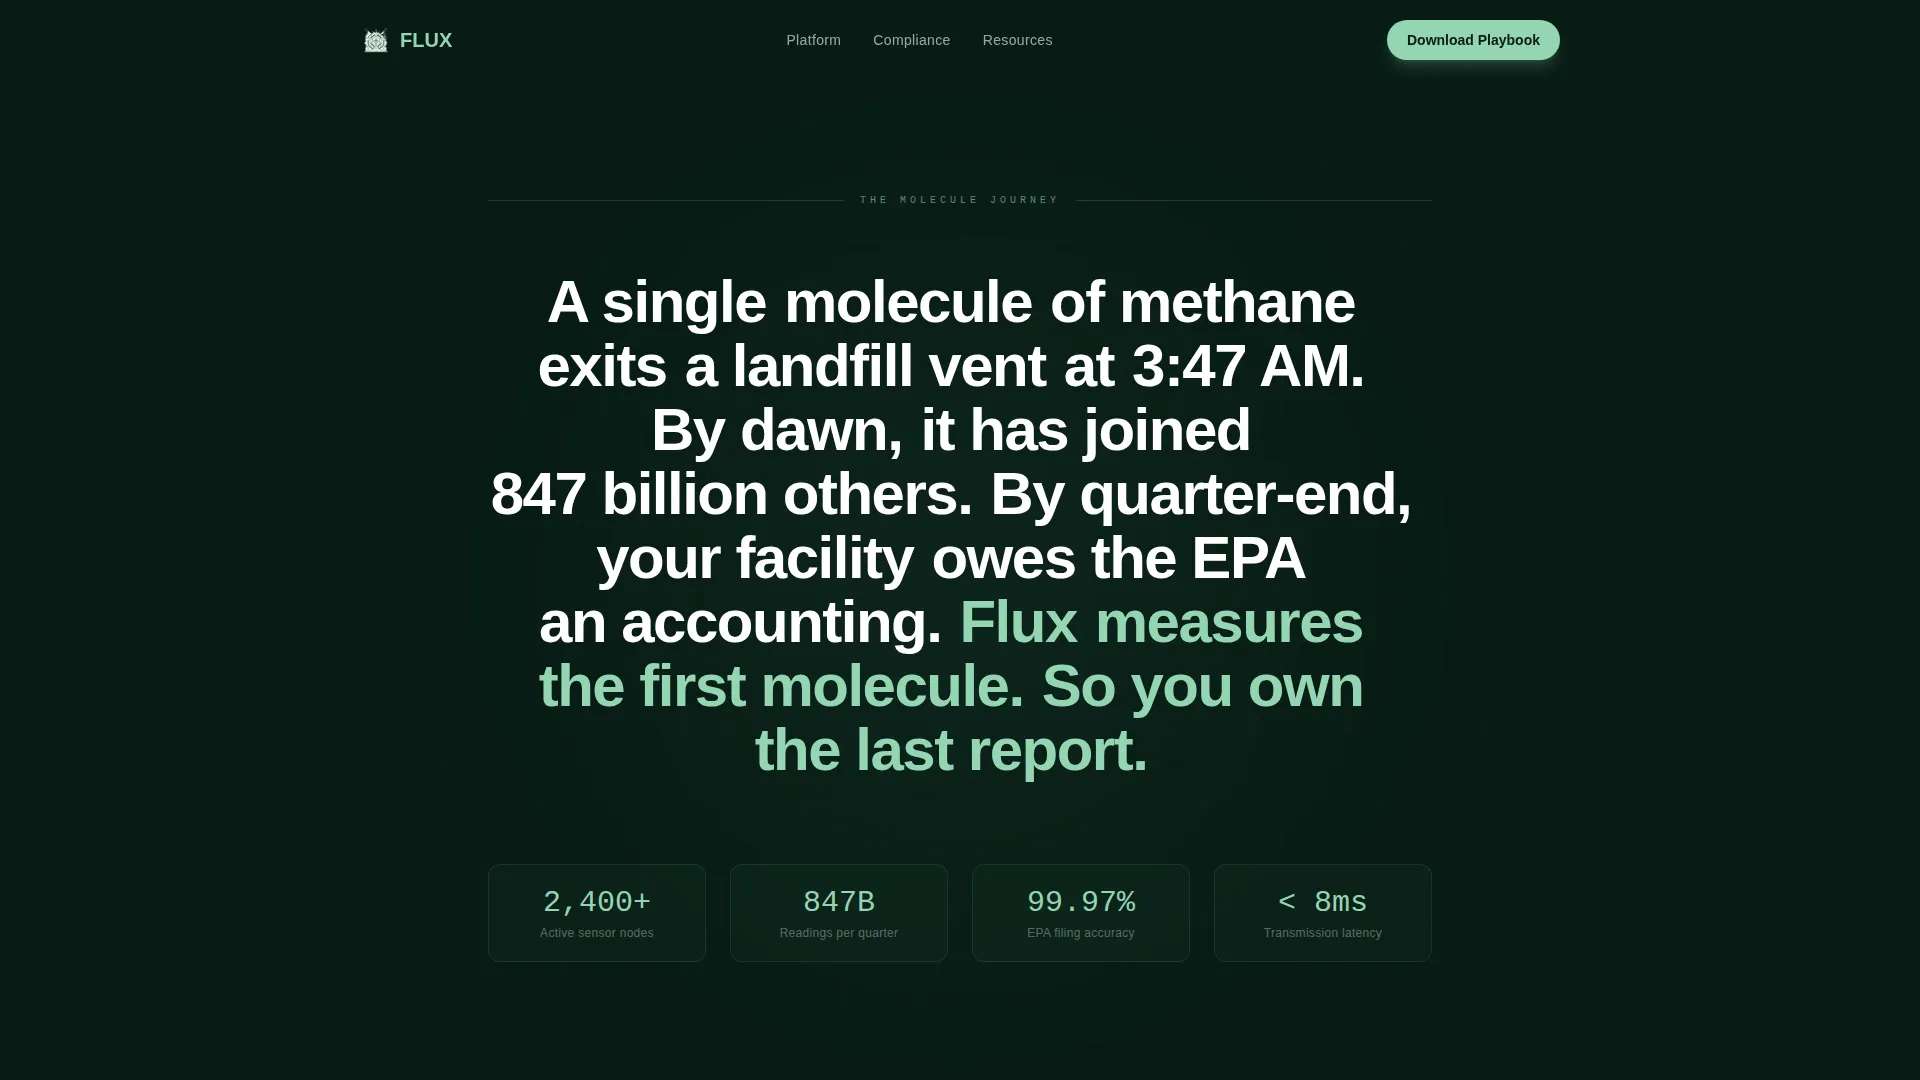
Animated narrative text traces the physical path of a greenhouse gas molecule from emission source through atmospheric measurement to regulatory consequence. The scroll-triggered reveal paces the escalating story across the page.
Resource Hub with Secondary calls to action
Below the fold, three secondary calls to action link to an EPA Method 21 compliance checklist, a Scope 1 calculation template, and a live webinar on continuous versus periodic monitoring. These resources extend engagement for visitors not yet ready to download.
Engineering Blueprint Typography System
Body copy uses DM Sans for readability. Data readings, sensor values, and chart labels use JetBrains Mono to signal precision and technical credibility. Every data point on the page feels like a real instrument readout, not a marketing graphic.
Page sections overview
| Section | Purpose |
|---|---|
| Hero Lifestyle Shot | Establishes human-scale credibility with a field engineer image, live CO₂ and CH₄ data card, and tagline fade-in |
| Molecule Journey Scroll | Animates the narrative arc from emission source to atmospheric measurement to regulatory consequence |
| Zigzag Section A | Presents industrial emission sources (cement, agriculture, transport) with particle animation |
| Zigzag Section B | Shows real methane readings visualization and a regulatory timeline as ungated data visualizations |
| Zigzag Section C | Delivers the cost-of-noncompliance calculator and the gated Monitoring Playbook download form |
| Resource Hub | Links to the EPA Method 21 checklist, Scope 1 template, and live webinar as secondary calls to action |
| Footer Arc Split | Displays logo and tagline on the left, navigation links on the right |
Design & branding system
The visual identity follows an Engineering Blueprint theme. The page feels rugged, calibrated, and data-dense, with zero decorative elements. Every color and type choice reinforces the sense that this is a precision instrument, not a marketing brochure.
- Rainforest color system: deep canopy green (#1B4332) and humid moss (#40916C) for primary backgrounds, atmospheric haze gray (#D8E2DC) for alternating sections, living chlorophyll (#95D5B2) for chart axes, progress bars, and interactive hover states, and near-black (#081C15) for body text
- Typography pairing of DM Sans for readable body copy and JetBrains Mono for sensor data and readings, keeping the engineering aesthetic consistent across every data display
Mobile & speed optimization
The template is designed desktop-first to match the primary audience of compliance officers working on workstations. Mobile-responsive fallback layouts are included so the page remains functional and legible on smaller screens.
- Desktop-first layout prioritizes data-dense compliance dashboards and wide-format zigzag sections
- Mobile-responsive fallback stacks zigzag pairs vertically and preserves the data visualization hierarchy on smaller viewports
How this template helps you convert
The conversion strategy is built on a trust-first sequence. Visitors receive value before they are ever asked for anything, which lowers resistance for a skeptical, professional audience.
- Three ungated data visualizations (real methane readings, a regulatory timeline, and a cost-of-noncompliance calculator) are placed early in the scroll, so visitors already trust the data before they reach the gated form
- The two-field Monitoring Playbook form reduces friction by asking only for work email and facility type, making it easy for compliance officers to qualify themselves and receive a relevant resource
- The resource hub secondary calls to action (EPA Method 21 checklist, Scope 1 template, live webinar) re-engage visitors who are not yet ready to convert, keeping them in the funnel without requiring a hard close
Other information about this template
This template is designed specifically for the greenhouse gas monitoring niche within climate and environmental monitoring. It aligns with the Agriculture and Environment category and is built to serve platforms operating within the US regulatory framework, using EPA standards, USD pricing, and MM/DD/YYYY date formatting.
- Localization defaults: English language, US regulatory context (EPA), USD, and MM/DD/YYYY date format
- Social proof elements are included as structural placeholders for real sensor reading numbers, regulatory timeline data, and facility count metrics
- Animation intensity is high by design: scroll-reveal words, particle trails, parallax effects, intersection observers, and count-up numbers are all specified in the template structure
- The footer follows an Arc Browser Split pattern with logo and tagline on the left and navigation links on the right
- The header composition is intentionally low-angle and hero-framed left-of-center, with sky occupying the top third to convey human-scale work against planet-scale stakes
Theme
Engineering Blueprint
Creative direction
Movement & Cause
Color system
Rainforest
Style
Zigzag/Alternating
Direction
Content/Resource
Page Sections
Zigzag Cause-and-effect Layout
Three Ungated Data Visualizations
Gated Monitoring Playbook Form
Scroll-reveal Molecule Journey
Resource Hub with Secondary Ctas
Engineering Blueprint Typography System
Related questions
Who is this landing page template designed for?
What does the gated download form collect?
What are the three ungated data visualizations included in the template?
Can I adapt this template for a single emission source or industry vertical?
Does this template follow a specific regulatory framework?