Solar & Wind Energy Cost Calculator Website Template
Harvest is a gallery-and-detail landing page template built for commercial solar installers. It opens with a live metrics dashboard, then walks visitors through a full project lifecycle across four seasonal sections. Real project data, a three-step inline assessment form, and a downloadable payback calculator give facilities managers and CFOs everything they need to say yes.
by Rocket studio
Quick summary
Harvest is a direct-sales landing page for commercial rooftop solar installers. It leads with four animated performance counters, moves through a seasonal visual narrative from survey to harvest, and closes every section with a clear call to action. The template is built to earn trust before it ever asks for a name.
Who this template is for
This template is made for commercial solar installation businesses that sell to property-owning organizations rather than individual homeowners. The content structure and form flow are matched to longer B2B (business-to-business) decision cycles.
- Facilities managers tracking large monthly utility bills and looking to reduce operational costs
- Chief financial officers evaluating capital assets, depreciation vehicles, and measurable return on investment
- Commercial property owners who want to attract and keep tenants by lowering building operating costs
What problem this template solves
Most commercial solar websites lead with technology specs. Harvest flips that order. It shows real dollar amounts and real project outcomes before asking a visitor for any information. By the time a call to action appears for the third time, a prospect has already done the math in their head.
- Visitors leave without converting because they never see proof that the numbers work for a building like theirs
- The decision timeline stalls because buyers have to request a quote just to get basic payback data
- Generic hero images and vague claims fail to build the credibility that B2B buyers require before they engage
What you get with this template
You get a fully structured, single-page layout that guides a commercial buyer from first impression to form submission. Every section is purposeful, and every call to action is earned by the content that precedes it.
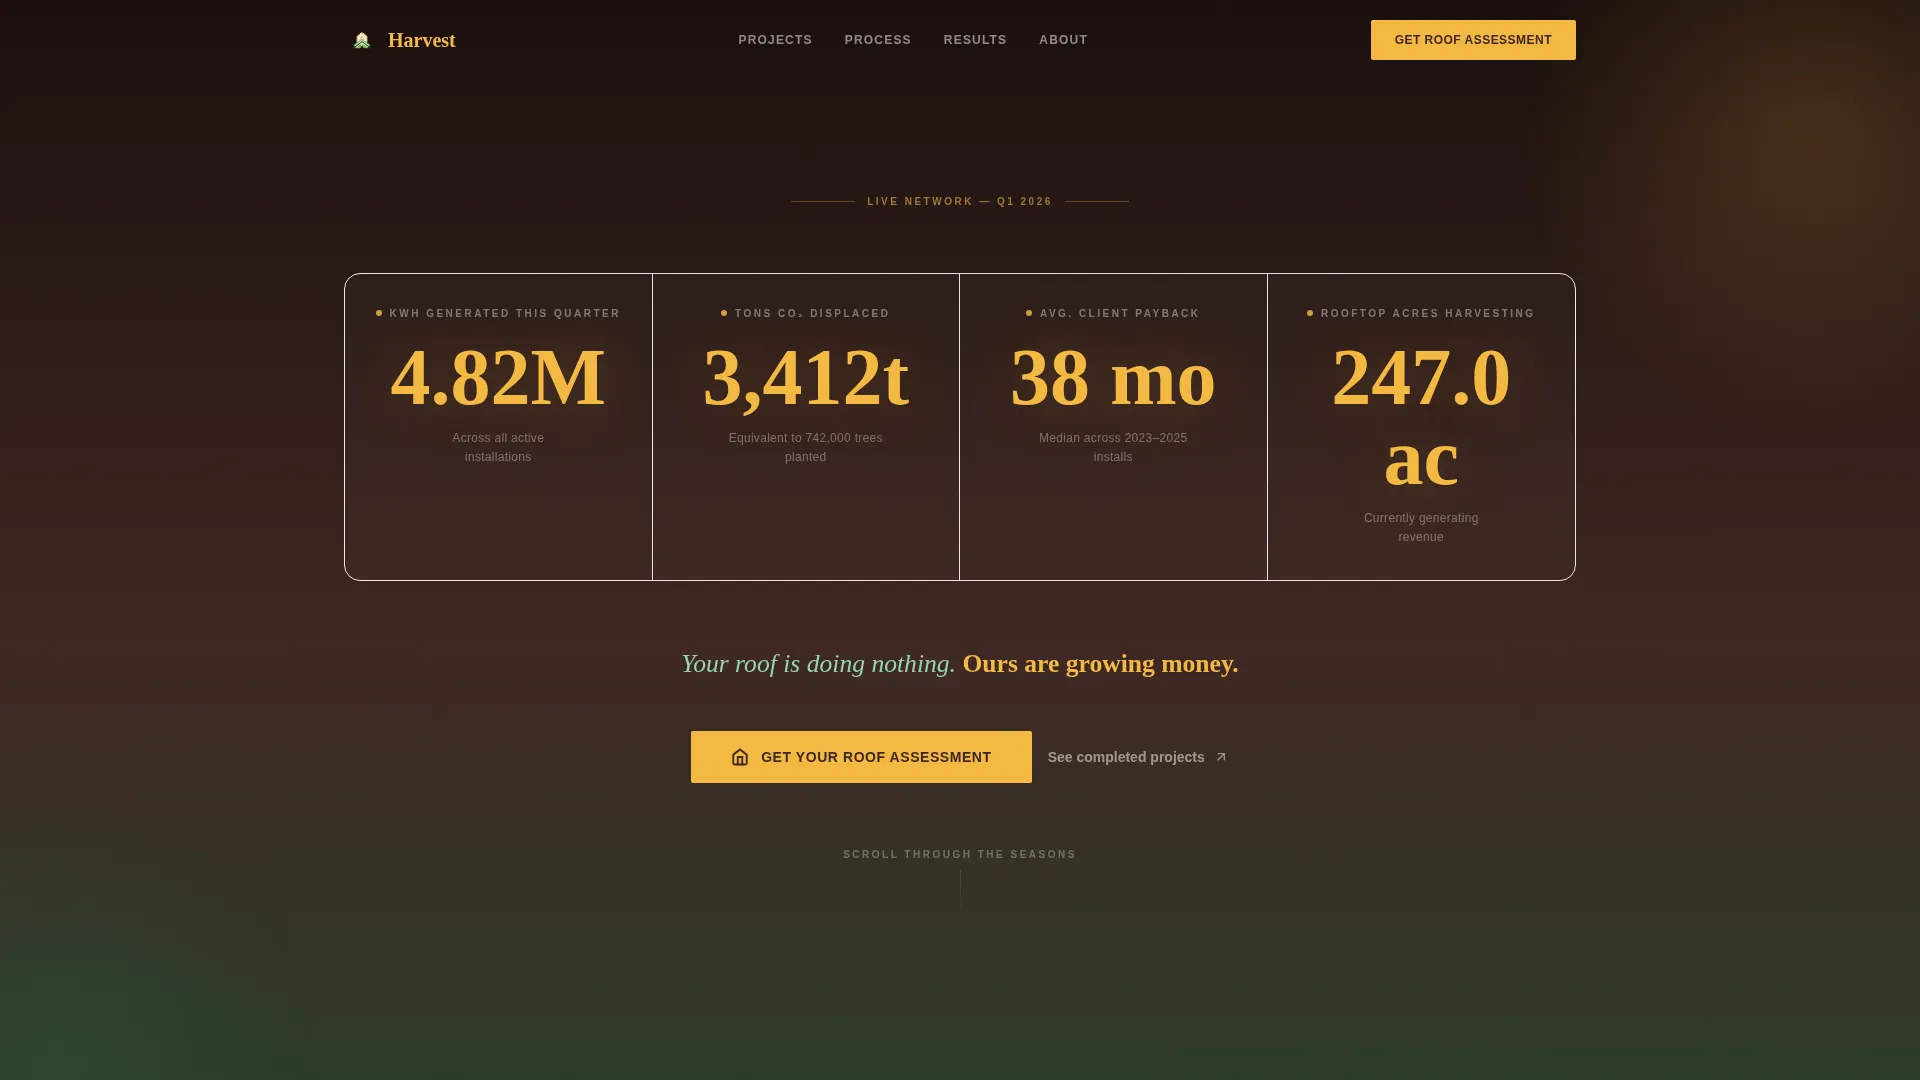
- A living metrics dashboard header with four animated counters displaying real production and financial data
- Four seasonal content sections covering the complete project journey, from site survey to harvest data
- A three-step inline assessment form and a gated payback calculator download as dual conversion paths
Feature list
This section details the core interactive and structural capabilities built into the Harvest template.
Animated Metrics Dashboard Header
Four large counters sit on a soil-dark background and tick upward on page load. They display kilowatt-hours generated this quarter, tons of carbon dioxide displaced, average client payback period in months, and total rooftop acres currently harvesting. The numbers are styled in photon gold to signal live, financial-grade data.
Click-to-Bloom Gallery Panels
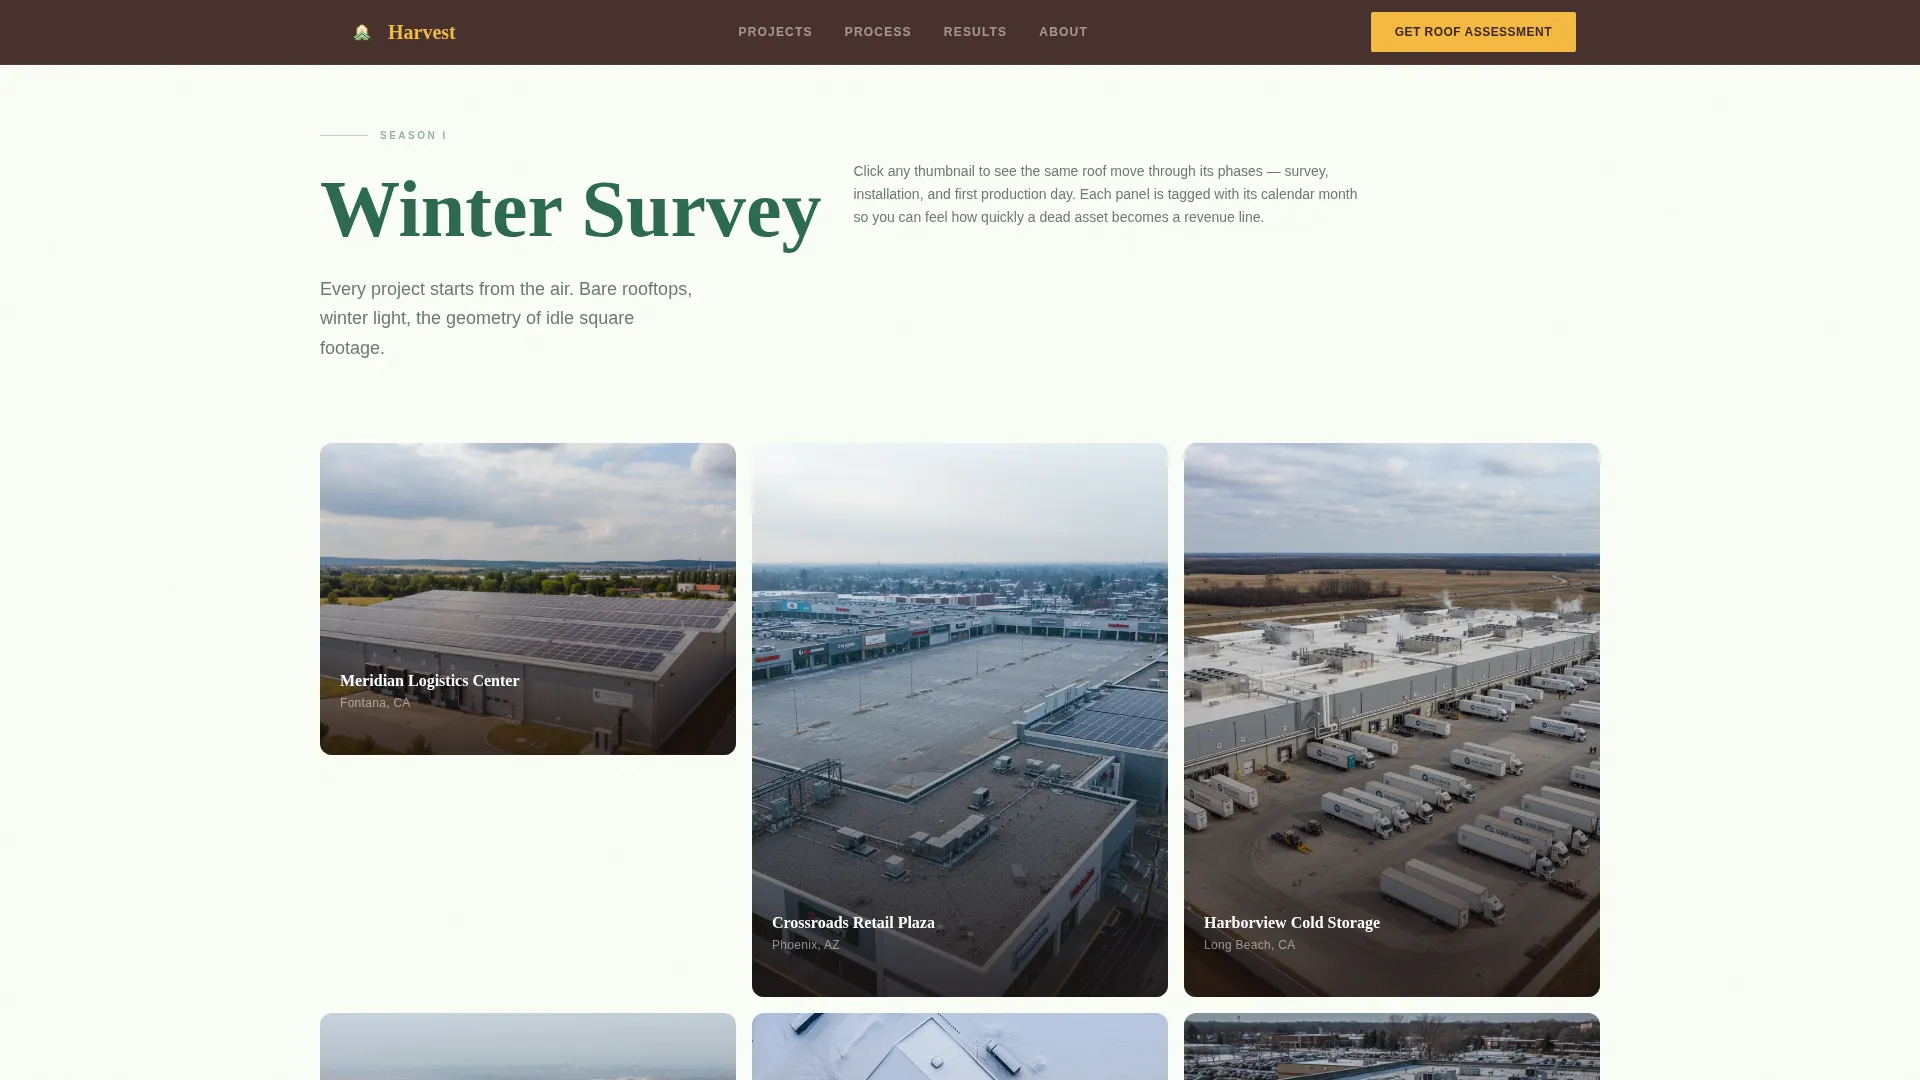
The Winter section presents drone survey photos in a tight grid. Clicking any thumbnail expands it into a detail panel that shows the same roof at three project stages: mid-install, and fully operational. Each stage is tagged with its calendar month, giving buyers a realistic timeline at a glance.
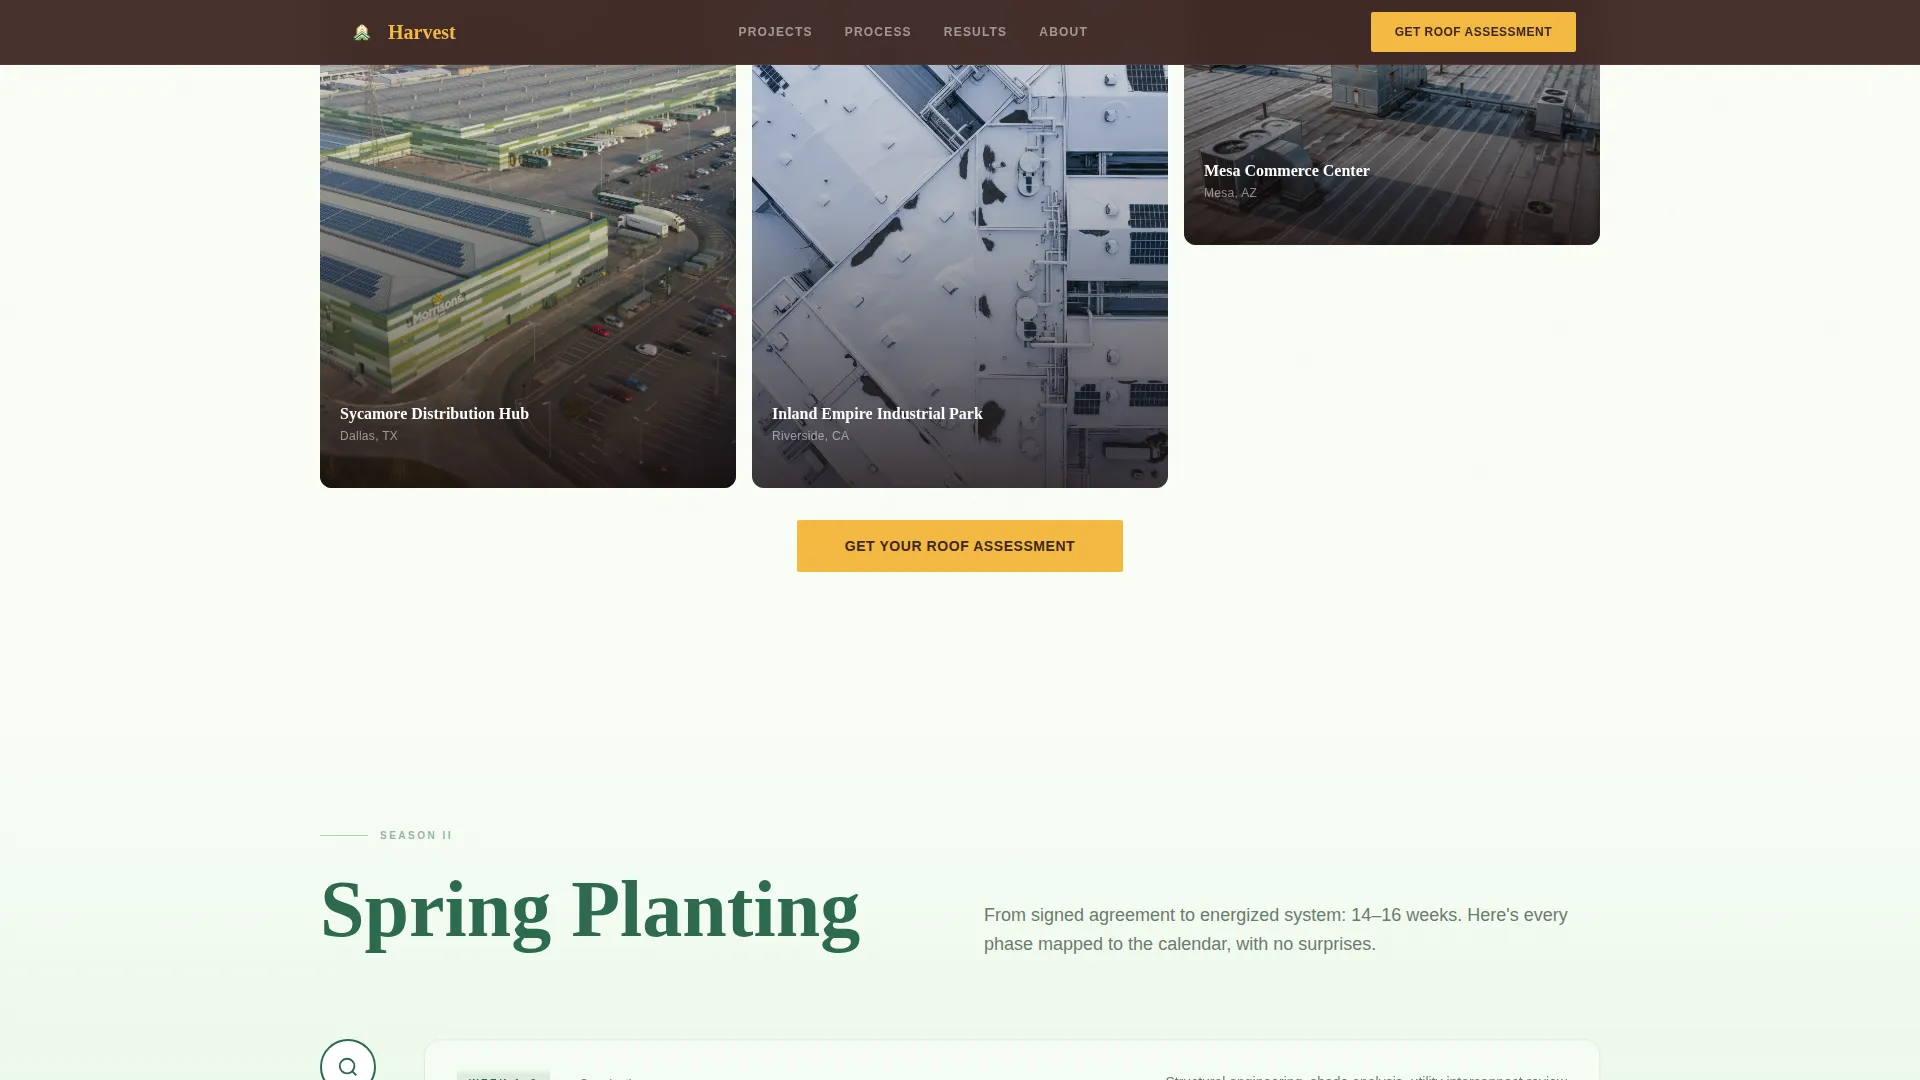
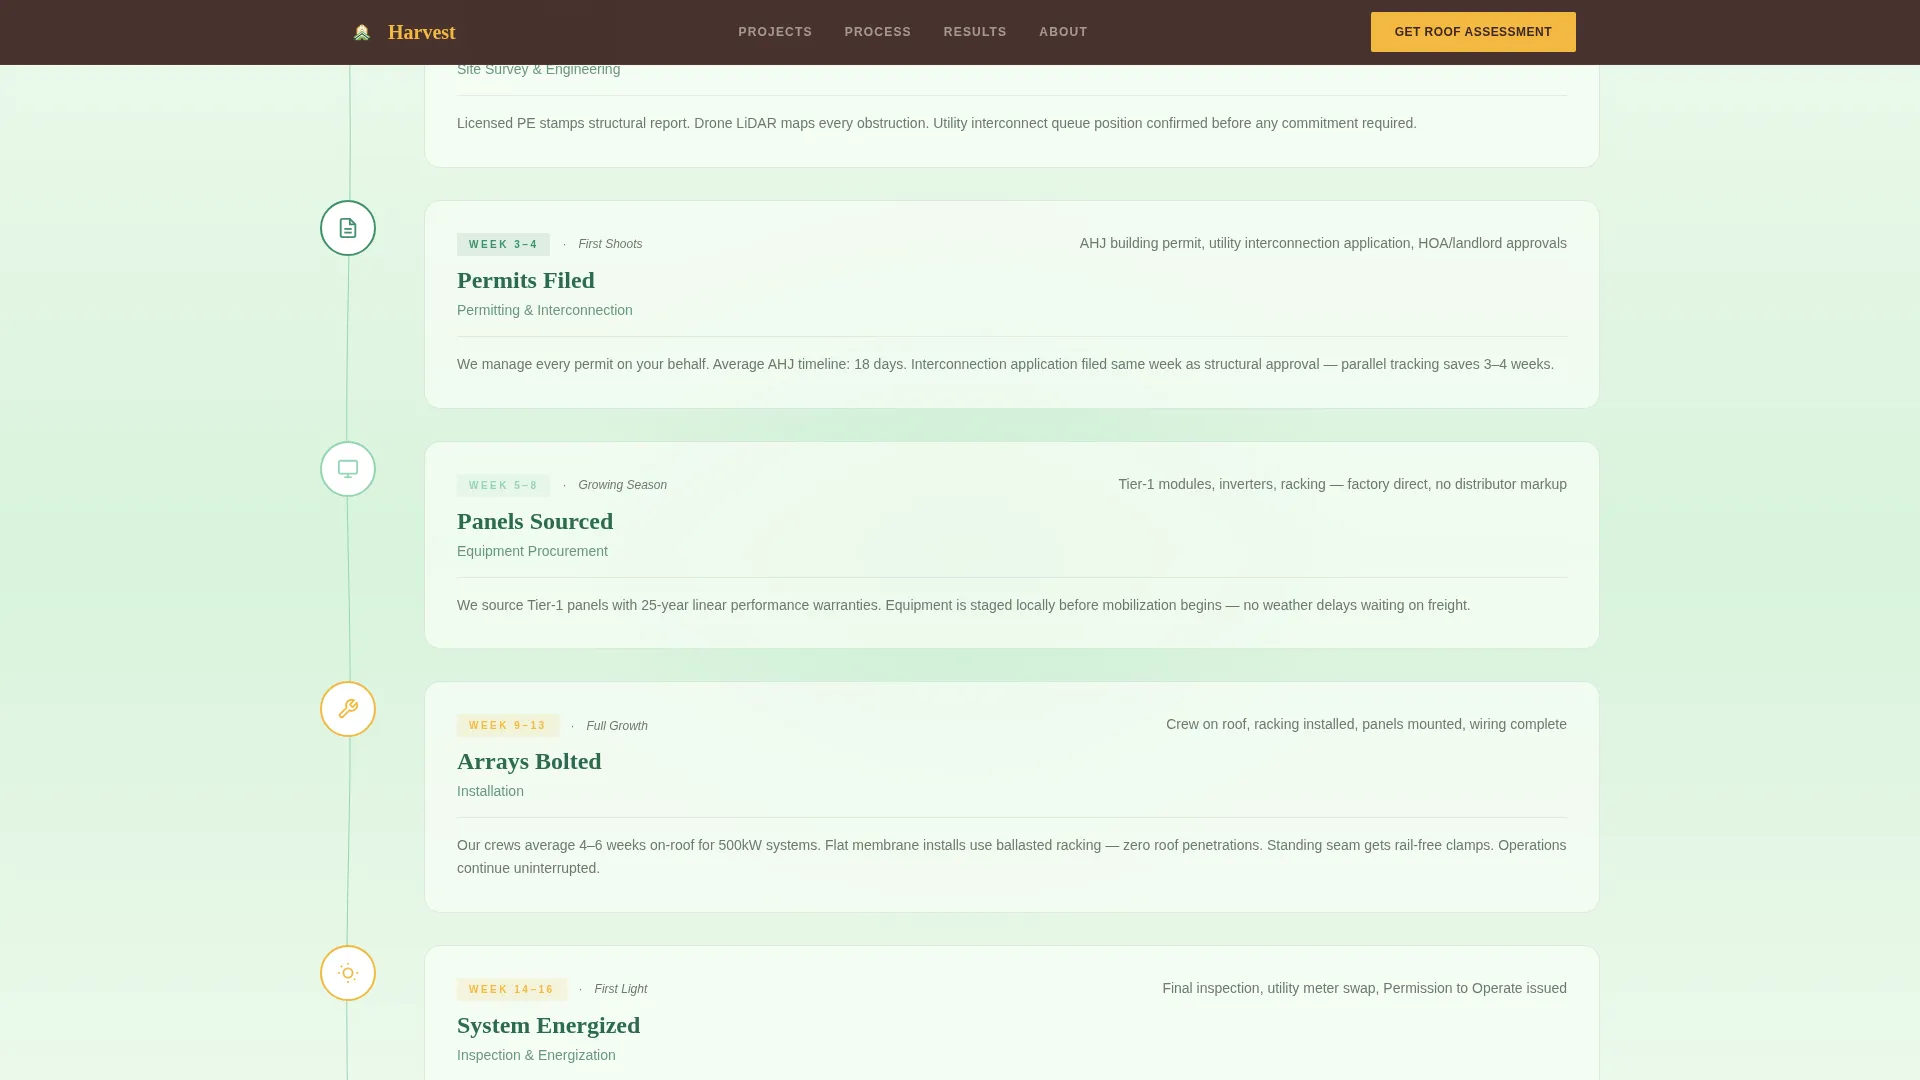
Seasonal Project Journey Layout
The page scrolls through four named seasons. Winter covers site surveys, spring covers permits and engineering timelines, summer showcases completed arrays at golden hour, and autumn presents ROI charts and utility credit invoices. The structure mirrors how a real installation unfolds over a year.
Three-Step Inline Assessment Form
The primary call to action opens a compact inline form without a page redirect. Step one collects a utility bill upload or monthly spend estimate. Step two captures the building address or a map pin drop. Step three presents a visual roof-type picker with flat membrane, standing seam, and ballasted options.
Gated Payback Calculator Download
A secondary conversion path offers a downloadable payback calculator in exchange for an email address only. This path is designed for prospects who are still researching and not yet ready to speak with a sales team. It keeps warm leads in the funnel without forcing a premature conversation.
Botanical Color and Animation System
Vine-grow SVG (scalable vector graphic) path animations, staggered gallery reveals, and hover bloom effects bring the Garden and Growth visual identity to life. Photon gold pulses on every data point and call-to-action element, creating a clear visual language that connects energy generation with financial return.
Page sections overview
| Section | Purpose |
|---|---|
| Living Metrics Dashboard | Opens with animated counters showing energy, carbon, payback, and acreage data |
| Winter Survey Gallery | Drone-altitude grid of bare rooftops with click-to-expand phase detail panels |
| Spring Process Calendar | Planting-calendar layout of permits, engineering drawings, and interconnection timelines |
| Summer Array Gallery | Golden-hour photography of completed commercial arrays at peak production |
| Autumn Harvest Data | ROI charts, utility credit invoices, and payback figures with assessment call to action |
| Inline Assessment Form | Three-step form collecting spend, address, and roof type to generate a lead |
| Single-Row Footer | Linear footer row with essential links and secondary contact options |
Design & branding system
The visual identity uses a Botanical color system built around the warmth of a greenhouse in late April. Fraunces serif headlines add weight and seasonal character, while DM Sans keeps body copy clean and readable at any size.
- Core palette: chlorophyll deep green (#2D6A4F) for headers, photon gold (#F4B942) for calls to action and data, rich soil brown (#3E2723) for dark section backgrounds, and sunlit leaf green (#95D5B2) for accents
- Backgrounds alternate between soil brown and crisp off-white (#FAFDF6) so each seasonal section feels visually distinct without breaking the overall palette
- Animation is set to high intensity: counter tick-up on load, staggered gallery reveals, vine-grow SVG path animations, and hover bloom effects on interactive elements
Mobile & speed optimization
The template is built desktop-first to match the primary audience of facilities managers reviewing utility data at a workstation. A strong mobile fallback ensures the experience holds up on any device.
- Static page sections use server-rendered components to reduce initial load overhead on content-heavy seasonal blocks
- Interactive components including the animated counters and the three-step inline form run as client-side components, keeping heavy scripts isolated from the static layout
- The gallery grid and detail panels reflow cleanly on smaller screens so drone photography and project data remain legible on mobile
How this template helps you convert
Harvest is structured around a single conversion principle: show the proof first, then ask for the action. Every call to action is placed after a content section that has already answered the buyer's primary objection.
- The metrics dashboard opens with real production and savings data before any product claim is made, establishing credibility in the first scroll position and priming the visitor to engage with the assessment call to action below it.
- The autumn harvest section presents actual utility credit invoices and ROI charts, so by the time the inline three-step form appears, the visitor has seen enough real numbers to feel confident entering their own building's data.
Other information about this template
Harvest was designed for English-language, United States markets with USD pricing and US date formatting built into the layout. The template suits commercial solar installers working on warehouse roofs, retail plazas, and distribution centers.
- The social proof strategy relies on real project photography, actual utility credit amounts, named client facilities, and per-building production data rather than testimonial quotes
- The page type is a single-page gallery-and-detail landing page, not a multi-page website, so all content and conversion paths live within one continuous scroll
- The template sits within the Agriculture and Environment category, Solar and Wind Energy subcategory, and is purpose-built for the commercial solar installer niche
Theme
Garden & Growth
Creative direction
Seasonal/Moment
Color system
Botanical
Style
Gallery + Detail
Direction
Direct Sales
Page Sections
Animated Metrics Dashboard Header
Click-to-bloom Gallery Panels
Four-season Project Journey
Three-step Inline Assessment Form
Gated Payback Calculator Download
Botanical Animation and Visual System
Related questions
Who is this template designed for?
Can I show my own project photos and real client data?
How does the three-step inline assessment form work?
What is the payback calculator download used for?
Is this a single page or a multi-page website?


