Predictive Crop Intelligence Landing Page Template
Forecast is a hero-dominant landing page template built for yield prediction AI platforms. It uses an Engineering Blueprint visual theme to walk agribusiness professionals through a machine learning pipeline, from soil and satellite data ingestion to field-level crop yield output maps. The layout earns trust through data-driven visuals before asking visitors to act.
by Rocket studio
Quick summary
Forecast is a single-page, hero-dominant landing page template designed for AI-powered crop yield prediction platforms. It guides agribusiness operations managers, precision agriculture consultants, and commodity traders from raw data inputs to confident yield forecasting outputs, all within a scroll experience that feels like unrolling a technical blueprint at dawn.
Who this template is for
This template is built for teams selling or presenting machine learning-powered yield prediction tools to serious agricultural professionals. It speaks directly to people who work with large-scale field data every day.
- Agribusiness operations managers overseeing ten thousand or more hectares of grain or soybean rotation
- Precision agriculture consultants advising cooperatives on input allocation and crop management
- Commodity traders hedging positions against regional crop production variance
What problem this template solves
Traditional landing pages for agricultural technology often bury the product logic under generic claims. Buyers in agribusiness need to see the machinery before they trust the outcome. They want to understand how a model works, not just what it promises.
- Most yield forecasting pages fail to show the data pipeline, leaving farm managers skeptical of accuracy claims
- Generic layouts do not reflect the technical depth that operations-scale buyers expect from a crop yield prediction tool
- Weak calls to action miss the moment when a buyer is ready to run a sample forecast on their own fields
What you get with this template
This template gives you a complete, production-ready landing page structure. Every section is designed to carry a specific part of the yield prediction story, from raw data ingestion to confident field-level output.
- A full five-section hero-dominant layout with a persistent call-to-action bar that activates mid-scroll
- An Engineering Blueprint visual system using parchment, sandstone, earth umber, and stake orange across all components
- Scroll-linked section reveals, parallax hero layers, and blueprint line-draw animations throughout the page
Feature list
This template is built around six core capabilities that serve both the visual identity and the conversion goal.
Living Blueprint Hero Section
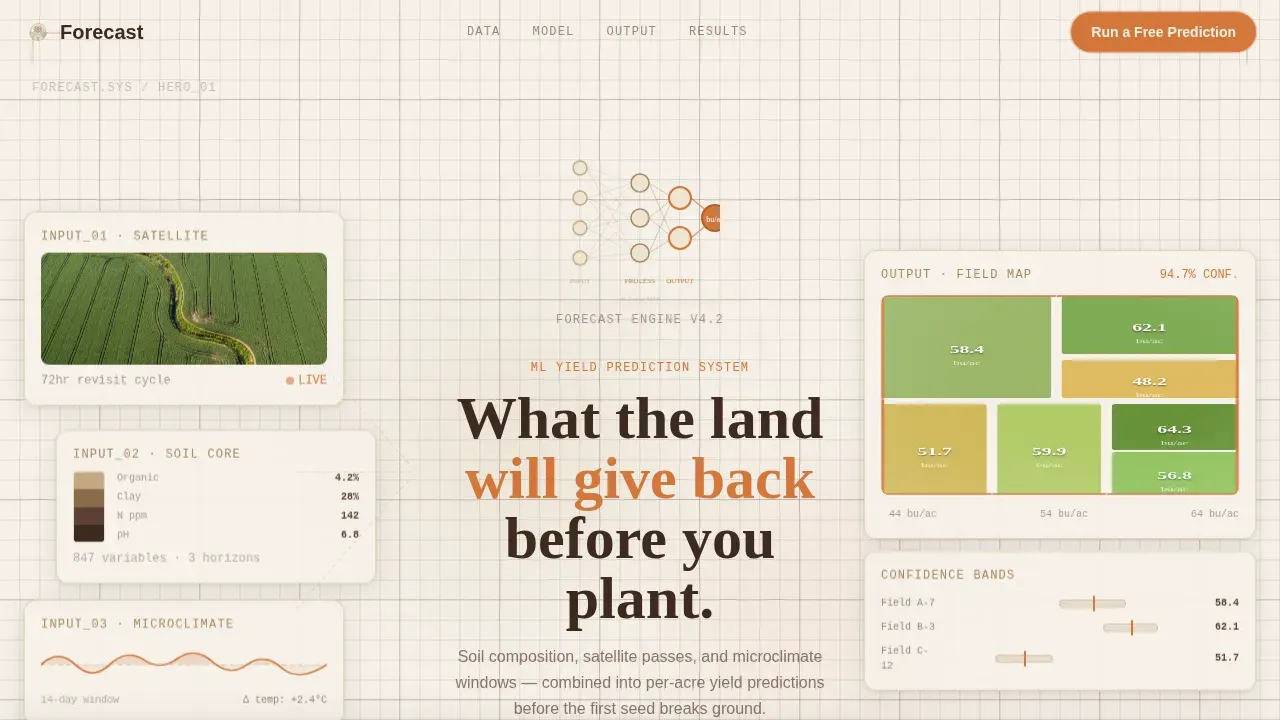
The hero consumes ninety percent of the viewport and renders as an architectural cross-section of the prediction pipeline. Raw inputs, a satellite thumbnail, a soil core diagram, a humidity waveform, float on the left as blueprint annotations. Construction lines converge at a stylized neural network in the center. On the right, a field map shaded from amber to deep green shows parcel-level yield prediction values down to the decimal. Subtle parallax layers shift as if the visitor is leaning over the blueprint itself.
Scroll-Driven Data Ingestion Section
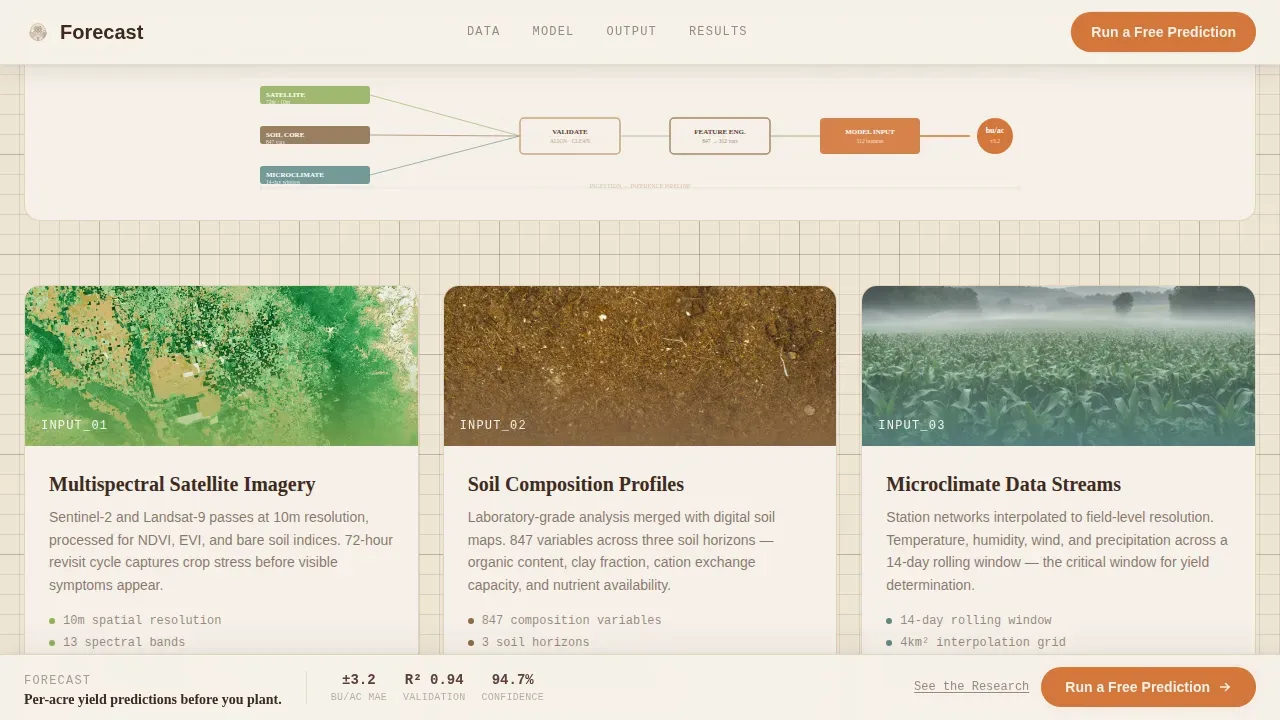
The data ingestion section visualizes how the model collects weather data, soil composition readings, and satellite imagery as blueprint elevation diagrams. Sensor grids and satellite pass paths are rendered in the engineering schematic style. This section makes the data collection process legible to technical buyers who want to understand inputs before trusting model outputs.
Exploded Model Architecture Diagram
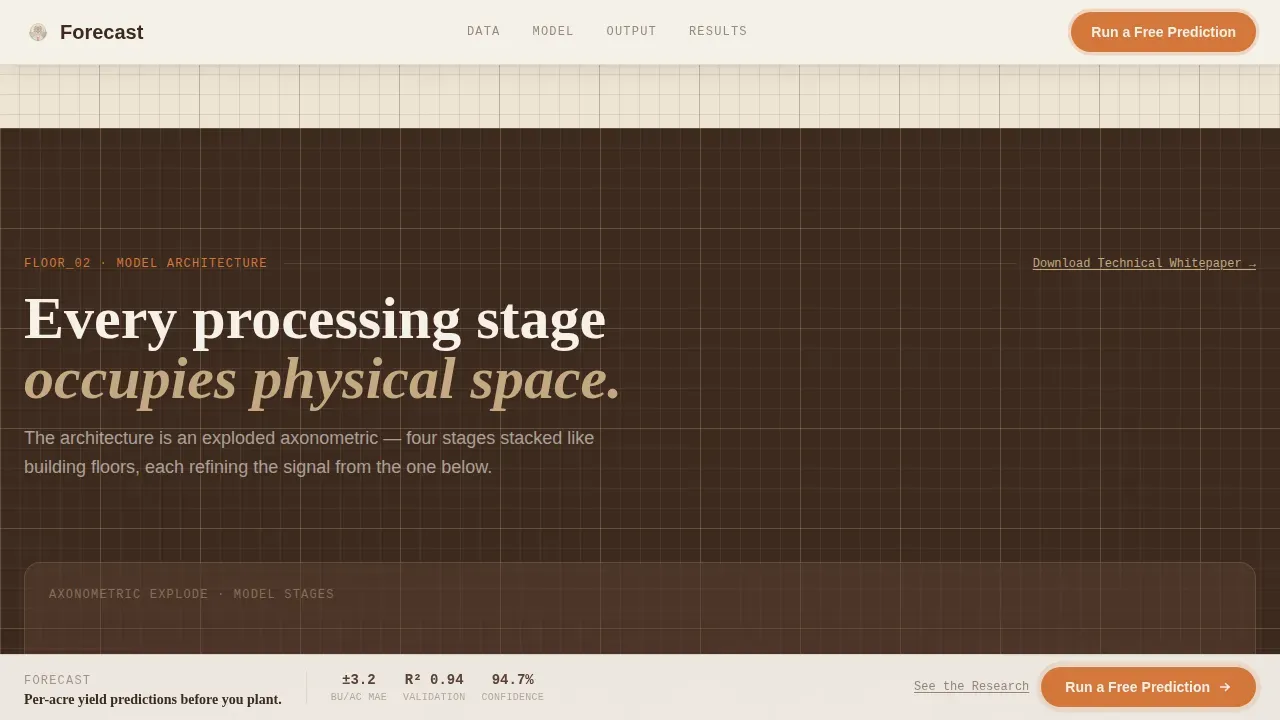
The model architecture section uses an axonometric diagram where each processing stage occupies a defined physical space on screen. This exploded view communicates the machine learning pipeline as a structural object, not a black box. Buyers can see how raw signals move through each stage toward a final crop yield forecast.
Real Dashboard Output Mockups
The output delivery section shows actual dashboard mockups with field boundaries, confidence intervals, and historical accuracy overlays. These mockups demonstrate what a buyer receives after a prediction run, specific bushels-per-acre values, parcel-level variance, and comparison against historical trends. This is the section where abstract capability becomes a concrete tool.
Persistent Stake Orange Call-to-Action Bar
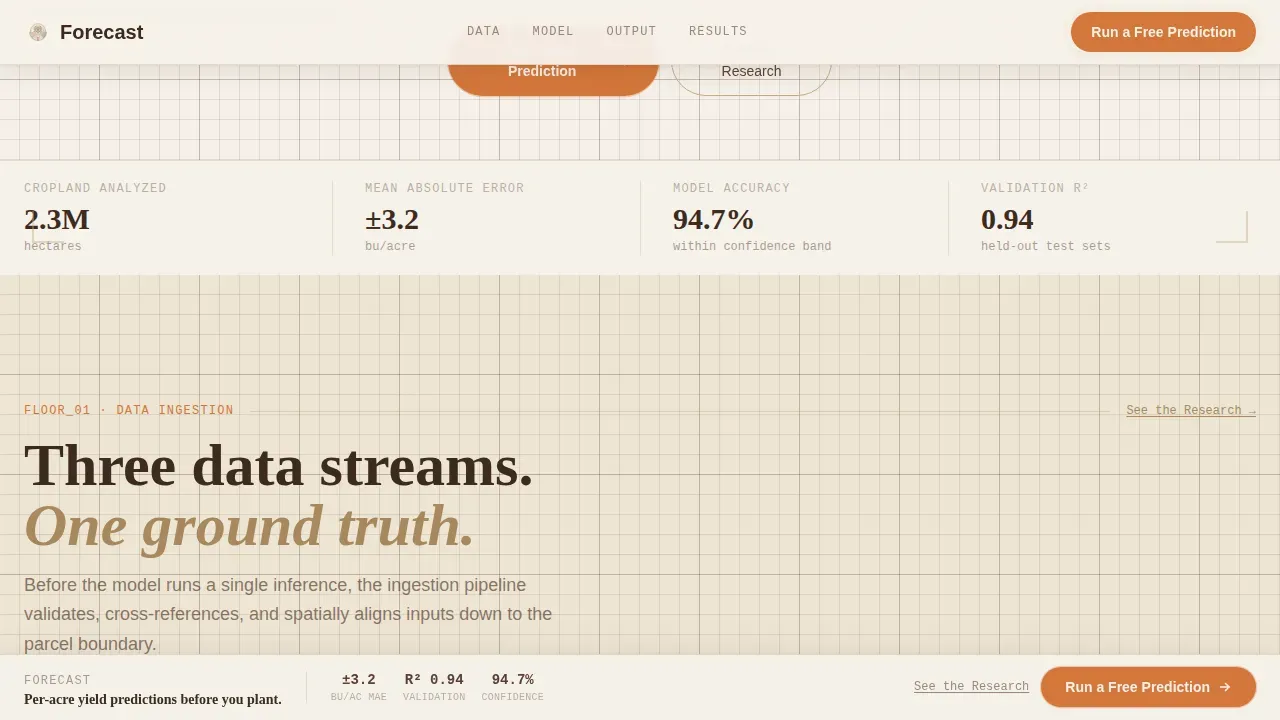
A fixed bottom bar activates after the visitor scrolls past the data ingestion section. The primary call to action, "Run a Free Prediction", is rendered in stake orange and routes to a product trial page where users drop a pin on a satellite map to receive a sample yield estimate. A secondary text link, "See the Research," appears beside each technical section for visitors who need documentation before they commit.
Social Proof with Accuracy Metrics
A dedicated social proof section houses testimonials from operations managers alongside specific accuracy metrics. The section reinforces trust with quantified outcomes, yield variance data, prediction accuracy ranges, and regional output figures, presented within the blueprint visual system to keep the tone technical and credible.
Page sections overview
| Section | Purpose |
|---|---|
| Hero Blueprint View | Show the full prediction pipeline as an interactive architectural schematic |
| Data Ingestion Layer | Visualize satellite, soil, and weather data collection as blueprint elevations |
| Model Architecture Diagram | Explain the machine learning stages using an exploded axonometric layout |
| Output Delivery Dashboard | Display real field maps with parcel yield values and confidence intervals |
| Social Proof Strip | Build trust with quantified accuracy metrics and agribusiness testimonials |
| Footer Flow | Anchor the page with navigation and a final conversion prompt |
Design & branding system
The visual identity follows an Engineering Blueprint theme carried through a Warm Stone color palette. Every color has a specific functional role in the layout, ensuring that technical data and interactive elements are always visually distinct.
- Backgrounds use parchment white (#F5F0E8) and sun-dried sandstone (#C4A882) to give the page a warm, tactile quality
- Dense data visualizations and structural diagram lines render in plowed-earth umber (#5C4033) for maximum contrast against light backgrounds
- Surveyor's stake orange (#D4763A) is reserved for all interactive elements, primary buttons, and the persistent call-to-action bar, making every clickable element instantly recognizable
Typography uses Fraunces for serif display headings, DM Sans for body copy, and IBM Plex Mono for data labels and field measurements.
Mobile & speed optimization
The template is built desktop-first, reflecting the workstation and tablet environments where agribusiness operations managers review field data. The layout and animations are structured to perform well in that context.
- Server Components handle all static sections, reducing load overhead for non-interactive page areas
- Client Components power the parallax hero, scroll-linked reveals, and hover states on field map parcels
- The hero parallax and blueprint line-draw animations are scoped to desktop breakpoints to avoid degrading the experience on smaller screens
How this template helps you convert
The page is structured as a Click-Through landing page. Every design and content decision is made to move the visitor from curiosity to a trial prediction run.
- The hero section earns attention immediately by showing the full yield prediction pipeline as a visual object, visitors understand what the model does before reading a single sentence of body copy
- The persistent stake orange call-to-action bar activates mid-scroll, reaching visitors exactly when they have seen enough of the data ingestion and model architecture sections to feel confident
- Secondary "See the Research" text links appear beside each technical section, giving data-driven buyers a lower-commitment path that still keeps them engaged with the product
Other information about this template
This template is designed specifically for teams presenting AI-powered crop yield prediction tools to professional agricultural audiences. The sections below cover additional context that helps you get the most from the template.
- The forecast precision yield prediction AI landing page template is structured to showcase AI-driven software that predicts crop production with high accuracy, following established best practices for this category of tool
- Accurate crop yield prediction enables better resource allocation, financial planning, and crop management, which is exactly the value proposition this template communicates across each scroll section
- The layout keeps data visualizations clutter-free with generous spacing, following the principle that white space should guide the eye toward key data points and call-to-action buttons
- Machine learning algorithm transparency matters to buyers: the template supports explainable outputs by giving the model architecture its own full section, helping visitors understand prediction factors before they commit
- The template supports a wide array of use cases beyond direct sales, agronomists, farm managers, data analysts, researchers, investors, and agricultural consultants can all use it for project proposals or stakeholder presentations
- Crop yield forecasting content built on this template can communicate findings on yield trends clearly to non-technical stakeholders using the built-in visual hierarchy
- Real-time data integration and the ability to reflect daily-updated yield forecasting results are natural fits for the output dashboard section of this template
- Predictive analytics platforms that track vegetation indices, including the normalized difference vegetation index (NDVI), can map their data outputs directly into the field map mockup section
- The template supports model selection narratives, including pure time series forecasting approaches and more complex machine learning models that incorporate soil type, water stress, and seasonal trends
- Historical data, historical trends, and weather forecasts can all be incorporated into the social proof and dashboard mockup sections to reinforce prediction accuracy claims
- The social proof section is designed to accommodate specific accuracy figures, such as 85% to 99% accuracy at the county level, which are the kinds of numbers that move professional buyers toward a free prediction trial
- Remote sensing workflows and vegetation indices analysis can be explained within the data ingestion section using the blueprint elevation diagram format built into this template
- Exponential smoothing and time series forecasting methodologies can be referenced in the model architecture section to address technically sophisticated buyers
- The page earns sales momentum by making the prediction feel inevitable rather than magical, showing machinery first, then asking for the click
Theme
Engineering Blueprint
Creative direction
Spatial & Architectural
Color system
Warm Stone
Style
Hero-Dominant (90/10)
Direction
Click-Through
Page Sections
Living Blueprint Hero with Parallax Layers
Scroll-driven Data Ingestion Visuals
Axonometric Model Architecture View
Dashboard Output with Confidence Intervals
Persistent Stake Orange Call-to-action Bar
Social Proof with Quantified Accuracy Metrics
Related questions
Who is this landing page template designed for?
What sections are included in this template?
Can I customize the colors and typography?
How does the call-to-action system work?
Is this template optimized for desktop or mobile use?