Precision F&B Digital Transformation Comparison Landing Page Template
The Optimize Precision F&B Digital Transformation Comparison Landing Page Template is built for food and beverage consultancies that need to prove methodology depth before asking for a meeting. It combines a six-phase current-state versus future-state comparison structure, three ungated case studies, and a gated diagnostic workbook to move VP-level operations leaders and CFOs from skeptical to signed.
by Rocket studio
Quick summary
This is a single-page, section-led landing page designed for a food and beverage digital transformation consultancy. It opens with an award badge ribbon, moves into radical transparency through side-by-side comparison tables, delivers three proof-backed case studies, and closes with a gated 22-page diagnostic workbook. The result is a war-room experience that earns trust before it asks for anything.
Who this template is for
This template is built for consultancies and professional services firms that serve the food and beverage industry at the operational level. It works best when your buyers are senior decision-makers who have already lived through at least one failed project and need to see your thinking before they book a call.
- VP Operations, COO, and supply chain leaders at mid-market consumer packaged goods brands scaling past manual spreadsheets
- CFOs at food distributors who watched a failed enterprise resource planning rollout drain months of budget and need a proven path forward
- Practice leads and business development directors at digital transformation firms serving beverage manufacturers, regional chains, and food processors
What problem this template solves
Many food and beverage manufacturers struggle to communicate their digital transformation methodology in a way that builds genuine buyer confidence. A polished brochure page does not address the real fear in the room: "We have tried this before and it failed." The template solves that credibility gap head-on.
- Buyers in the food industry arrive skeptical after costly ERP systems failures, so the comparison table structure shows every deliverable, timeline, and risk factor openly before requesting any commitment
- Food and beverage business leaders cannot assess a consultancy's depth from a vague capability list, so the six-phase methodology tables replace polished vagueness with radical specificity
- Conversion stalls when the gated resource feels like a toll booth, so the page earns the download by proving framework depth first and making the workbook feel like the obvious next step
What you get with this template
You get a fully structured, single-page layout that functions like a precision project war room. Every section has a defined job: establish credibility, prove methodology, deliver case study evidence, and capture the lead. Nothing is decorative without purpose.
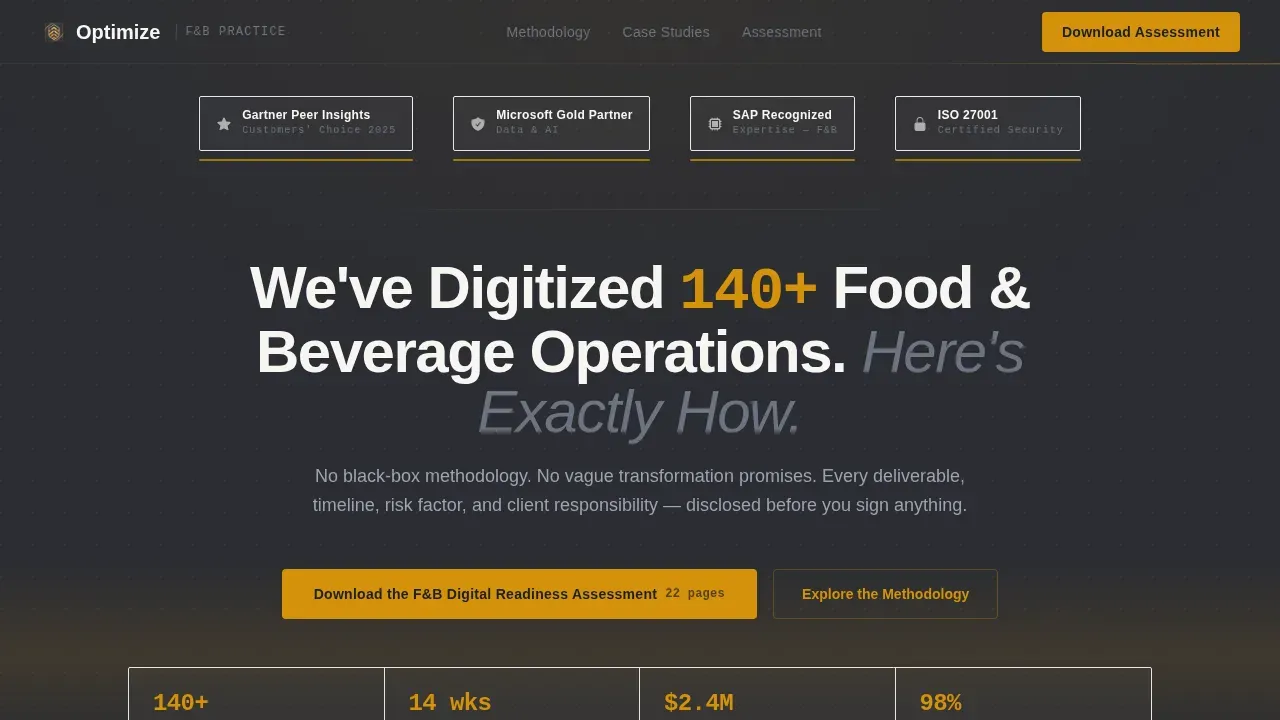
- A hero section with an award badge ribbon, a headline anchored to 140-plus completed operations, and a metrics bar that establishes quantifiable social proof above the fold
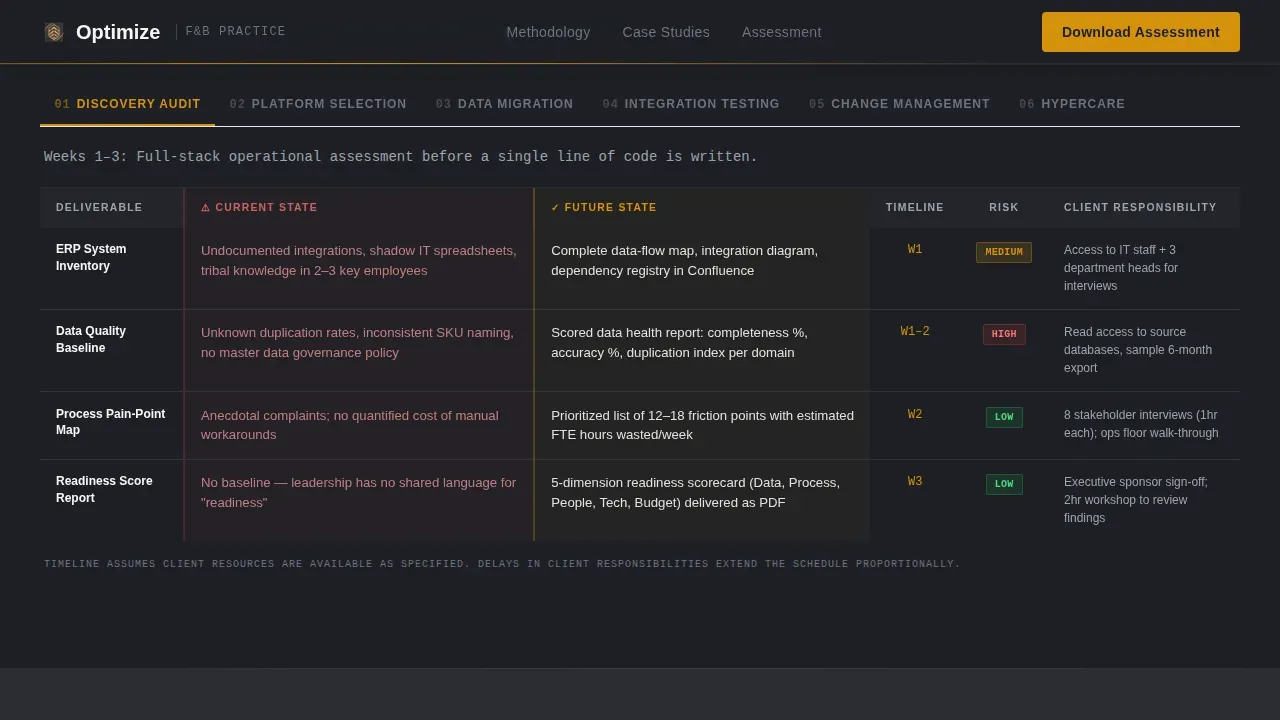
- Six side-by-side comparison tables covering Discovery Audit, Platform Selection, Data Migration, Integration Testing, Change Management, and Hypercare, each row naming the deliverable, the timeline in weeks, the risk factor, and the client responsibility
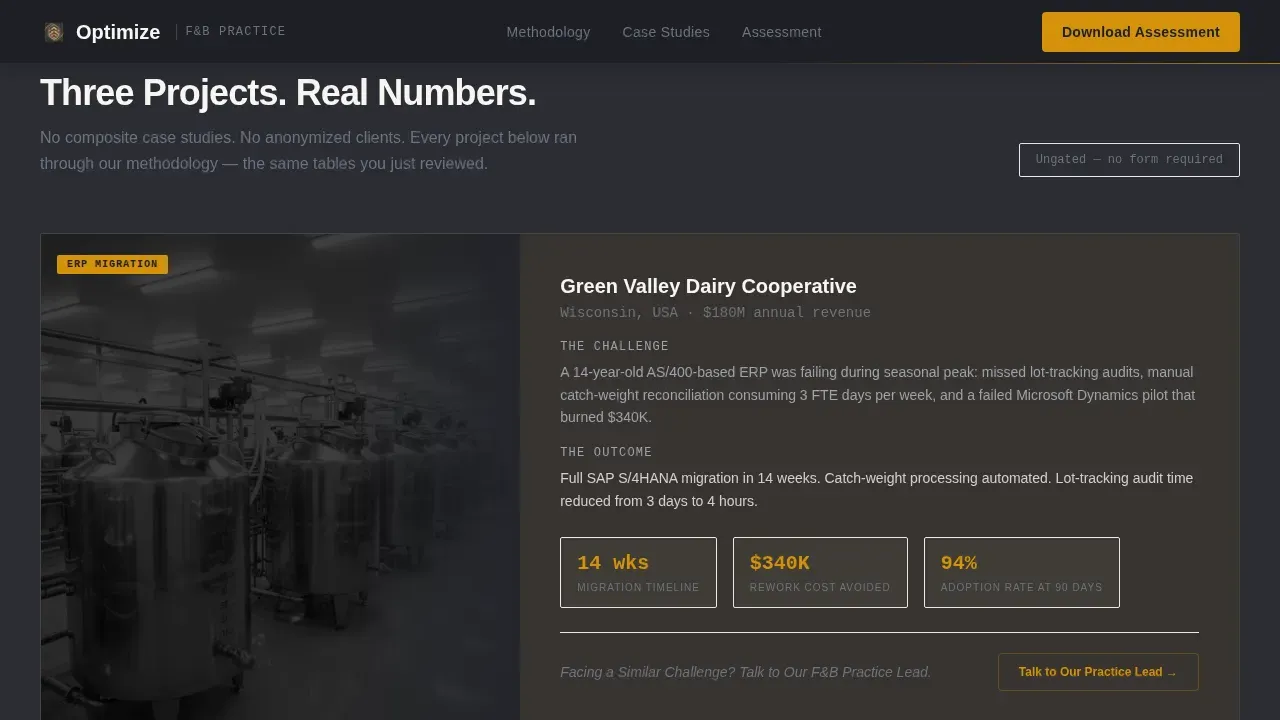
- Three ungated case studies covering a dairy cooperative ERP migration, a snack brand demand forecasting result, and a beverage distributor warehouse automation project, each ending with a contextual call to action
Feature list
This section describes the core structural and design capabilities built into this template.
Six-Phase Comparison Table System
The heart of this landing page is a set of six interactive comparison tables, one for each transformation phase. Each table displays current-state versus future-state conditions side by side. Rows name specific deliverables, week-based timelines, risk factors, and client responsibilities. This structure lets food and beverage manufacturers see exactly where projects like theirs typically succeed or fail, replacing vague promises with documented process.
Gated Diagnostic Workbook Form
A short lead-capture form gates the 22-page F&B Digital Readiness Assessment. The form requests only what is necessary: company name, annual revenue band, current ERP system, and work email. This minimalist approach limits friction, since each extra field reduces the probability of completion. The form connects the consultancy's content marketing effort directly to a qualified lead pipeline.
Ungated Case Study Section
Three published case studies are presented without a gate, so potential customers can verify real outcomes before deciding to download the workbook. Each case study covers a distinct food and beverage business scenario. Each one ends with a contextual call to action linked to a specific challenge, helping readers self-identify and move forward. This approach supports customer relationships by connecting evidence to action.
Award Badge Header Ribbon
The hero opens with a horizontal ribbon of institutional credentials rendered as monochrome crests against a deep charcoal background. Each badge receives a subtle amber underline pulse on load. This above-the-fold focus answers the buyer's first question in under eight seconds: who has validated this firm and why should I keep reading.
Accordion frequently asked question Rows
Interactive accordion rows handle common buyer objections and detailed methodology questions without cluttering the main page scroll. Each row expands on demand. This keeps the page clean and skimmable while still offering the depth that CFOs and operations leaders need to make informed decisions with confidence.
Trust Anchor Statistics Bar
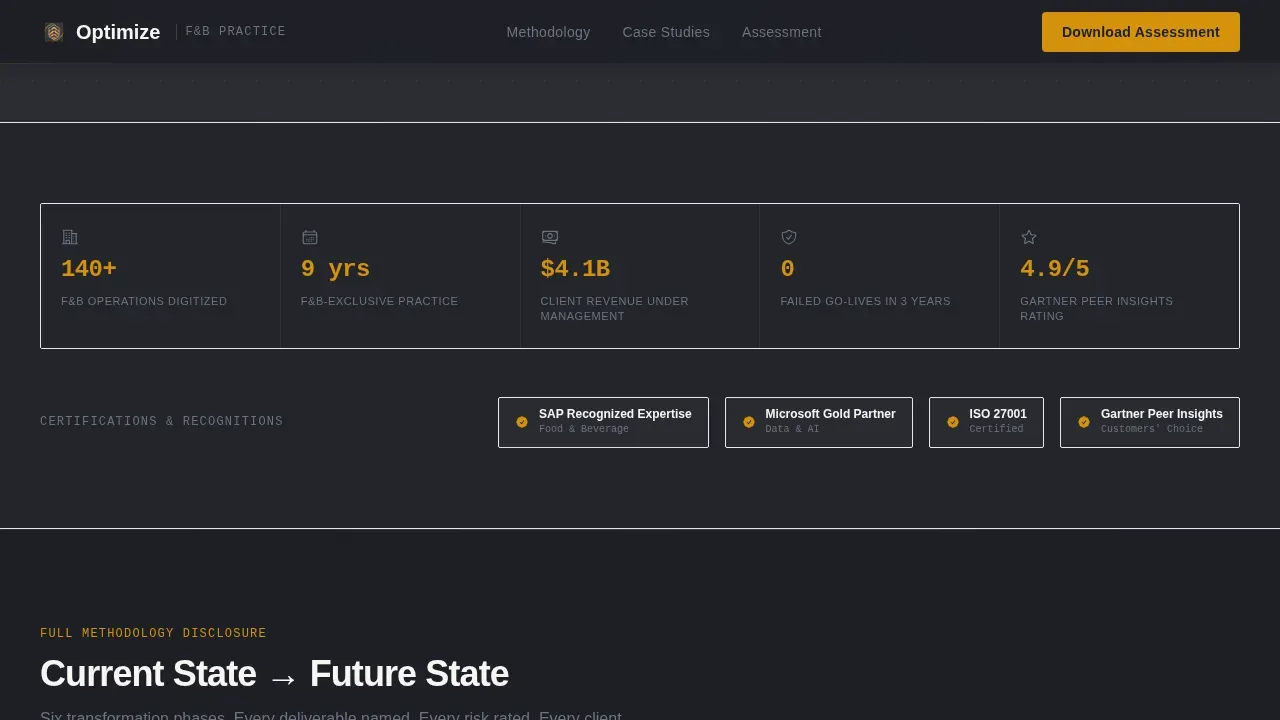
Below the case studies, a statistics bar displays aggregate performance data across all completed engagements. This section provides valuable insights into scale, consistency, and delivery track record. It reinforces the headline claim of 140-plus operations with specific supporting numbers, adding a layer of quantifiable social proof that lifts customer satisfaction with the browsing experience itself.
Page sections overview
| Section | Purpose |
|---|---|
| Hero Badge Ribbon | Establish credentials and open with institutional proof before any claim is made |
| Headline Metrics Bar | Anchor the 140-plus operations stat and surface key performance indicators above the fold |
| Discovery Audit Table | Compare current-state chaos with future-state process clarity for phase one |
| Platform Selection Table | Show how ERP systems are evaluated and selected with full risk transparency |
| Data Migration Table | Map deliverables, timelines, and client responsibilities for data transfer phase |
| Integration Testing Table | Display test coverage, risk factors, and sign-off criteria side by side |
| Change Management Table | Contrast manual adoption approaches with structured change enablement plans |
| Hypercare Table | Show post-go-live support commitments and escalation paths in plain terms |
| Case Study Block | Deliver three ungated proof stories with contextual calls to action |
| Gated Assessment Form | Capture qualified leads with a short, low-friction diagnostic workbook offer |
| Trust Anchor Bar | Reinforce scale and delivery consistency with aggregate statistics |
| Footer Row | Provide single-row navigation and legal links in a clean linear layout |
Design & branding system
The visual identity follows a Corporate Precision theme built around a Charcoal and Amber color system. The overall feel is a leather-bound strategy deck opened under conference room lights: serious enough for the C-suite and warm enough to signal a partnership rather than a vendor transaction.
- Core palette: deep boardroom charcoal (#2B2D33) anchors headers and section dividers; warm operational amber (#D4920B) drives every interactive element, hover state, and data highlight; clean documentation white (#F7F6F3) handles body text; and muted steel (#6B7280) handles secondary text and table borders
- Typography: Plus Jakarta Sans is used for all headers and section labels for clarity and authority; JetBrains Mono is used for all table data, metrics, and timeline figures to signal precision and technical rigor
- Animation approach: medium-intensity beam border sweeps, fade-slide-in scroll reveals, amber pulse on badge load, and staggered table row animations that simulate opening a project brief line by line
Mobile & speed optimization
This template is desktop-first by design, reflecting where C-suite buyers in the food and beverage sector do their deep research, on laptops in conference rooms. Full mobile support is included so that supply chain leads and beverage businesses accessing the page from other devices get a complete, functional experience.
- Mobile layout adapts comparison tables into vertically stacked formats with thumb-friendly tap targets and visible primary calls to action without requiring horizontal scrolling
- Server-side components handle all static content sections, while client-side components manage the interactive comparison table toggles, accordion frequently asked question rows, and gated form to support fast initial load and smooth interactivity
- Images and visual assets are sized and formatted to support fast delivery, with the layout structured so the hero section and badge ribbon load immediately to maintain above-the-fold clarity on all screen sizes
How this template helps you convert
Optimizing precision in digital transformation landing pages means aligning every section with what the buyer needs to see before they act. This template builds conversion through a transparent, evidence-led scroll that earns the lead rather than demanding it.
- The above-the-fold section leads with the award badge ribbon and the headline claim, immediately establishing that this firm has delivered at scale; this answers "What is this?" and "What's in it for me?" within the first eight seconds of the visit, satisfying above-the-fold clarity without relying on abstract graphics or stock photography
- The six-phase comparison table structure functions as the primary trust engine; by showing every deliverable, risk factor, and client responsibility openly, the page removes the uncertainty that causes food and beverage business leaders to disengage; buyers who scroll through all six phases are self-qualifying as serious prospects before they ever reach the form
- The three ungated case studies create a final proof layer just before the gated offer, so when the form appears it feels like a natural continuation of the conversation rather than an interruption; the short, minimalist form limits fields to only what matters, keeping conversion probability high
Other information about this template
This template is part of a broader set of precision-built resources for consultancies serving the food and beverage manufacturing space. The sections below cover additional context that may be useful for teams evaluating this template for their practice.
- The template supports beverage marketing strategies by giving beverage brands a structured digital channel to present complex transformation methodology in a format that is scannable, credible, and action-oriented
- Food and beverage brands in the beverage world can use this layout to surface essential KPIs, track supply chain performance, and address the major challenges buyers bring to an initial discovery conversation
- The comparison table rows can be updated to reflect accurate forecasting timelines, supplier performance benchmarks, energy consumption reduction targets, and inventory management gains relevant to each client segment
- Beverage manufacturers and food and beverage manufacturers operating in the beverage manufacturing industry can adapt the case study section to highlight outcomes specific to their food and beverage manufacturing niche, including production processes, quality assurance improvements, and cost savings achieved
- Food and beverage business teams can use the gated workbook form to collect purchase history context and revenue band data that supports better segmentation of potential customers who download the assessment
- The beverage sector and broader food industry benefit from templates like this one because food industry performance is not tracked efficiently enough across many mid-market operations, and a structured landing page paired with a diagnostic workbook gives loyal customers and new prospects a clear entry point into a more rigorous engagement
- The beverage industry and food and beverage sector continue to face pressure to stay ahead of consumer demand shifts and market changes; this template gives consultancies a credible platform to demonstrate that their methodology can help food and beverage business leaders make informed decisions and increase profitability even inside a complex digital landscape
- Teams can connect the page to tools like Google Analytics to track scroll depth, form starts, and case study engagement, then use that performance data to run systematic A/B testing on the call to action wording, form field order, or table row sequencing
- The optimize precision f b digital transformation comparison landing page template is designed to support continuous improvement of the consultancy's own lead generation process, applying the same data-driven discipline it recommends to its food and beverage clients
- Beverage businesses and food and beverage brands looking to improve customer experience, customer satisfaction, and brand loyalty through clearer digital communication will find this layout well suited to those goals
- The template can also support content marketing and beverage marketing efforts by serving as a central hub that search engines can index for topic-authority queries related to ERP systems, supply chain transformation, and data analytics for the food industry
Theme
Corporate Precision
Creative direction
Transparent Process
Color system
Charcoal & Amber
Style
Comparison Table
Direction
Content/Resource
Page Sections
Six-phase Methodology Comparison Tables
Gated Diagnostic Workbook Lead Form
Ungated Three-story Case Study Block
Award Badge Hero Ribbon
Trust Anchor Statistics Bar
Interactive Accordion Frequently Asked Question Rows
Related questions
Who is this landing page template best suited for?
Can I customize the comparison table phases for my specific practice?
Does the gated form support lead qualification?
How does the ungated case study section support conversion?
Is this template adaptable across different food and beverage sub-sectors?