Decentralized Enterprise Software Cost Calculator Website Template
The Resolve Decentralized ITSM Mesh Node Calculator landing page template is a split-screen, tool-first layout built for B2B SaaS platforms in the decentralized IT service management space. It leads with a live cost-and-node calculator, animates a peer-to-peer mesh visualization in real time, and converts visitors through a freemium trial flow. The carbon fiber visual system and dynamic motion design make the data do the persuading.
by Rocket studio
Quick Summary
This template puts a working ITSM cost and node calculator front and center. Visitors enter their current agent count, monthly ticket volume, and annual licensing spend, then watch a live mesh visualization redraw itself and a savings figure render in real time. The page earns trust before asking for anything, then converts through a progressive freemium sign-up flow and a secondary whitepaper path.
Who This Template Is For
This template was designed for teams and founders operating in the decentralized enterprise software space, specifically those building or marketing platforms that challenge monolithic IT service management models. It suits product-led growth strategies where showing the math wins over telling the story.
- Platform engineering leads who need to justify moving away from expensive centralized licensing to stakeholders who control the budget and who are drowning in annual true-up cycles.
- ITOps managers at mid-market companies running fragmented service management across multiple Slack channels and shadow help desks, who need a clear cost comparison to make the internal business case.
- Managed service provider architects stitching together multi-tenant environments across client networks, who need a tool that demonstrates node-level efficiency across distributed data systems at a glance.
What Problem This Template Solves
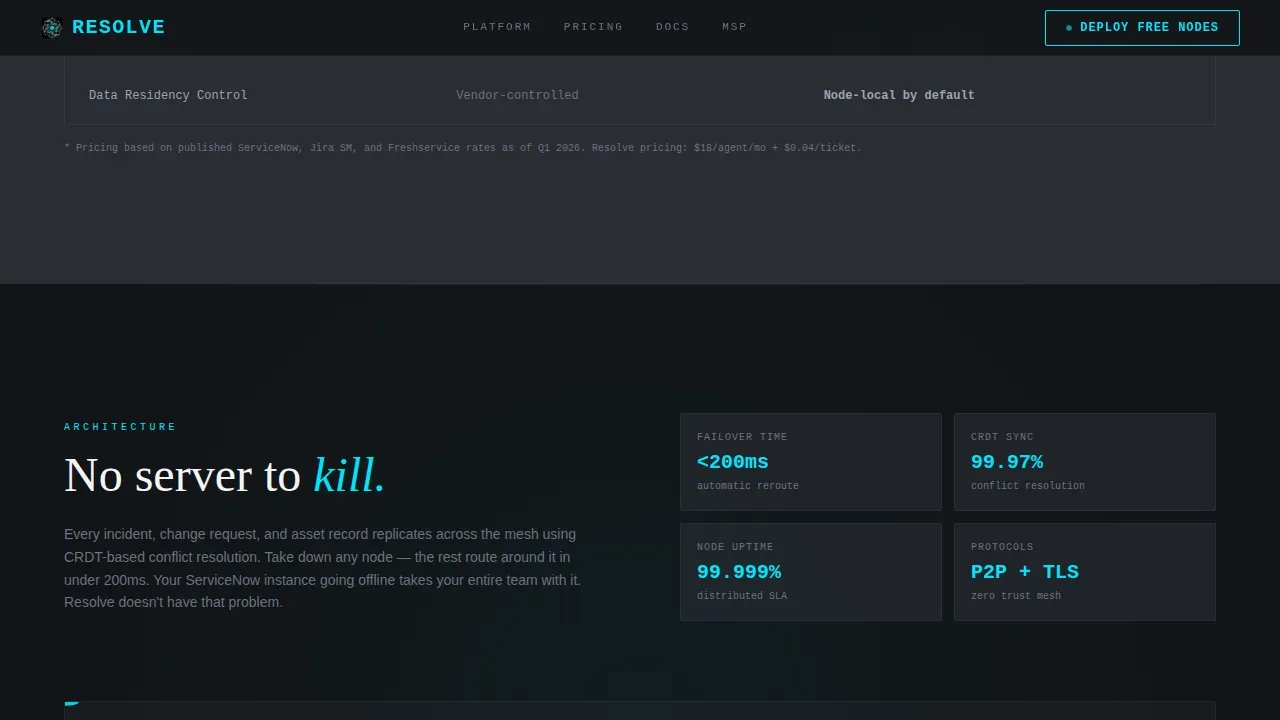
Monolithic ticketing platforms create a single point of failure. Every incident, change request, and asset record flows through one central server, and when that server slows or goes down, the entire service management operation stalls. The architecture problem is real, but the harder problem is convincing budget holders to act on it.
Traditional landing pages for decentralized ITSM platforms lead with diagrams and whitepapers. By the time a visitor reaches the part that explains savings, they have already bounced. This template solves the persuasion problem by making the value calculation the first thing a visitor touches, not the last.
- No engagement hook before the ask is the core conversion failure this template is designed to prevent. The calculator delivers a personalized savings number before any form appears, so the visitor's own data does the convincing.
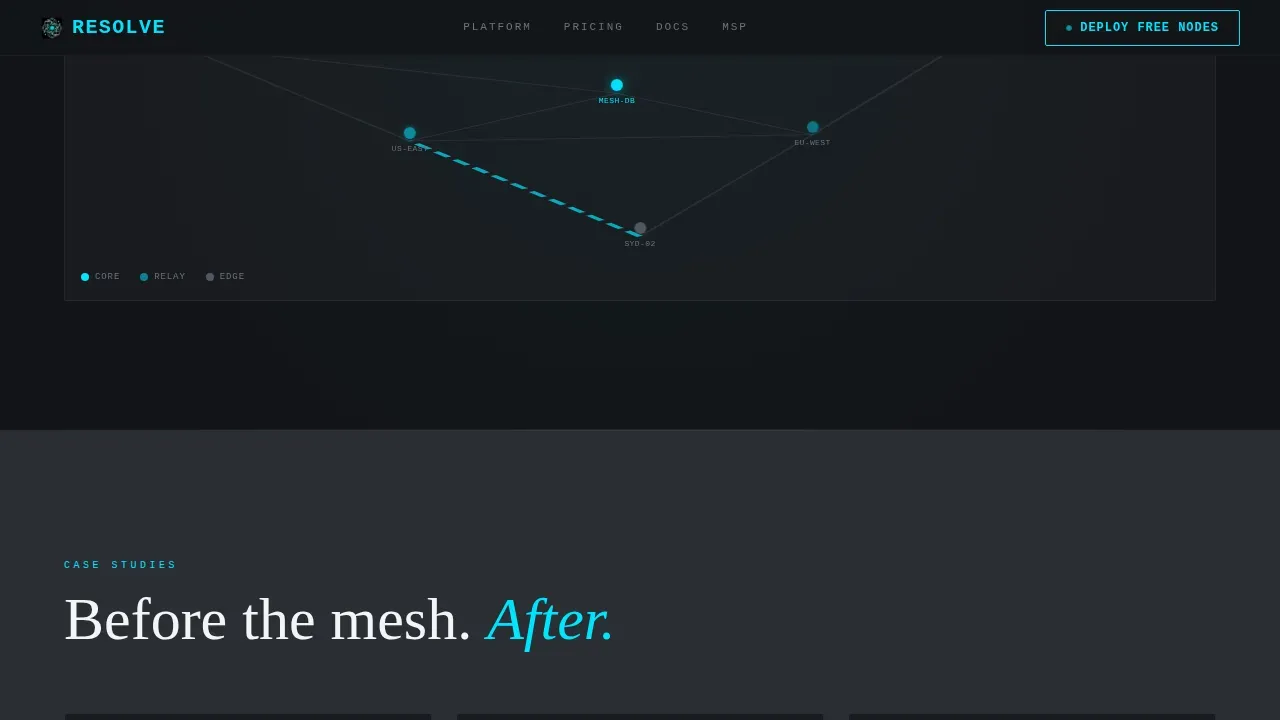
- No clear visualization of decentralization is a common gap in ITSM landing pages. The animated node graph in this template makes distributed data mesh architecture legible in seconds, showing how ticket routing works across peer-to-peer nodes without a central server.
- No credible cost comparison leaves visitors unable to build an internal business case. The side-by-side cost comparison table and the three before-and-after case study cards give them the data they need to move the decision forward inside their organization.
What You Get With This Template
This template ships as a fully structured, section-ordered landing page. Every section has a defined layout, a defined interaction model, and a defined role in the conversion flow. No section is decorative. Every element either demonstrates value, builds trust, or moves the visitor toward deploying their first nodes free.
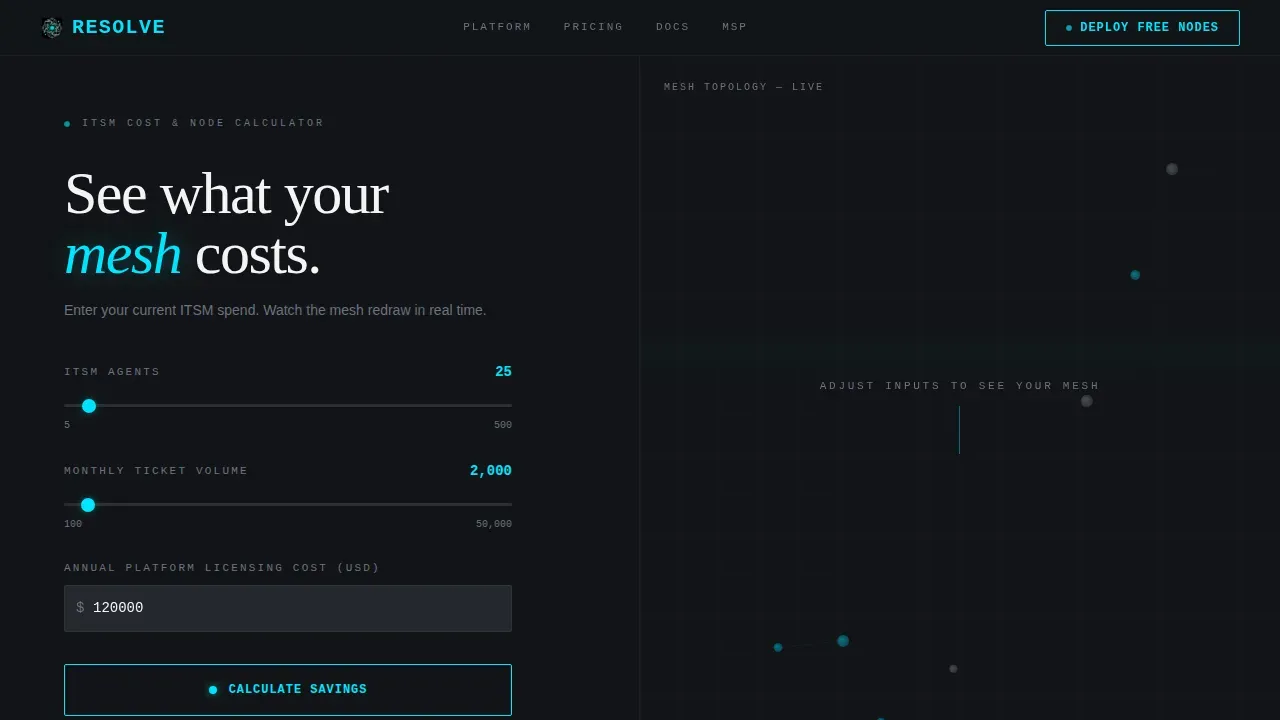
- Hero split-screen section with a three-input live calculator on the left panel and an animated node graph on the right panel, where the mesh redraws itself and the savings figure renders live as input values change, making the tool the visual centerpiece from the first second of the visit.
- Below-the-fold evidence sections including a side-by-side cost comparison table, an animated architecture diagram showing how ticket routing works without a central server, and three case study cards displaying before-and-after metrics for mean time to resolution, licensing cost per seat, and single-point-of-failure incidents per quarter.
- Progressive conversion flow with a primary call to action reading "Deploy Your First 5 Nodes Free" that appears locked beneath the calculator output until the visitor completes a calculation, a two-screen progressive sign-up form, and a secondary whitepaper download path gated behind the same email field.
Feature List
This template was built around five core capabilities that work together to demonstrate mesh value, convert platform engineering leads, and support the technical credibility that decentralized service management buyers expect.
Live ITSM Cost and Node Calculator
The calculator is the hero of this page. Three input fields collect the visitor's current number of ITSM agents, their average monthly ticket volume, and their annual platform licensing cost. As values change, the right panel redraws the animated node graph in real time and renders the projected savings figure in 48-pixel cyan type against the carbon black background. Input variables include node quantity and capacity, data volume and throughput, and operational costs, so the output represents a comprehensive picture of return on investment. The centerpiece is immediately visible and interactive from the first page load, allowing any visitor to calculate the value of running a node before they read a single sentence of copy. Output metrics cover return on investment and profitability, throughput and efficiency, and uptime and reliability, giving the visitor a full picture of what decentralized service management means for their specific operation.
Animated Peer-to-Peer Mesh Visualization
The right panel of the hero section hosts a live Canvas-based node graph. Circles representing distributed data nodes pulse and connect with cyan trace lines. The count of visible nodes scales with the ticket volume the visitor enters, so the visualization is not decorative but responsive to their real data. This graphic makes the transition from centralized ITSM to a decentralized mesh structure legible without requiring the visitor to read a technical explanation. The animation uses scroll-linked reveals and horizontal parallax transitions to keep the split-screen rhythm alive as the visitor moves down the page, with the left side always presenting evidence and the right side always animating the system responding to it.
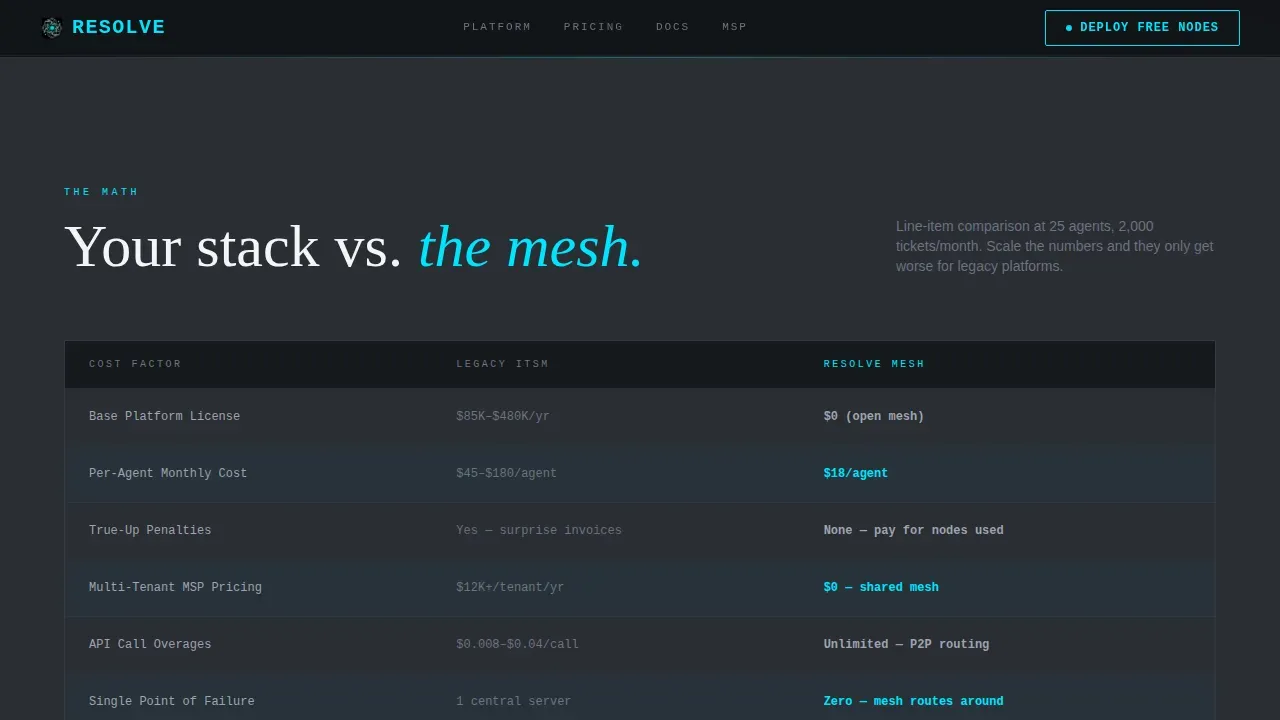
Side-by-Side Cost Comparison Table and Case Study Cards
Below the fold, the template presents a structured cost comparison section. The table places the visitor's current stack costs alongside Resolve's mesh pricing in two clean columns, making the SLA compliance cost savings argument concrete and easy to screenshot for internal presentations. SLA compliance cost savings can be demonstrated clearly by comparing decentralized infrastructure costs against traditional ITSM seat licenses. Three case study cards follow, each displaying a before-and-after metric pair. The metrics cover mean time to resolution, licensing cost per seat, and single-point-of-failure incidents per quarter, giving visitors three distinct angles to use in their own business analysis and internal justification process.
Progressive Two-Screen Sign-Up Form
The conversion flow is designed to minimize friction at the moment of highest intent. The first screen of the sign-up form asks only for a work email address. The second screen asks for the visitor's current ITSM platform from a dropdown that includes several major platforms, and their team size range. This two-step approach reduces the perceived effort of signing up while collecting the data the platform needs to personalize the onboarding experience. The primary call to action, "Deploy Your First 5 Nodes Free," is revealed beneath the calculator output only after the visitor runs a calculation, rewarding engagement and making the free trial feel like a logical next step rather than an interruption.
Secondary Whitepaper Conversion Path
Not every visitor is ready to deploy nodes on the first visit. Some need to build an internal business case before they can bring a new platform to their team or their clients. The template includes a secondary call to action offering the Mesh Architecture Whitepaper, gated behind the same email field as the free trial. This path catches technically oriented visitors who need to present a documented architecture argument to a committee or a client, converting them into leads even when they are not yet ready for a trial. The whitepaper gate uses the same progressive form structure, so the data collection effort is consistent across both conversion paths.
Horizontal Parallax Section Transitions
Each below-the-fold section transitions with a subtle horizontal parallax effect that maintains the split-screen visual rhythm established in the hero. The left side of every section presents structured evidence, such as the cost table, the architecture diagram, or the case study cards, while the right side animates the system responding to that evidence. The motion never decorates. It demonstrates. This design principle keeps the page feeling like a live system rather than a marketing brochure, which is the right signal to send to platform engineering leads who distrust anything that feels like a sales pitch.
Page Sections Overview
| Section | Purpose |
|---|---|
| Hero Calculator | Live cost and node calculator with split-screen animated mesh visualization |
| Cost Comparison | Side-by-side table comparing current stack costs against mesh pricing |
| Architecture Diagram | Animated diagram showing ticket routing across peer-to-peer nodes without a central server |
| Case Study Cards | Three before-and-after metric pairs covering resolution time, seat cost, and failure incidents |
| Progressive Signup | Two-screen email-first form with primary trial call to action and secondary whitepaper download path |
| Footer Row | Linear single-row footer with essential links |
Design & Branding System
The visual identity follows a Dynamic Motion theme built on a Carbon Fiber color system. Every color choice has a functional role. Nothing is decorative, and nothing is arbitrary. The palette was designed to feel like running a thumb across the weave of a matte-black chassis panel, tactile and engineered with zero ornamentation.
- Color roles are strict: deep carbon black (#121417) serves as the primary background, woven graphite (#2A2D34) defines surface layers and card backgrounds, titanium midtone (#6B7280) carries all body text and label copy, and reactive cyan (#00E5FF) appears exclusively on interactive states, live calculation outputs, and node-pulse animations. Every element the visitor can touch glows cyan.
- Typography is purpose-built for technical audiences: JetBrains Mono handles all data labels, calculator outputs, and metrics displays, reinforcing the engineered character of the platform. DM Sans carries body copy at a comfortable reading weight. Fraunces handles display headings, giving the page a confident editorial authority without softening the technical tone.
- Section depth is created through color alternation: backgrounds shift between carbon black and graphite to create visual depth and section separation without using borders or dividers, keeping the layout clean and the focus on the data.
Mobile & Speed Optimization
The template is desktop-first by design, reflecting the reality that platform engineering leads and ITOps managers do most of their evaluation work at a workstation. The calculator, the mesh visualization, and the cost comparison table are all optimized for large-screen viewing where the split-screen layout has room to breathe and the node graph can render at full fidelity.
- Mobile persistent call-to-action bar: on smaller screens, the "Deploy Your First 5 Nodes Free" call to action appears as a fixed bar pinned to the bottom of the viewport, ensuring the primary conversion path is always accessible regardless of scroll position or screen size.
- Static and interactive section separation: static content sections such as the cost comparison table and the case study cards are structured as server-rendered components for efficient delivery, while the calculator and the mesh visualization are scoped as client-side components so interactivity loads where it is needed without blocking the rest of the page.
How This Template Helps You Convert
The conversion architecture of this template is built on a single principle: earn attention by delivering value before asking for anything. Every element in the conversion flow follows from that principle, and the sequence is deliberate.
- The calculator creates a personalized savings number. When a visitor enters their own agent count, ticket volume, and licensing spend, the output is no longer a generic claim. It is their number, rendered in cyan against carbon black, and it makes the case for decentralized service management more effectively than any paragraph of copy could. Efficiency gains for average resolution time and SLA compliance can be projected directly from the visitor's inputs, and a comprehensive return on investment picture justifies moving away from centralized tools before the visitor has scrolled past the hero.
- The locked call to action rewards engagement. The primary "Deploy Your First 5 Nodes Free" button is hidden until the visitor completes a calculation. This sequencing means the call to action appears at exactly the moment the visitor has the highest intent, immediately after they have seen their own savings number. The free trial no longer feels like a risk. It feels like the obvious next move.
- The secondary whitepaper path catches the visitors who need more time. Some buyers, especially MSP architects and platform leads at larger organizations, need to present a documented case to a committee before they can act. The whitepaper download gives them a reason to share their email without committing to a trial, and it delivers a resource they can actually use to move the decision forward inside their organization.
Other Information About This Template
This template operates at the intersection of several converging trends in enterprise software, and the design system, section architecture, and conversion flow were all shaped by the specific expectations of the audience it serves. The notes below cover additional context that buyers, developers, and content teams may find useful when adapting this template for production.
- Data mesh architecture principles inform the template's structure. The data mesh operating model decentralizes data ownership and treats data as a self-contained product. Domain teams manage their own data products, and each product is discoverable, addressable, trustable, and secure. The template reflects this philosophy visually: each section is a self-contained evidence unit, and the page as a whole routes the visitor toward a decision without a central bottleneck. Data products in a data mesh are designed to be consumed through well-defined schemas and application programming interfaces, and the template's API and integration section includes links to documentation for REST application programming interfaces and streaming endpoints for real-time node monitoring.
- Federated computational governance is a design principle, not just a feature. Federated Computational Governance ensures global standards are maintained across local nodes. The template communicates this by showing how the mesh architecture maintains coherence across distributed data nodes through the animated architecture diagram, without implying a central server is required. Decentralized systems often face skepticism regarding governance and security, and the template addresses this directly by including a space for security badges displaying audits or certifications relevant to the decentralized protocol in use.
- Data mesh combines the strengths of earlier data architecture paradigms. Data mesh combines the innovation of data warehouses and data lakes with the scalability of cloud technologies. A monolithic data lake centralizes all data in a single repository managed by a central data engineering team, which creates bottlenecks and reduces agility. Data warehouses, by contrast, are optimized for structured query workloads but can be rigid when data ownership needs to shift to domain teams. The data mesh architecture breaks the architecture into smaller, domain-oriented components, allowing data engineers and domain teams to manage their own datasets and build data products that other teams can access. This approach aligns with best practices for complex and larger data architectures that require both agility and data ownership. The data mesh architecture is recommended precisely for organizations that have outgrown the monolithic data lake model and need a more scalable, domain-oriented alternative.
- The template supports a three-step user journey. The page is structured to guide visitors through a natural sequence: Deploy Node, which is represented by the calculator and the free trial call to action; Process Data, which is demonstrated by the architecture diagram and the cost comparison table; and a reward state where the visitor sees their projected savings and downloads the whitepaper or starts their trial. This sequence mirrors the decentralized systems guide pattern and keeps the visitor oriented at every step.
- Decentralization improves data accessibility and organizational efficiency. Decentralized data management reduces bottlenecks created by centralized data architectures by allowing domain teams to manage their own data products and grant access to consumers through well-defined interfaces. Teams can grant access to specific data products without routing every request through a central data engineering team, which speeds up delivery and reduces coordination overhead across multiple projects. Decentralization allows for more agile and scalable data architectures by breaking down data management into domain-oriented components. A decentralized approach to data management is becoming increasingly important due to regulatory requirements for data ownership, and this template gives platform teams a credible way to communicate that value to enterprise buyers.
- Data integration tools are central to the mesh's operational story. Data integration tools facilitate the combination of data from different sources into a unified view. They support real-time data synchronization between systems, automate data transformation and pipeline orchestration, provide features for data quality management and governance, and enhance the discoverability and accessibility of data across an organization. The template's architecture diagram section is designed to show how these integration capabilities work across distributed data nodes, making the technical story legible to both platform engineers and business stakeholders.
- The importance of data ownership in regulated industries. Data ownership is a mandatory requirement for many regulatory institutions, emphasizing the importance of data governance at every level of the service management stack. Organizations adopting decentralized IT service management can better align their data practices with business needs and regulatory requirements simultaneously. A decentralized approach to data management is becoming essential for any organization operating in a regulated environment. The template's case study cards and cost comparison table are structured to support both the technical and compliance arguments that enterprise buyers need to make internally.
- Artificial intelligence and machine learning capabilities in the broader ecosystem. While the template itself is focused on the calculator and the mesh visualization, the platforms it is designed to market often operate alongside artificial intelligence and machine learning pipelines. Teams using decentralized service management platforms frequently integrate with systems that use deep learning for anomaly detection, natural language processing for ticket classification and routing, and machine learning models for predictive incident management. Natural language processing can be used to parse incoming tickets and route them to the correct node without human intervention, which accelerates resolution times and reduces the effort required from ITSM agents. Machine learning and deep learning models can analyze historical ticket data to surface patterns that help teams prioritize incidents and improve service level agreement compliance over time. AI agents are increasingly used in service management workflows to handle routine requests, classify incidents, and generate responses without escalating to human agents, and the template's architecture is designed to present a platform that can support this kind of intelligent automation. Speech recognition tools can be used to capture incident reports from voice channels, while information retrieval systems help agents locate relevant knowledge base articles quickly. These capabilities are relevant context for the enterprise buyers this template targets.
- Context for platform teams building on this template. Teams adapting this template for production will need to wire the calculator inputs to a real computation layer and connect the node graph visualization to live data. The template provides the interaction model, the layout, the visual language, and the conversion architecture. The underlying computation and data connections are the responsibility of the development team implementing the platform. Code for the Canvas-based node graph and the real-time calculator is structured as client-side components, while the static sections are structured for server-side delivery. Platform engineers working with this template will find the component separation follows standard software development practices for performance-sensitive web applications, and the architecture is straightforward to extend across multiple projects or client tenants.
- Additional terms and ecosystem context for technical buyers. Teams in the decentralized enterprise software space often work across a wide range of infrastructure and tooling decisions. The importance of cloud computing in distributed systems cannot be overstated: cloud computing provides the elastic infrastructure that makes self-healing mesh architectures practical at scale. Data analytics capabilities are built into the Resolve platform's value proposition, as the real-time metrics and savings outputs the calculator generates are a form of live data analytics applied to the visitor's own operational context. Performance analysis of decentralized systems requires output metrics covering return on investment and profitability, throughput and efficiency, and uptime and reliability, all of which are represented in the calculator's output panel. The template's design system and section architecture are consistent with enterprise architecture best practices for product-led growth software, and the split-screen layout reflects the dual-audience nature of the platform, appealing simultaneously to technical evaluators and business decision-makers. Digital transformation initiatives often stall because the business case is hard to quantify. This template is designed to make that quantification immediate, visual, and personal. Project management of the template's implementation is straightforward because the section order maps directly to the conversion funnel, with no ambiguity about which section serves which purpose. Business strategy for platforms in this space increasingly depends on demonstrating cost displacement rather than feature parity, and the calculator-first approach is the most direct expression of that strategy. The template also creates space for business analysis by providing a structured cost comparison that buyers can use to document their evaluation and share it with stakeholders. Platforms using Oracle Cloud infrastructure can note compatibility where relevant. The semantic web principles of discoverability and addressability that underlie data mesh architecture also apply to how data products are indexed and accessed across the mesh. Smart cities and cyber physical systems are among the emerging application domains where distributed data mesh architecture is gaining adoption, as the peer-to-peer node model maps naturally to the distributed sensor and device networks these environments require. Wireless networks supporting IoT and edge computing deployments benefit from the same mesh routing principles that underlie the Resolve platform's service management model. The template's visual system and interaction design are well suited to these adjacent markets.
- Content team guidance for keyword-sensitive copy. The template overview and copy are structured to support natural use of terms related to data mesh, data products, distributed data, service management, governance, and architecture. Teams customizing the copy for specific market segments should maintain the balance between technical specificity and readability that the template establishes. Overloading any single section with technical terminology reduces the persuasive impact on business buyers who control budget decisions. The best practices for this template are to let the calculator and the visualizations carry the technical credibility, and to let the copy carry the narrative of what the platform makes possible for the people using it.
Theme
Dynamic Motion
Creative direction
Calculator/Tool First
Color system
Carbon Fiber
Direction
Freemium/Trial
Page Sections
Live Cost and Node Calculator
Animated Peer-to-peer Mesh Visualization
Side-by-side Cost Comparison Table
Three Before-and-after Case Study Cards
Progressive Two-screen Sign-up Flow
Horizontal Parallax Section Transitions
Related questions
What is domain-oriented decentralized data ownership?
How do you implement data mesh architecture?
Who is this landing page template designed for?
What does the progressive sign-up form collect?
Can this template support a multi-tenant managed service provider deployment?


