Public Transportation Reviews & Social Proof Website Template
Route is a single-column landing page template built for city transit decision-makers. It leads with an animated SVG transit map, cascades key performance metrics in large numerals, and drives visitors toward a fleet solutions page. The Stats-First Impact layout compresses complex infrastructure data into a fast, scroll-friendly evidence case that earns the click before asking for it.
by Rocket studio
Quick summary
Route is a high-performance city transit landing page template designed for bus rapid transit agencies and municipal fleet teams. It opens with a live-style animated network map, delivers fleet metrics before context, and builds a compounding evidence case that moves transit directors, council members, and planning organizations toward a clear next step.
Who this template is for
Route is built for professionals who make large-scale transit investment decisions. The template speaks the language of operational data, cost justification, and ridership scale rather than general marketing.
- Transit directors evaluating fleet modernization and dispatch efficiency
- City council members weighing dedicated bus lane ballot measures and cost-per-mile comparisons
- Metropolitan planning organizations comparing bus rapid transit proposals against light rail investments
What problem this template solves
Transit agencies struggle to communicate complex infrastructure value quickly. Dense reports lose decision-makers before the argument lands. Route solves this by front-loading the numbers that matter most, then providing just enough supporting context to build confidence.
- Key performance metrics like fleet uptime and on-time performance get buried in long documents instead of leading the conversation
- Decision-makers arrive at solutions pages without enough evidence to act, stalling the sales cycle
- Standard landing page templates lack the data-forward structure that transit and municipal audiences expect
What you get with this template
Route delivers a fully structured, single-column flow landing page with every section mapped to a specific decision-maker need. The template is ready to customize with your agency's metrics, branding, and call-to-action destinations.
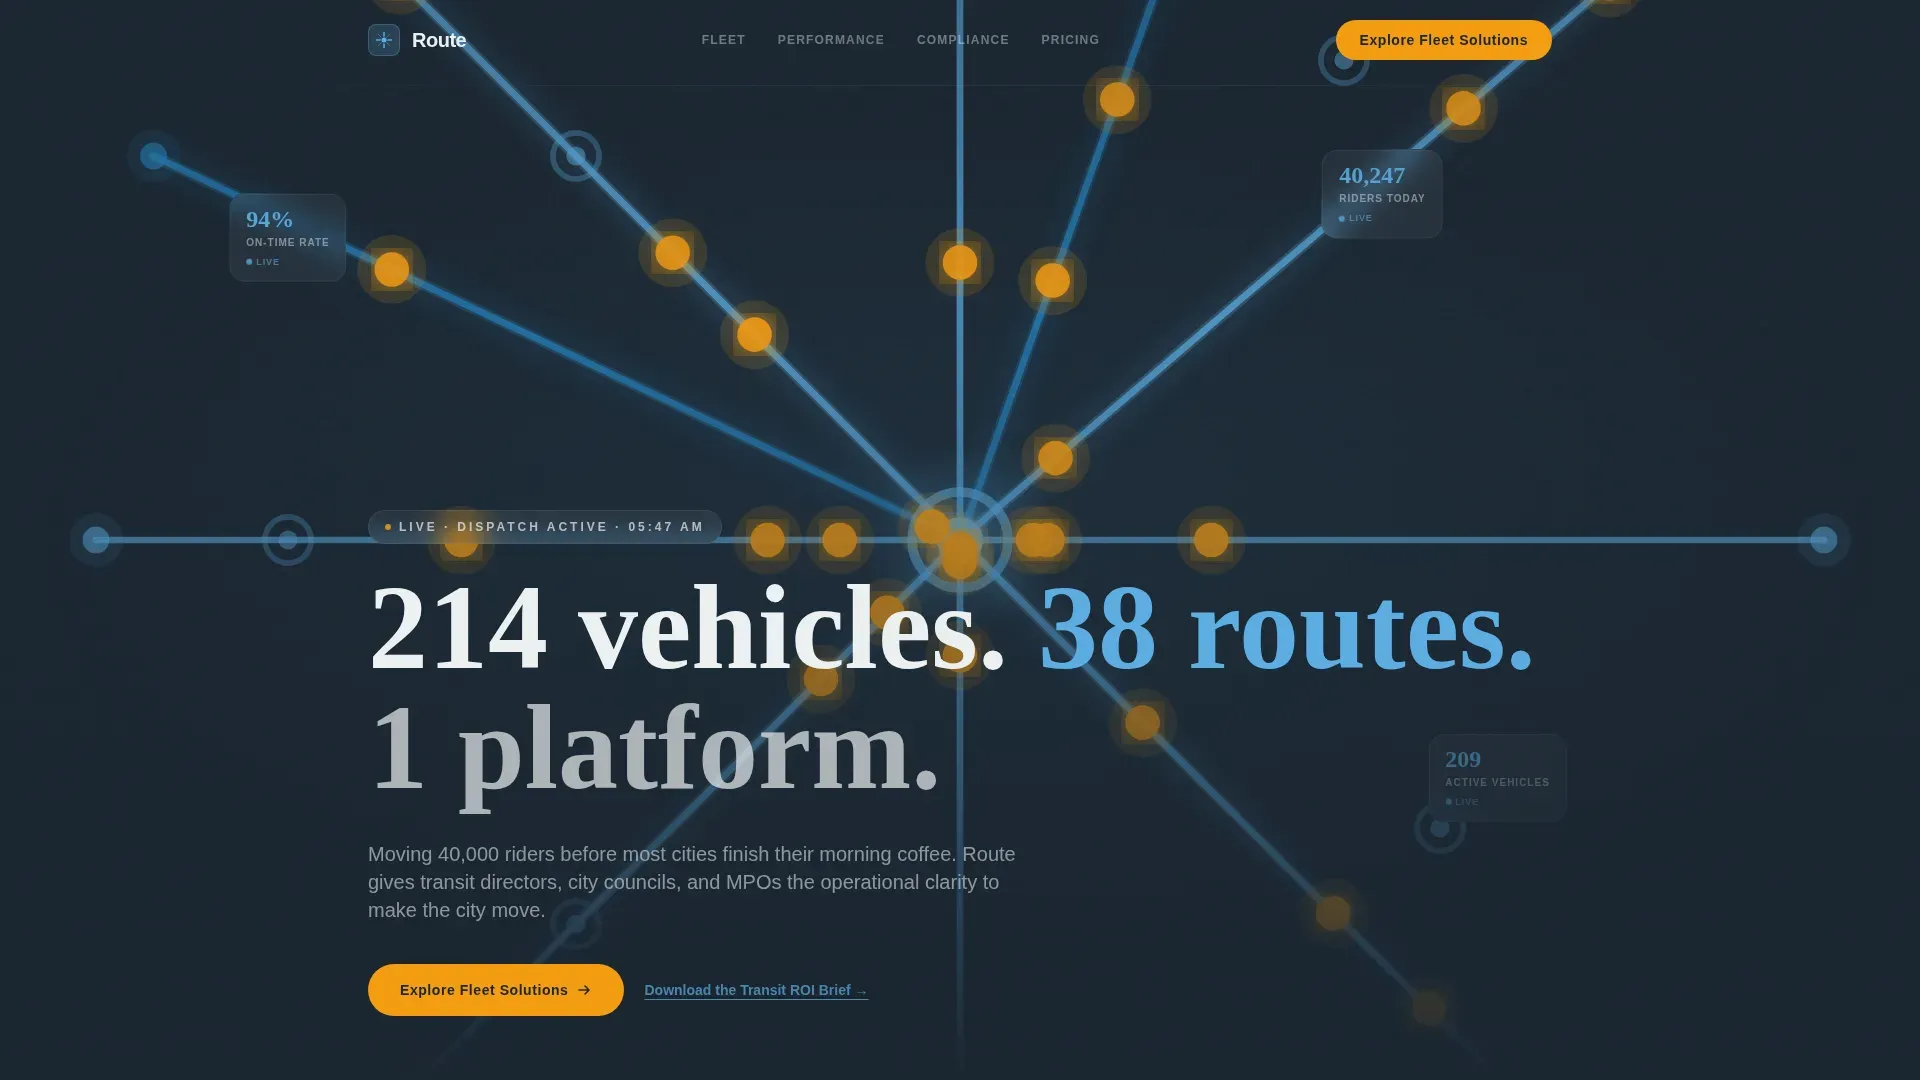
- An animated SVG hero section with pulsing bus route lines, live-style ridership counters, and a primary call-to-action button
- A Stats Cascade section, a Bus Rapid Transit versus Light Rail comparison table, a ridership growth and accessibility benchmarks section, and an agency social proof block with email capture
- A Corporate Precision visual system using deep transit slate, sky blue, signal white, and route-line amber across every section
Feature list
Route packages six purpose-built capabilities into one cohesive landing page template. Each feature serves the Stats-First Impact creative direction described in the brief.
Animated SVG Transit Map Hero
The header fills the entire viewport with a stylized dark-slate route map. Sky-blue route lines radiate from a central hub. Animated dots represent buses moving along corridors, and live-style ridership counters tick upward at major transfer stations. A single headline stat fades in: "214 vehicles. 38 routes. 1 platform."
Stats Cascade with Scroll Reveals
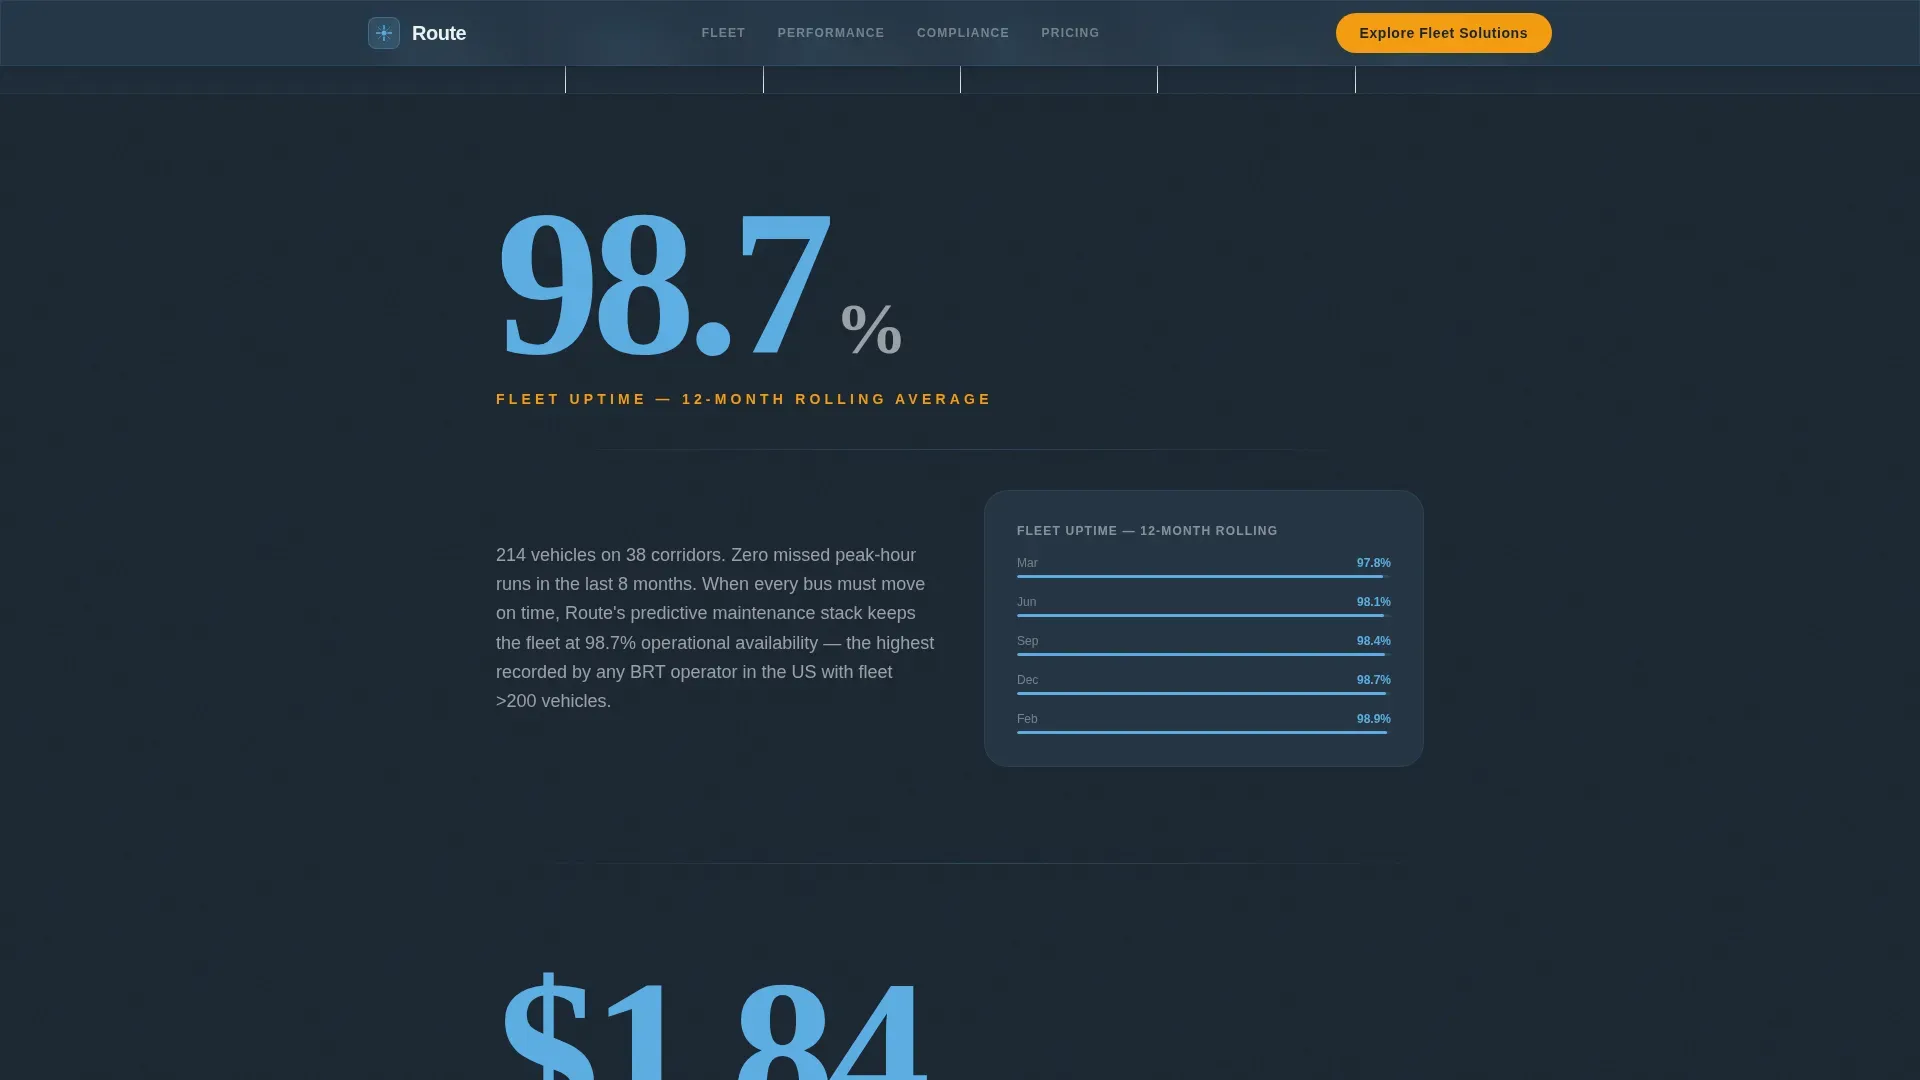
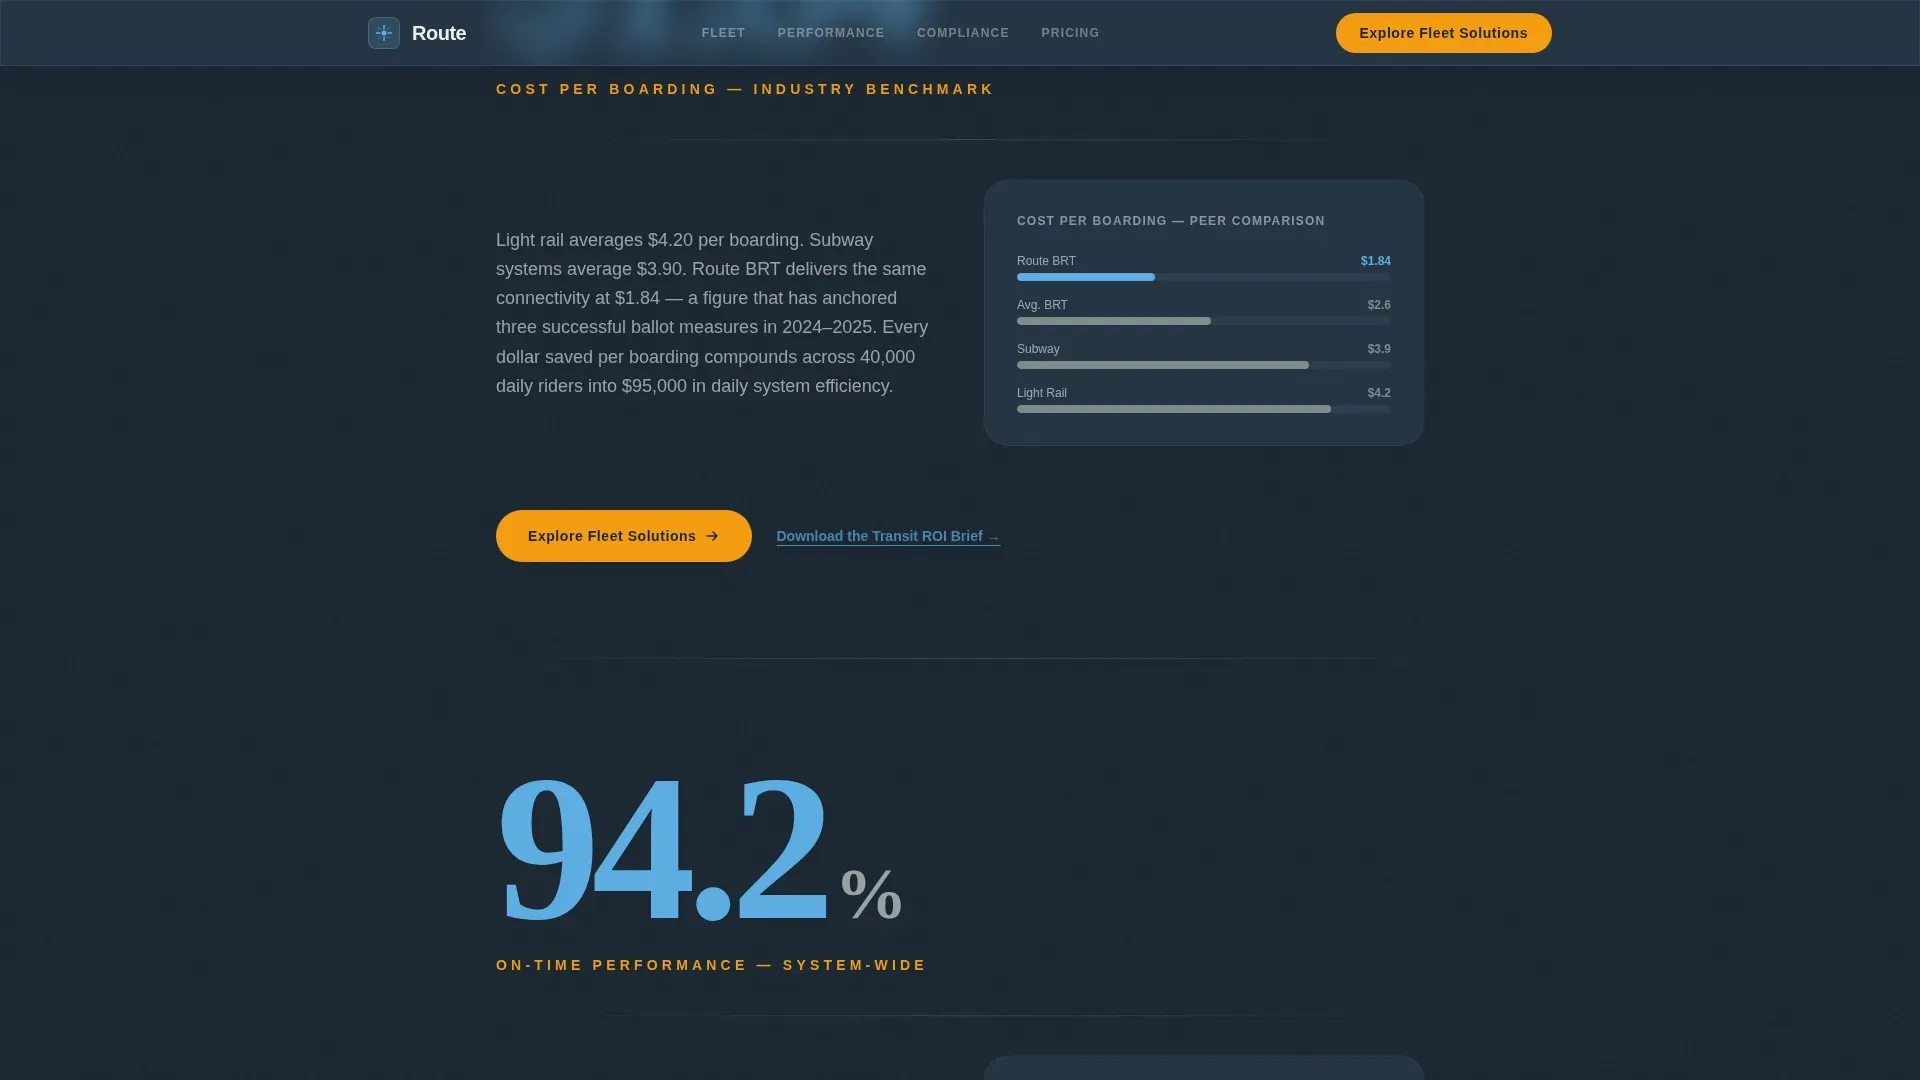
Each scroll step surfaces a new performance metric in large editorial numerals before its explanation appears. Fleet uptime, cost-per-boarding, and on-time performance land first as isolated numbers. Supporting paragraphs and minimal diagrams follow, creating a punch-then-breathe reading rhythm that builds an evidence case across the full page.
Bus Rapid Transit versus. Light Rail Comparison Table
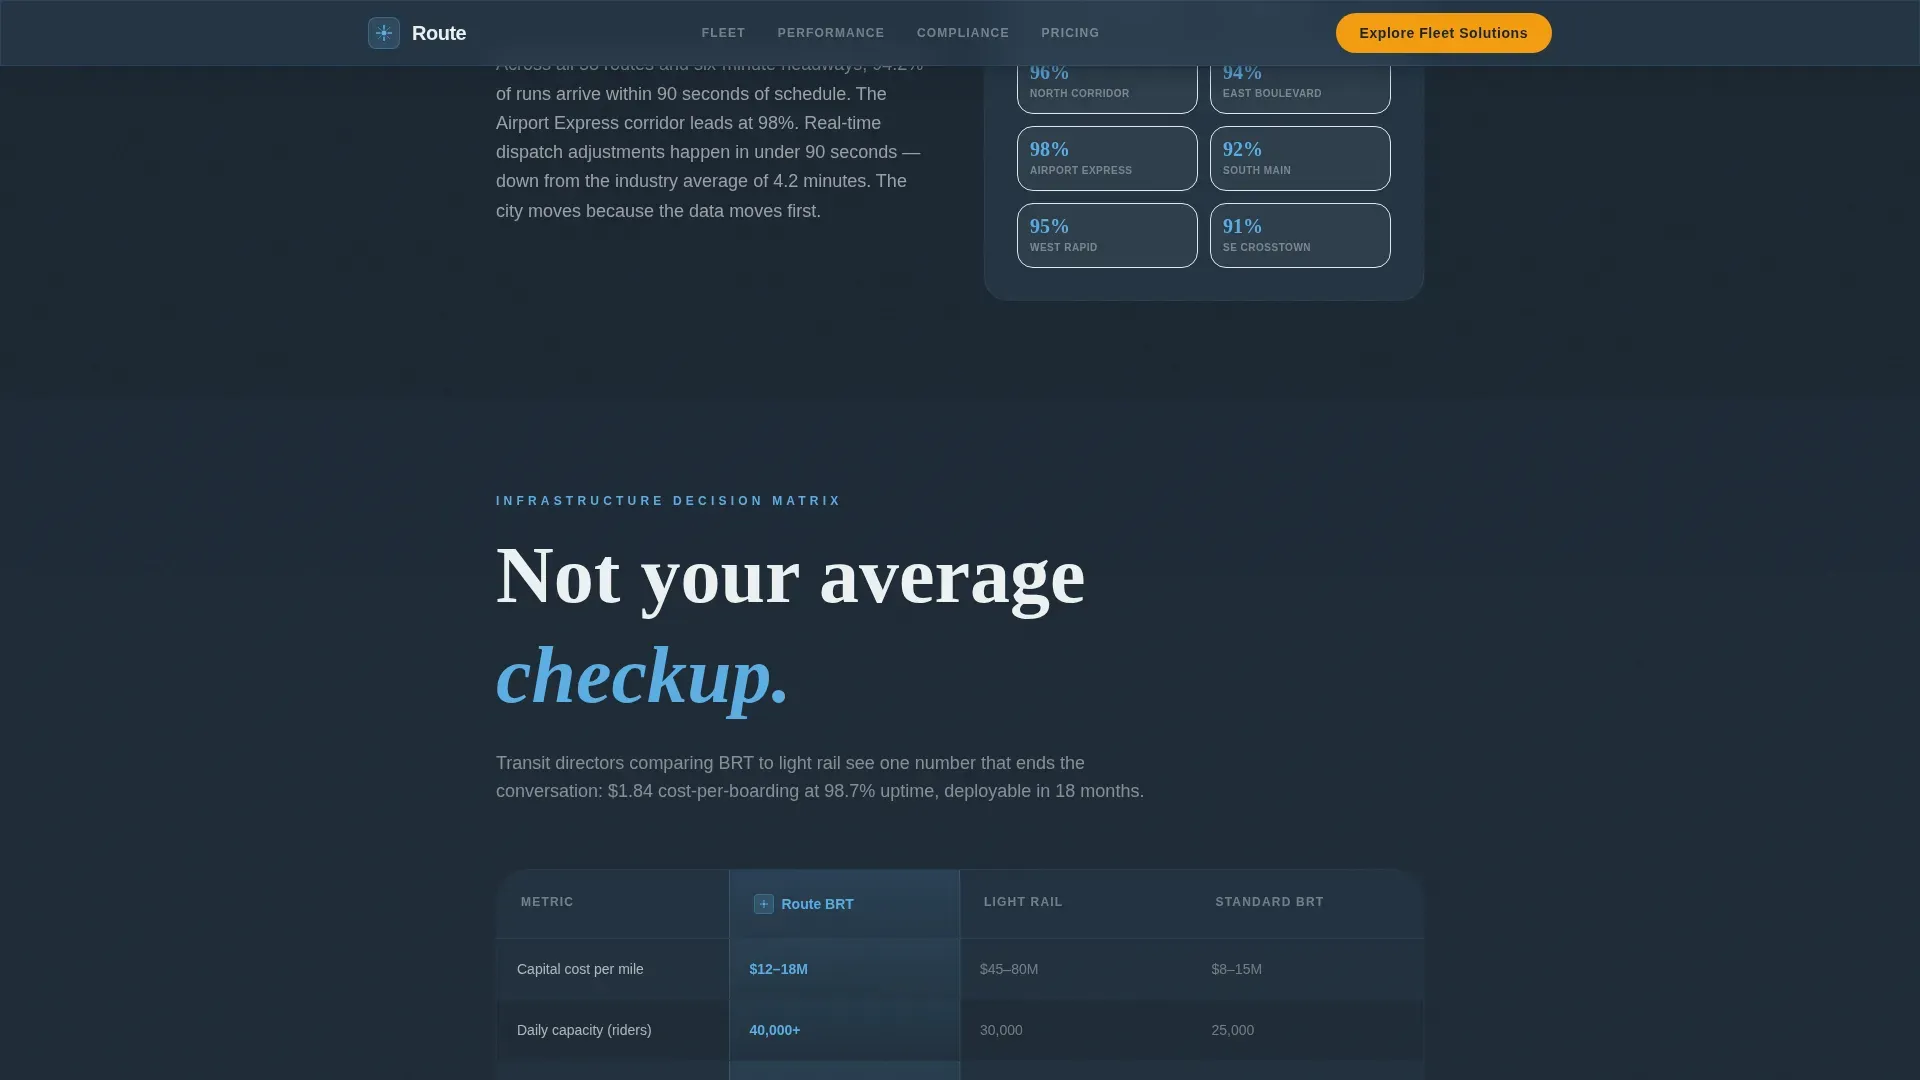
A dedicated section presents a structured comparison table for decision-makers evaluating BRT against light rail investment. The Route platform columns are highlighted to help transit directors and planning organizations identify cost-per-mile and performance advantages at a glance.
Ridership Growth and Accessibility Benchmarks
This section pairs a visual ridership growth curve with ADA compliance benchmark data. The layout translates long-form performance reports into a scannable, diagram-led format that council members and agency staff can reference quickly.
Agency Social Proof and ROI Brief Capture
A logo wall of city and agency clients anchors the social proof block. Below it, a secondary call-to-action captures a work email in exchange for the Transit ROI Brief, targeting visitors who need more evidence before committing to the primary click-through.
Repeating Amber call to action Architecture
The primary "Explore Fleet Solutions" button in route-line amber on deep slate appears first beneath the hero map and repeats after every third stat block. This rhythm reinforces the destination without overwhelming the data-forward content between each appearance.
Page sections overview
| Section | Purpose |
|---|---|
| Hero Map | Full-viewport animated SVG transit map with pulsing bus dots, live-style ridership counters, and primary call-to-action |
| Stats Cascade | Sequential metric reveals showing fleet uptime, cost-per-boarding, and on-time performance with supporting diagrams |
| BRT versus. Rail Table | Side-by-side comparison of bus rapid transit and light rail across cost, performance, and scalability dimensions |
| Ridership and ADA | Visual growth curve and accessibility benchmarks for decision-maker reference |
| Social Proof Block | Agency and city logo wall paired with email capture for the Transit ROI Brief |
| Footer | Single-row linear footer with navigation and contact information |
Design & branding system
Route follows a Corporate Precision theme that feels like a dispatch center at early morning. The palette, typography, and animation choices all reinforce operational authority and data clarity.
- Color system uses deep transit slate (#2C3E50) and operational charcoal (#1B2631) as backgrounds, open-sky blue (#5DADE2) for route lines and highlights, signal white (#ECF0F1) for text and data containers, and route-line amber (#F39C12) on hover states, active KPIs, and call-to-action buttons
- Typography pairs Plus Jakarta Sans for data-forward labels and interface text with Fraunces for large editorial numerals in the Stats Cascade sections
- Animations run at high intensity, including the SVG map counter tick-up, scroll-triggered reveals, and a marquee element, while interactivity stays at a measured medium level through hover states and the email capture form
Mobile & speed optimization
Route is built desktop-first to serve transit directors working at operations workstations, while remaining fully responsive for council members reviewing the page on mobile devices.
- Server components handle static content sections for fast initial load, while client-side components manage the animated SVG map and counter interactions
- The single-column flow layout adapts cleanly to smaller screens without restructuring the data hierarchy or hiding key performance metrics
- Scroll-reveal animations and counter tick-ups are scoped to client components only, keeping static rendering efficient for the majority of page content
How this template helps you convert
Route is built around one conversion goal: moving qualified transit decision-makers from the landing page to the fleet solutions page. Every layout decision supports that path.
- The Stats-First Impact structure earns trust before asking for a click. Metrics land large and alone, then expand into context, so visitors absorb scale and credibility through the natural reading flow rather than a pitch.
- The repeating amber call to action after every third stat block keeps the primary action visible without disrupting the evidence rhythm, and the secondary email capture for the Transit ROI Brief gives hesitant visitors a lower-commitment entry point.
Other information about this template
Route is categorized under Government and Public templates, within the Public Transportation subcategory and the City Bus and Transit niche. It is localized for United States audiences using US dollars and imperial measurements throughout.
- The template is designed as a single-column flow landing page, not a multi-page website
- Animation complexity is set to high for the SVG map and counter components, making this template best suited for agencies comfortable with a visually intensive presentation
- The footer follows a Pattern 1 Linear Single-Row layout, keeping the bottom of the page clean and uncluttered
- Device priority is desktop-first, reflecting the workstation environment of transit directors and operations staff
Theme
Corporate Precision
Creative direction
Stats-First Impact
Color system
Slate & Sky
Style
Single Column Flow
Direction
Click-Through
Page Sections
Animated SVG Transit Map Hero
Stats Cascade with Scroll Reveals
BRT Versus. Light Rail Comparison Table
Ridership Growth and ADA Benchmarks Section
Agency Social Proof and Email Capture
Repeating Amber Call to Action Architecture
Related questions
Who is this landing page template designed for?
Can I update the performance metrics and statistics in this template?
What level of technical skill is needed to use this template?
Does this template support two conversion paths?
Is this template suitable for a Bus Rapid Transit proposal presentation?