Soil & Crop Analytics Landing Page Template
Tilth is a precision soil and crop analytics landing page template built for agritech platforms targeting agronomists, cooperative managers, and specialty crop consultants. It opens with an animated metrics dashboard, moves through a clickable soil heatmap gallery with expandable diagnostic panels, and closes with a three-step lead generation form, all styled in a restrained Japanese Zen palette.
by Rocket studio
Quick summary
Tilth is a gallery-and-detail landing page template for soil intelligence and crop analytics platforms. It leads with live-counting performance metrics, flows through an interactive heatmap gallery with three-panel diagnostic detail views, and converts visitors through a progressive three-step form. The design uses deliberate negative space and a minimal Zen color palette to give the data room to speak.
Who this template is for
This template is built for agritech businesses and soil analytics platforms that sell to professional land managers. It works best when the product is data-driven and the buyer needs evidence before committing.
- Agronomists managing hundreds to thousands of hectares who need field-level soil diagnostics
- Cooperative managers who must justify input spending with clear field-by-field performance data
- Specialty crop consultants advising vineyards, orchards, and perennial crops on micronutrient issues
What problem this template solves
Most agritech landing pages lead with photography of equipment or generic crop fields. That approach fails professional buyers who want data, not imagery. Agronomists and cooperative managers arrive already skeptical and need proof layered in the right order before they will share contact details.
- Generic hero sections waste trust-building space on visuals that don't communicate platform capability
- Buried call-to-action forms appear before credibility is established, reducing qualified lead capture
- Flat product descriptions can't convey the diagnostic depth that differentiates a soil analytics platform
What you get with this template
You get a fully structured, single-page layout that moves from aggregate proof to individual field story to conversion. Every section is purpose-built for a B2B agritech audience that reads carefully and decides slowly.
- An animated metrics header with three count-up statistics and a monospaced tagline line
- An interactive soil heatmap gallery with clickable tiles that open a three-panel diagnostic detail view
- A three-step progressive lead generation form and a secondary gated benchmark report download path
Feature list
This template includes purpose-built components drawn directly from the platform's conversion brief. Each one earns its place in the scroll sequence.
Animated Count-Up Metrics Header
Three oversized performance statistics animate upward from zero on page load, rendered against a sand-white field with no hero photography. The numbers, yield increase, fields analyzed, and forecast accuracy, are the first thing a visitor reads, establishing platform credibility before any scroll.
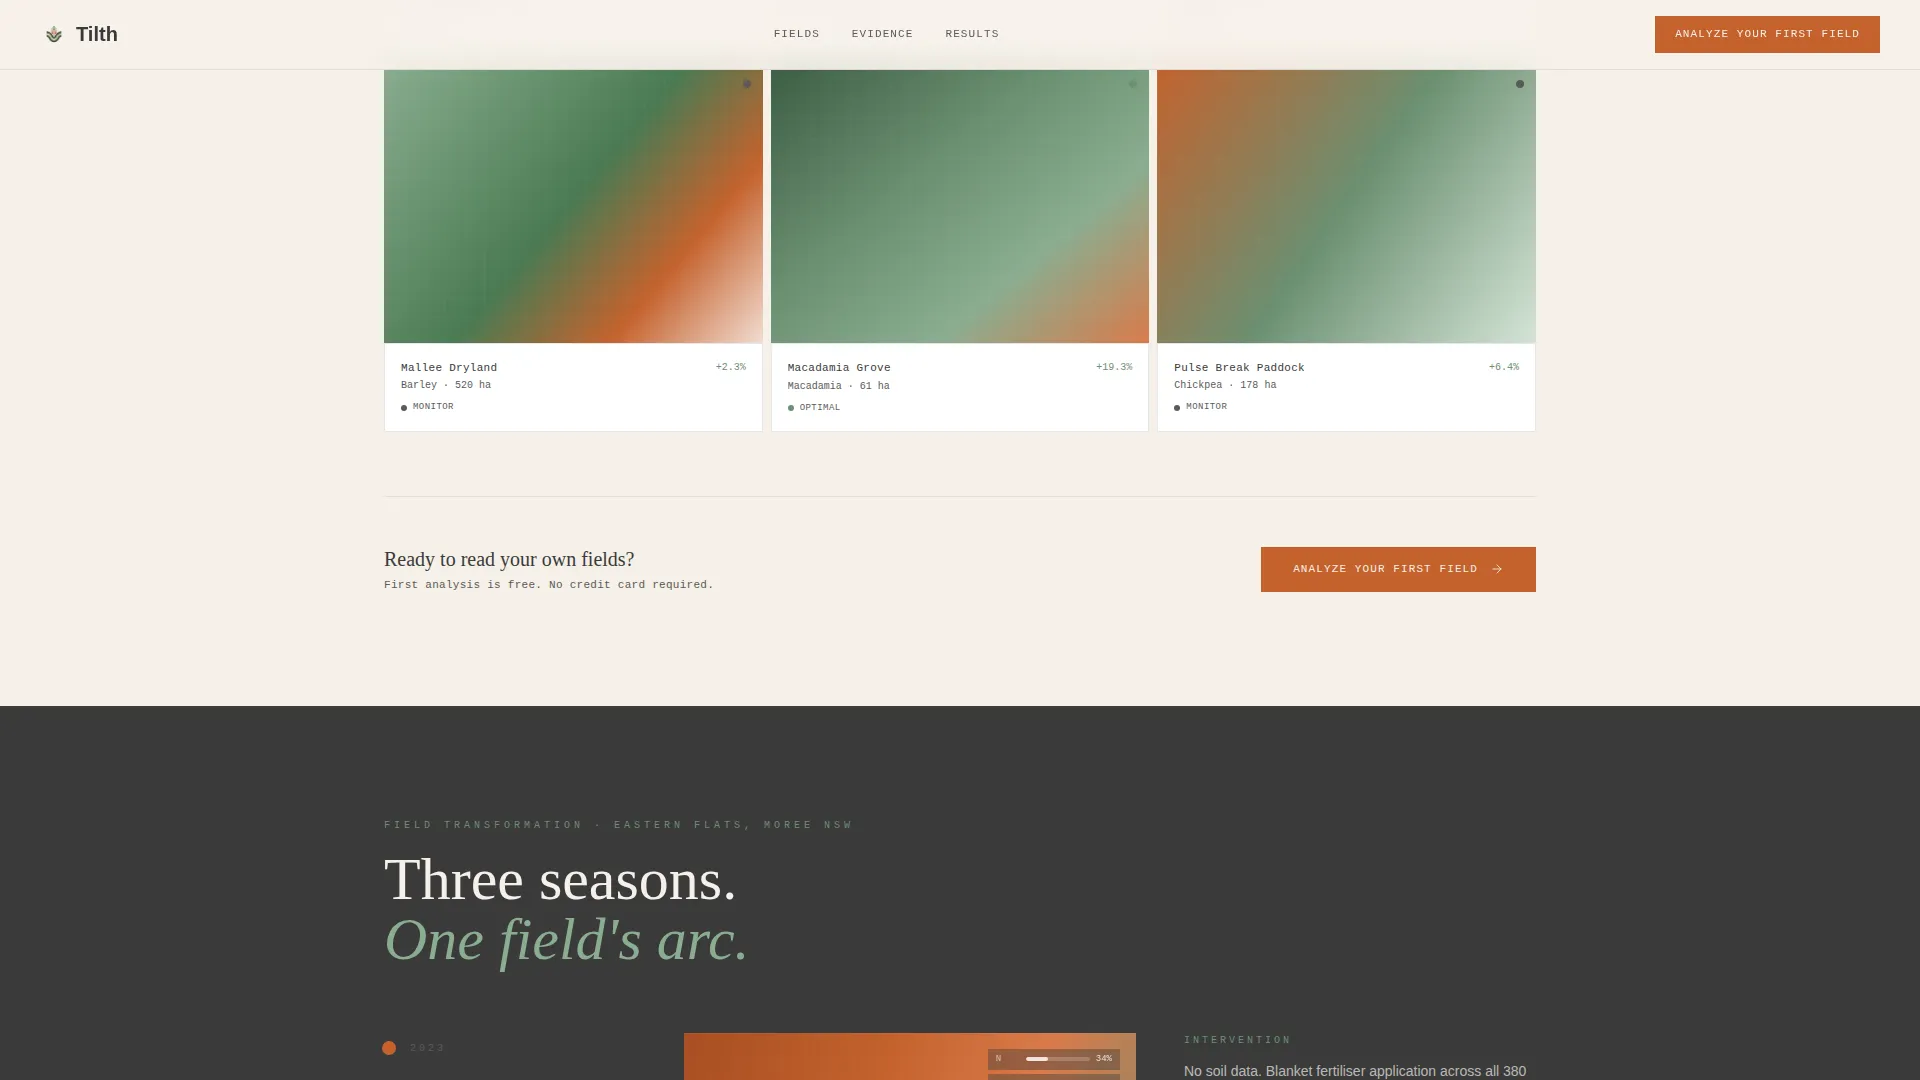
Clickable Soil Heatmap Gallery
A grid of soil health heatmap thumbnails sits below the header. Each tile is rendered in the template's Zen palette and opens a full three-panel detail view on click, showing raw sensor data on the left, AI interpretation in the center, and the recommended field action on the right.
Three-Season Field Transformation Story
A dedicated section follows a single field across three growing seasons, building a before-and-after data narrative. This moves the visitor from platform-wide statistics to one field's measurable arc, making precision agriculture outcomes feel concrete and repeatable.
Progressive Three-Step Lead Form
The primary call-to-action form collects crop type via dropdown, total managed hectares via range slider, and email address as the final step. Each input appears on its own card, sequencing like soil horizons to reduce friction and improve form completion.
Gated Benchmark Report Download
A secondary conversion path offers a downloadable soil health benchmark report behind a single email field. This catches high-intent visitors who want supporting data before entering a sales conversation.
Agronomist Testimonial Section
A social proof section features testimonials from named agronomists with specific yield figures and field size context. Concrete numbers anchored to real field scenarios give professional buyers the peer validation they need to act.
Page sections overview
| Section | Purpose |
|---|---|
| Metrics Header Dashboard | Establishes platform credibility with animated count-up statistics |
| Monospaced Tagline Line | Delivers the core value statement beneath the metrics in a single line |
| Soil Heatmap Gallery | Displays field thumbnails that expand into three-panel diagnostic detail |
| Three-Panel Diagnostic View | Shows sensor data, AI interpretation, and recommended action per field |
| Field Transformation Story | Narrates a single field's soil health arc across three growing seasons |
| Agronomist Testimonials | Provides social proof with specific yield numbers and field context |
| Three-Step Lead Form | Captures crop type, hectare range, and email through a progressive sequence |
| Benchmark Report Download | Offers a gated data report as a secondary email capture path |
| Single-Row Footer | Closes the page with a minimal linear footer pattern |
Design & branding system
The visual identity follows a Service Utility approach through a Japanese Zen color system. Every design choice is restrained and purposeful, with beauty emerging from the space between elements rather than decorative additions.
- Four-color palette: raked sand warm white (#F5F0E8), wet stone charcoal (#3A3A3A), moss after rain (#6B8F71), and persimmon (#C4622D) reserved for data highlights and interactive states
- Typography pairing: Fraunces serif display for headings and narrative text, JetBrains Mono for all data labels, metric readouts, and the hero tagline
- Layout philosophy built on deliberate negative space, with no stock photography of equipment or fields anywhere on the page
Mobile & speed optimization
The template is designed desktop-first to match how agronomists and cooperative managers typically use analytics platforms, with a responsive layout that adapts cleanly for smaller screens.
- Static content sections use server-side rendering for fast initial load; interactive gallery tiles and the multi-step form use client-side components
- Scroll-reveal animations and gallery panel transitions are scoped to client components to avoid blocking the static page skeleton
- The count-up animation, heatmap renders, and expandable detail panels are all handled as interactive client components
How this template helps you convert
The page is structured so that every scroll delivers another layer of evidence before any commitment is requested. The conversion architecture builds trust in a deliberate sequence that mirrors how professional buyers actually make decisions.
- The animated metrics header front-loads the strongest proof points immediately, so agronomists see performance data before reading a single word of copy
- The gallery-to-detail flow moves visitors from aggregate platform statistics down to a single field's diagnostic story, making the platform's depth personally relevant before the call-to-action appears
- The primary lead form appears only after the third gallery row, when credibility is fully established, reducing drop-off from visitors who were not yet ready
Other information about this template
This template sits within the Agriculture and Environment category, specifically the Agritech and Farm Tech subcategory, with a niche focus on soil and crop analytics. It is a strong match for teams building or repositioning a precision agriculture platform.
- The template is designed for English-language markets using metric measurements, with hectare-based inputs and international grain belt context built into the form design
- The Stats-First Impact creative direction means the page never asks for attention it hasn't already earned through data
- The layout supports localization for different crop regions by swapping the dropdown crop type options and adjusting the heatmap thumbnail set
- The intersection match score for this template within the Soil and Crop Analytics niche is 13, reflecting a high degree of alignment between the design system, conversion direction, and target audience


Theme
Service Utility
Creative direction
Stats-First Impact
Color system
Japanese Zen
Style
Gallery + Detail
Direction
Lead Generation
Page Sections
Animated Count-up Metrics Header
Clickable Soil Heatmap Gallery
Three-season Field Transformation Story
Progressive Three-step Lead Form
Gated Benchmark Report Download
Agronomist Testimonial Section
Related questions
Who is this landing page template designed for?
Does this template include the animated count-up metrics?
How does the interactive gallery section work?
Can the lead generation form be adapted for different crop types?
Is this a single-page or multi-page template?


