Tin Mining Dashboard Landing Page Template
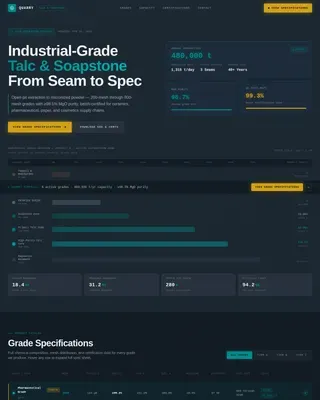
Vein is a dashboard-style landing page template built for a tin mining operation. It leads with live-updating extraction stats, scrollable data grids, and head-to-head benchmark comparisons. Designed for procurement managers, sustainability officers, and commodity traders, the template turns operational transparency into its primary conversion tool, earning trust before asking for any action.
by Rocket studio
Quick summary
Vein is a single-page, data-first template for a tin mining operation. It opens with a certification logo bar and three live-refreshing performance stats. Each scroll increment reveals a new comparison grid, purity, carbon output, worker safety, stacking evidence until the numbers make the case on their own. Two clear calls to action close the loop.
Who this template is for
This template is built for industrial operations that sell on proof, not promises. It suits organizations that need to demonstrate supply chain credibility to demanding, data-literate buyers.
- Procurement managers at circuit board factories evaluating supplier reliability and purity grades
- Sustainability officers auditing conflict-free sourcing chains against recognized industry standards
- Commodity traders comparing spot-price exposure against long-term offtake agreement terms
What problem this template solves
Most mining supplier pages bury their strongest assets, verified numbers, audit scores, benchmark comparisons, behind walls of marketing copy. Serious buyers leave before they find what matters. This template puts the data front and center from the first scroll.
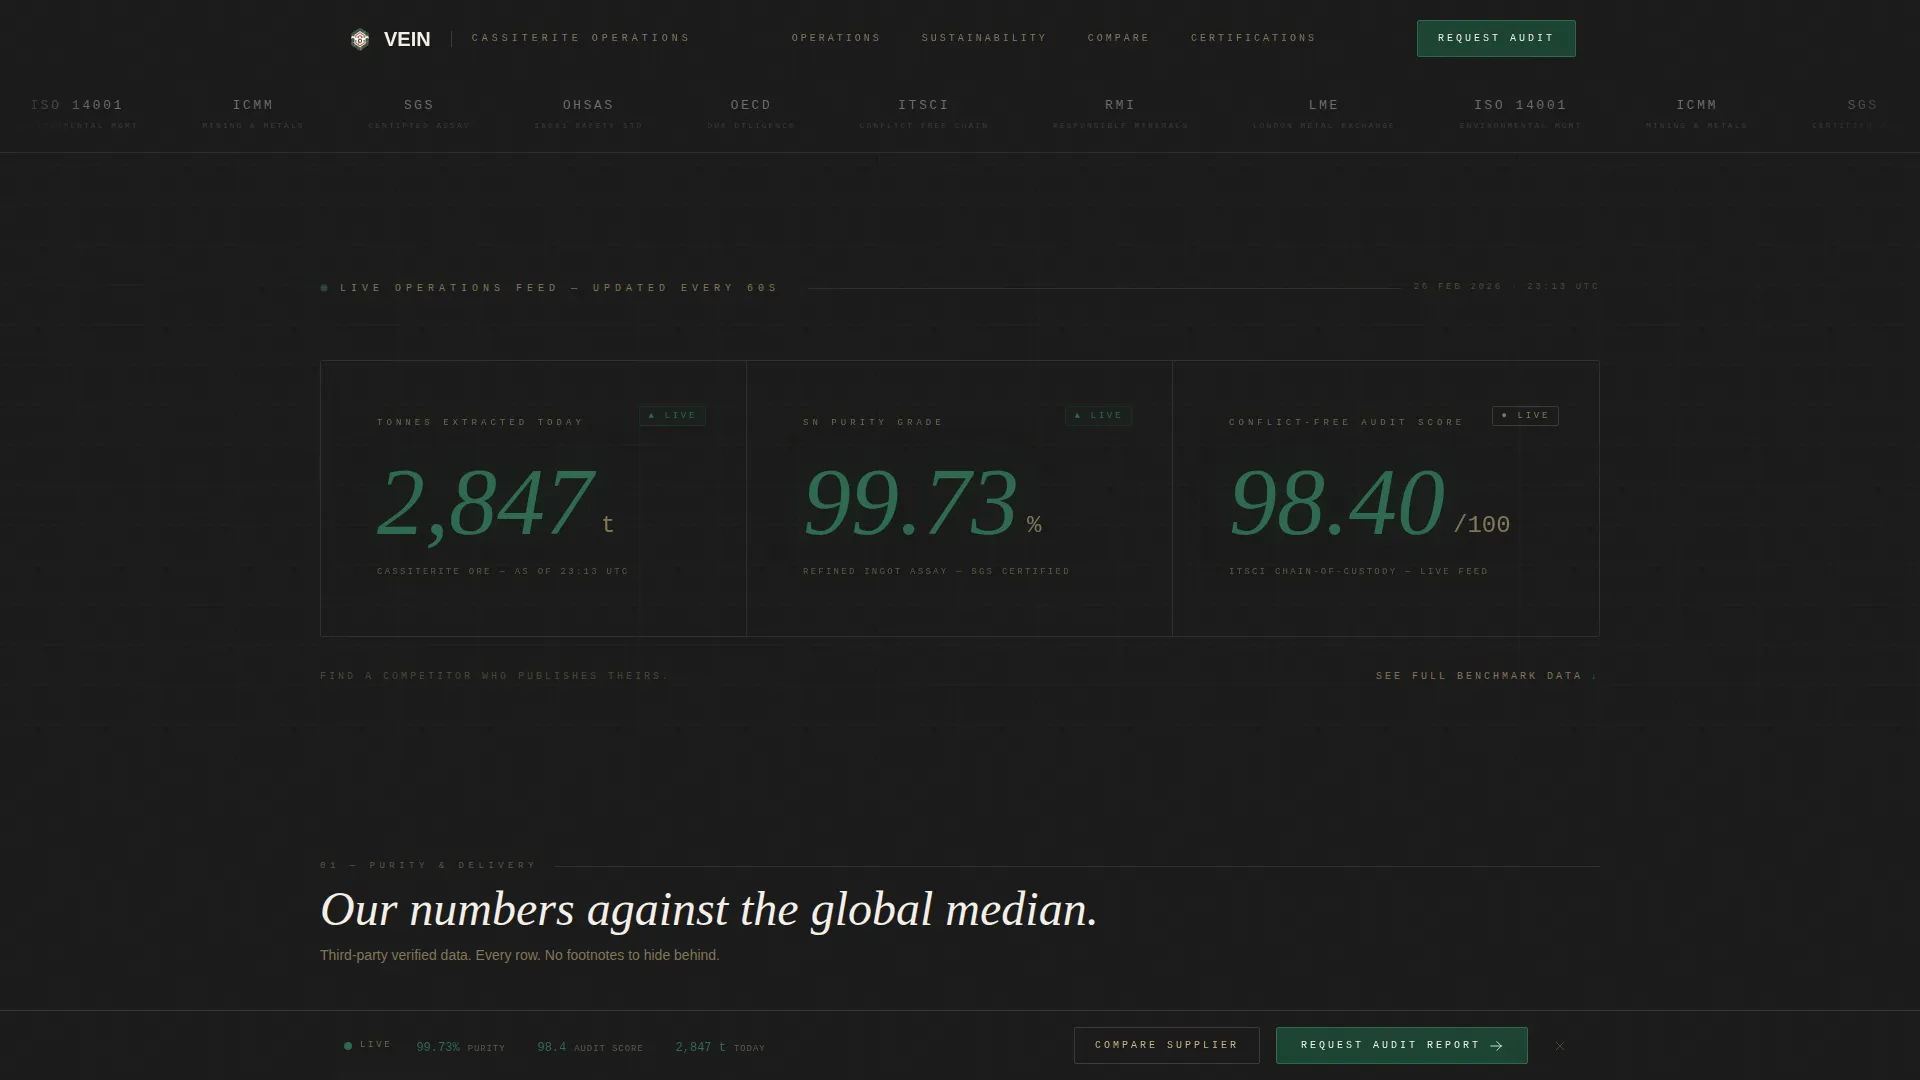
- Visitors see extraction tonnage, purity grade, and conflict-free audit scores before any sales pitch
- Benchmark grids let buyers compare performance against industry medians without requesting a report
- Two conversion paths match different buyer readiness levels, reducing friction for both first-time and return visitors
What you get with this template
You get a fully structured landing page that functions like an operational dashboard. Every section is designed to carry weight on its own, so visitors who scan rather than read still absorb the core case.
- A logo bar header featuring certification and client logos rendered in monochrome river silt against humus black
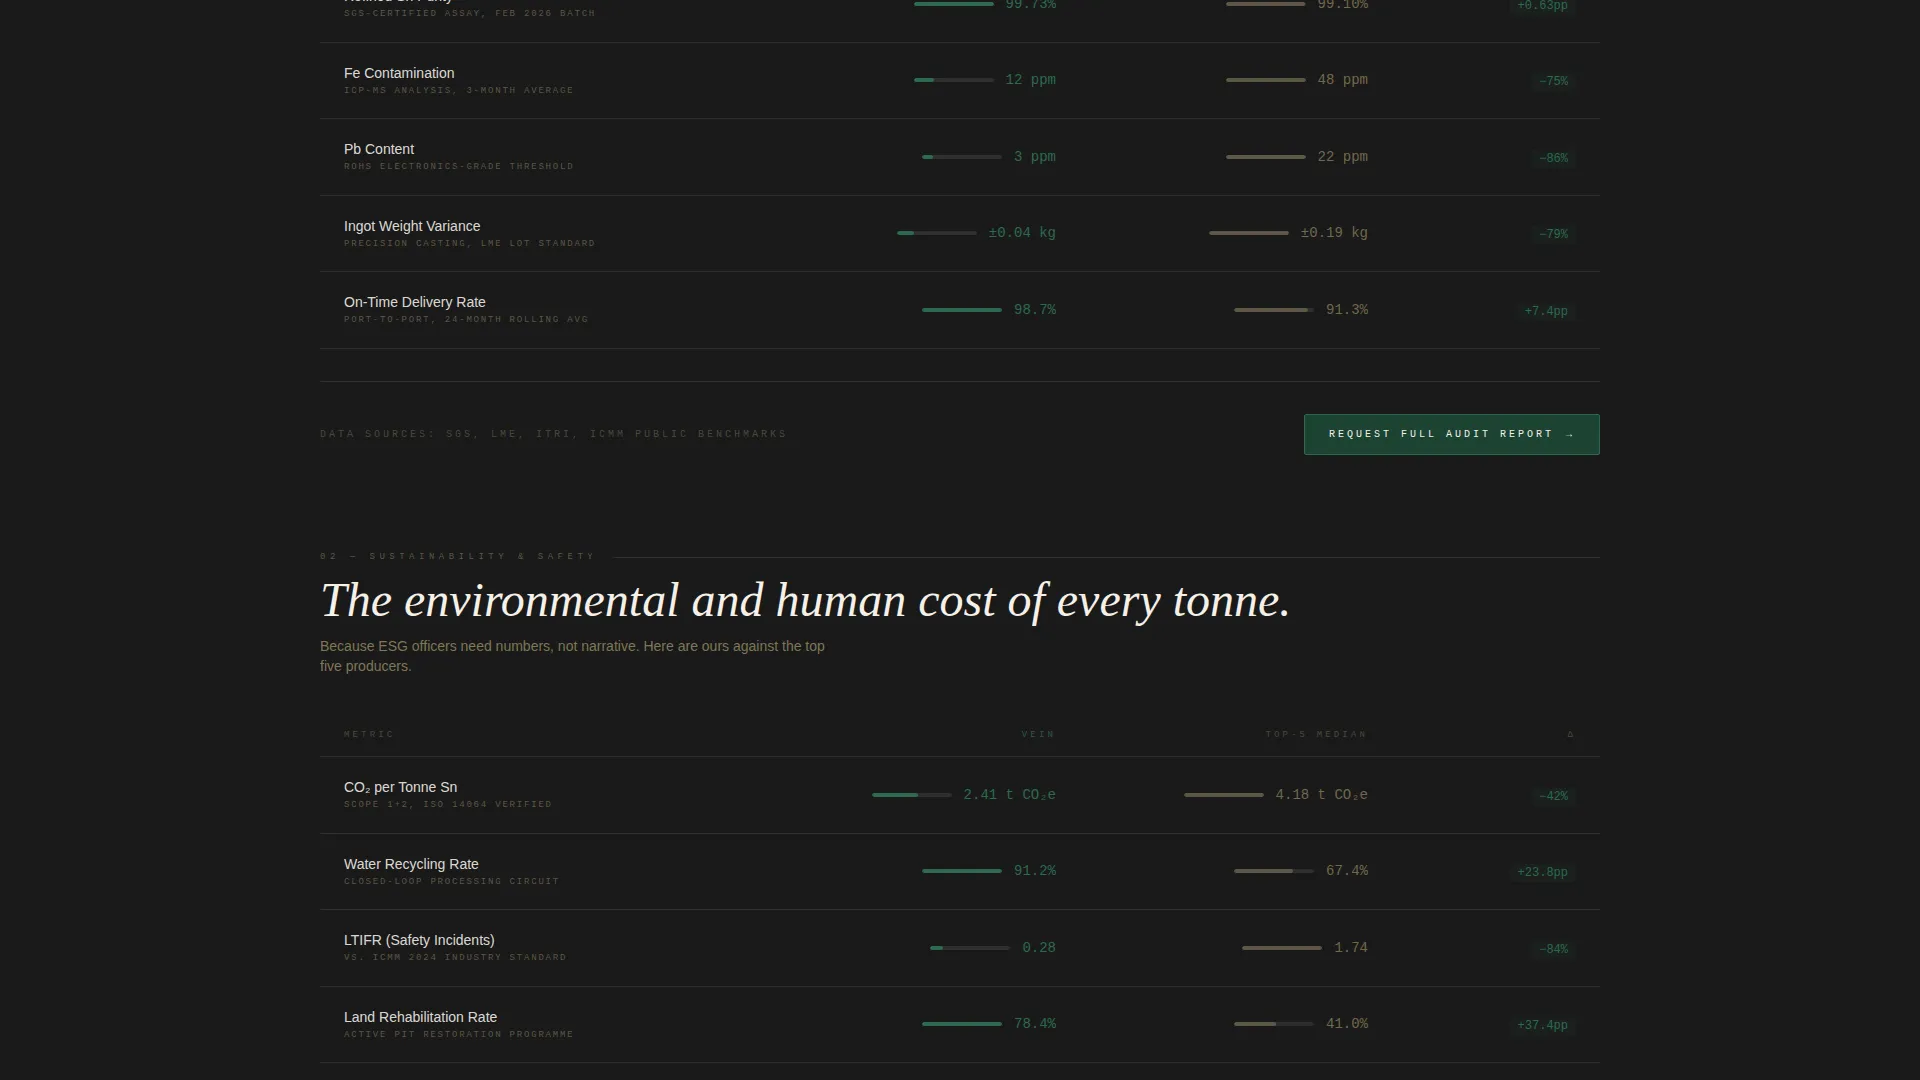
- Multiple animated data grid sections comparing purity, carbon output, and safety metrics against external benchmarks
- A floating call-to-action bar that pins after the third scroll and two distinct conversion forms for different buyer intents
Feature list
This section covers the key functional and design components built into the Vein template.
Live-Updating Header Stats
Three oversized figures refresh like a stock ticker directly below the logo bar. They display today's tonnes extracted, current purity grade, and the latest conflict-free audit score. The numbers are rendered in canopy green and sized to demand attention before any copy is read.
Scrollable Benchmark Data Grids
Each data grid covers one performance dimension: purity percentage versus global median, carbon dioxide per tonne versus the top five producers, and worker safety incident rate versus International Council on Mining and Metals standards. Columns animate left to right as the visitor scrolls, showing the home figure before the competitor column arrives.
Certification Logo Bar
The page opens with a clean horizontal strip of client and certification logos. All logos render in monochrome river silt against a humus black background. The bar communicates vetting and market access without a single word of copy.
Dual Conversion Path Design
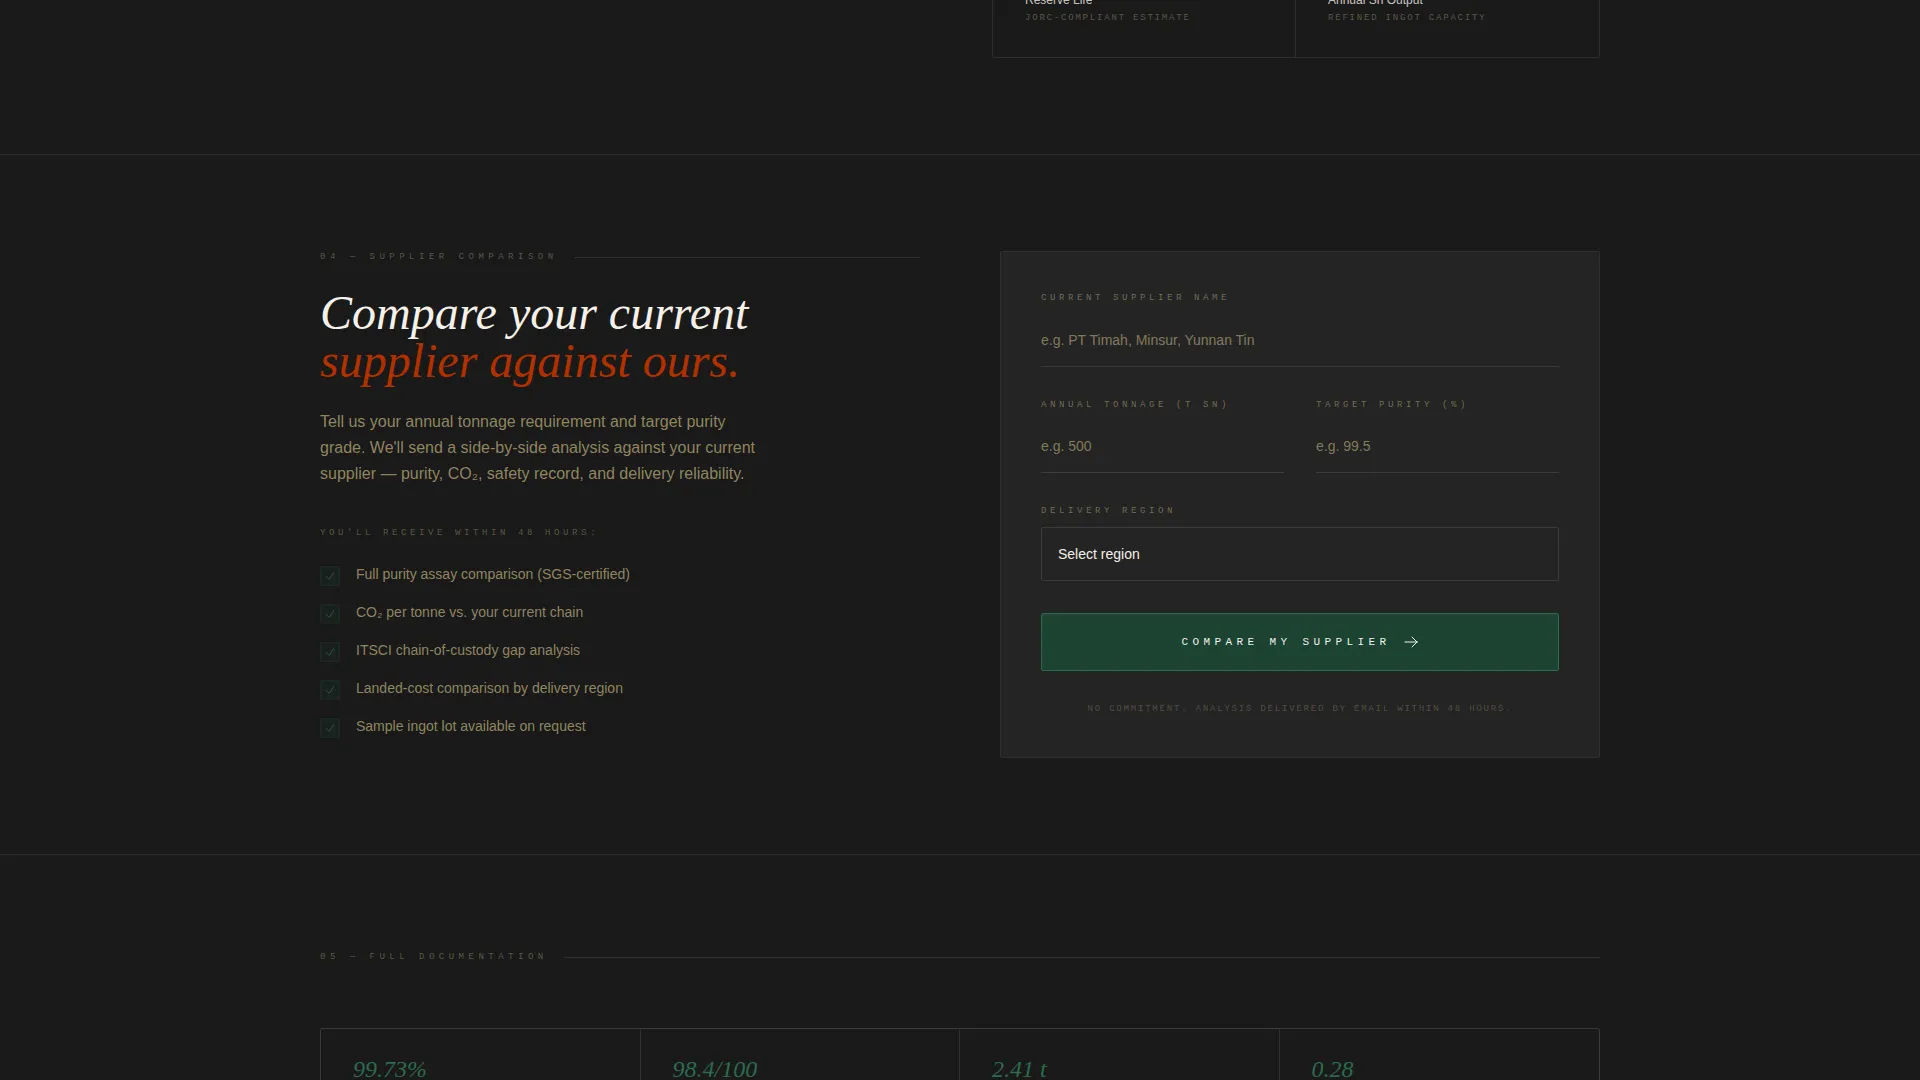
The primary call to action, "Request Our Full Audit Report," appears at the bottom of each data grid and pins as a floating bar after the third scroll. A secondary path, "Compare Your Current Supplier," surfaces a short form asking for supplier name, annual tonnage requirement, target purity grade, and delivery region.
Stats-First Scroll Architecture
The page is structured so every scroll increment reveals another data layer. There is no hero image and no opening narrative. The scroll builds a cumulative case, row by row, using evidence density as the persuasion mechanism.
Rainforest Color System
The template uses a four-color geological palette. Canopy green marks positive data indicators. Laterite red highlights comparison differentials. River silt warms typography and divider lines. Deep humus black grounds the grid containers so numbers read with the authority of a financial data terminal.
Page sections overview
| Section | Purpose |
|---|---|
| Certification Logo Bar | Opens trust signals with client and certification logos in monochrome |
| Live Stat Ticker | Displays today's extraction tonnage, purity grade, and audit score |
| Purity Comparison Grid | Benchmarks cassiterite purity percentage against global median |
| Carbon Output Grid | Compares CO₂ per tonne against top five industry producers |
| Safety Metrics Grid | Measures worker incident rate against recognized mining standards |
| Floating call to action Bar | Pins "Request Our Full Audit Report" after the third scroll |
| Supplier Comparison Form | Collects supplier name, tonnage, purity target, and delivery region |
Design & branding system
The visual identity follows a Civic Service theme expressed through the Rainforest color system. The palette reads like a geological cross-section, compressed layers of jungle canopy, laterite ore, river silt, and deep earth rendered as a single data environment.
- Canopy green (#1B4332) dominates headers and positive data indicators; laterite red (#8B2500) marks comparison differentials and draws the eye to competitive gaps
- River silt (#C9B67E) warms all typography and divider lines, keeping the dense grid layout legible and approachable
- Deep humus black (#1A1A1A) fills grid containers so figures read with the clean authority of a financial data display
Mobile & speed optimization
The template is designed with responsive layout principles so the data grids reflow clearly on smaller screens. Dense tabular content is structured to remain readable at mobile viewport widths without requiring horizontal scrolling.
- Grid columns stack vertically on narrow screens, preserving comparison readability on phones and tablets
- The floating call-to-action bar adapts to mobile placement so the primary conversion prompt stays visible during scroll
How this template helps you convert
Vein treats transparency as the conversion mechanism. It shows performance data unprompted, which builds credibility with buyers who are already skeptical of supplier marketing.
- The live-updating stat ticker and benchmark grids give buyers enough evidence to qualify the supplier before any form is completed, reducing drop-off from skeptical first-time visitors.
- Two distinct calls to action serve buyers at different stages: the audit report request suits buyers ready to verify, while the supplier comparison form draws in buyers still evaluating their current relationship.
Other information about this template
Vein is purpose-built for the tin mining and broader metal and mineral mining sector. It is particularly well-suited for operations that supply cassiterite to smelters, electronics manufacturers, and alloy foundries across multiple regions.
- The template supports conflict-free sourcing narratives by surfacing audit scores and certification logos as primary visual anchors, not footnotes
- The dashboard layout and comparison grid structure make it well suited for operations seeking to attract procurement audiences who evaluate suppliers through data, not brand stories
- The Civic Service theme gives the page the institutional weight of a public-sector data interface, signaling operational seriousness to commodity traders and sustainability auditors alike
Theme
Civic Service
Creative direction
Stats-First Impact
Color system
Rainforest
Style
Dashboard/Data Grid
Direction
Comparison/Versus
Page Sections
Live-updating Header Stats
Animated Benchmark Data Grids
Certification Logo Bar Header
Dual Conversion Path Design
Stats-first Scroll Architecture
Rainforest Color System
Related questions
Who is this landing page template designed for?
Can I customize the data grids with my own figures?
What are the two conversion paths included in this template?
Does the template include the certification logo bar section?
What color palette does this template use?