REIT Management Comparison Table Landing Page Template
The Yield Institutional REIT Management Comparison Table landing page template is built for institutional-grade real estate investment firms. It presents portfolio performance data, sector allocation comparisons, and property-type metrics in a boardroom-quality layout. The page qualifies leads through a gated form and guides institutional investors toward a high-value content download with precision-driven design.
by Rocket studio
Quick summary
This landing page template is designed for institutional real estate investment firms that manage income-producing property portfolios. It combines a commanding hero section with structured comparison tables, a gated lead capture form, and a stats trust band. Every layout decision reflects the analytical expectations of pension fund allocators, family office principals, and board members who measure investment performance in basis points.
Who this template is for
This template is built for REIT management companies and institutional real estate investment firms that need to present performance data with authority and precision. It speaks directly to sophisticated allocators who evaluate assets with the same rigor they apply to any other institutional investment decision.
- Pension fund allocators comparing net operating income and distribution yield across multiple managers
- Family office principals reviewing quarterly cash flow, fees, and property-type performance grids
- REIT board members benchmarking their fund's fee structures and FFO metrics against peer vehicles
What problem this template solves
Institutional investors who evaluate real estate investment trusts face a specific challenge: most landing pages are built for individual investors or general marketing audiences, not for professionals who demand sector-level data. A page that cannot present occupancy rates, cap rates, and Funds From Operations (FFO) per share in a clear, comparable format loses credibility before the first scroll.
This template solves that credibility gap directly. It organizes performance data into structured comparison tables that highlight outperformance indicators, qualifies inbound leads by AUM range, and delivers the kind of disciplined visual experience that institutional clients expect.
- Eliminates generic real estate landing page formats that underserve data-driven institutional audiences
- Replaces scattered marketing copy with a structured, report-style layout that builds trust through evidence
- Provides a lead qualification path that filters visitors by firm type and assets under management before delivering gated content
What you get with this template
You get a fully structured, single-page layout built around the institutional investor experience. The page flows like a proprietary research deck: each section adds another layer of evidence, moving the reader from a bold performance statement at the top to a qualified content download at the bottom.
- A hero section with a giant serif headline and a trailing twelve-month distribution yield line chart, set against a deep institutional navy background
- Two structured comparison tables: one for sector allocation versus benchmark, one for property-type performance across industrial, multifamily, and medical office property types
- A gated lead capture form with progressive profiling fields including institutional email, firm name, and AUM range dropdown, followed by a stats trust band and a footer email subscription option
Feature list
This template includes a focused set of components, each designed to serve the investment decision-making process of institutional clients. The features below represent what is built into the template as described in the source brief.
Giant Headline Hero with Yield Chart
The hero occupies the full viewport width. The left sixty percent carries an enormous white serif headline stating a direct value proposition, for example: "92 Properties. $4.1B AUM. One Operating Philosophy." The right forty percent displays a minimal SVG line chart showing trailing twelve-month distribution yield with no labeled axes, allowing the upward trajectory to communicate on its own. The combination creates an immediate, data-first impression that sets the tone for the entire landing page.
Sector Allocation Comparison Table
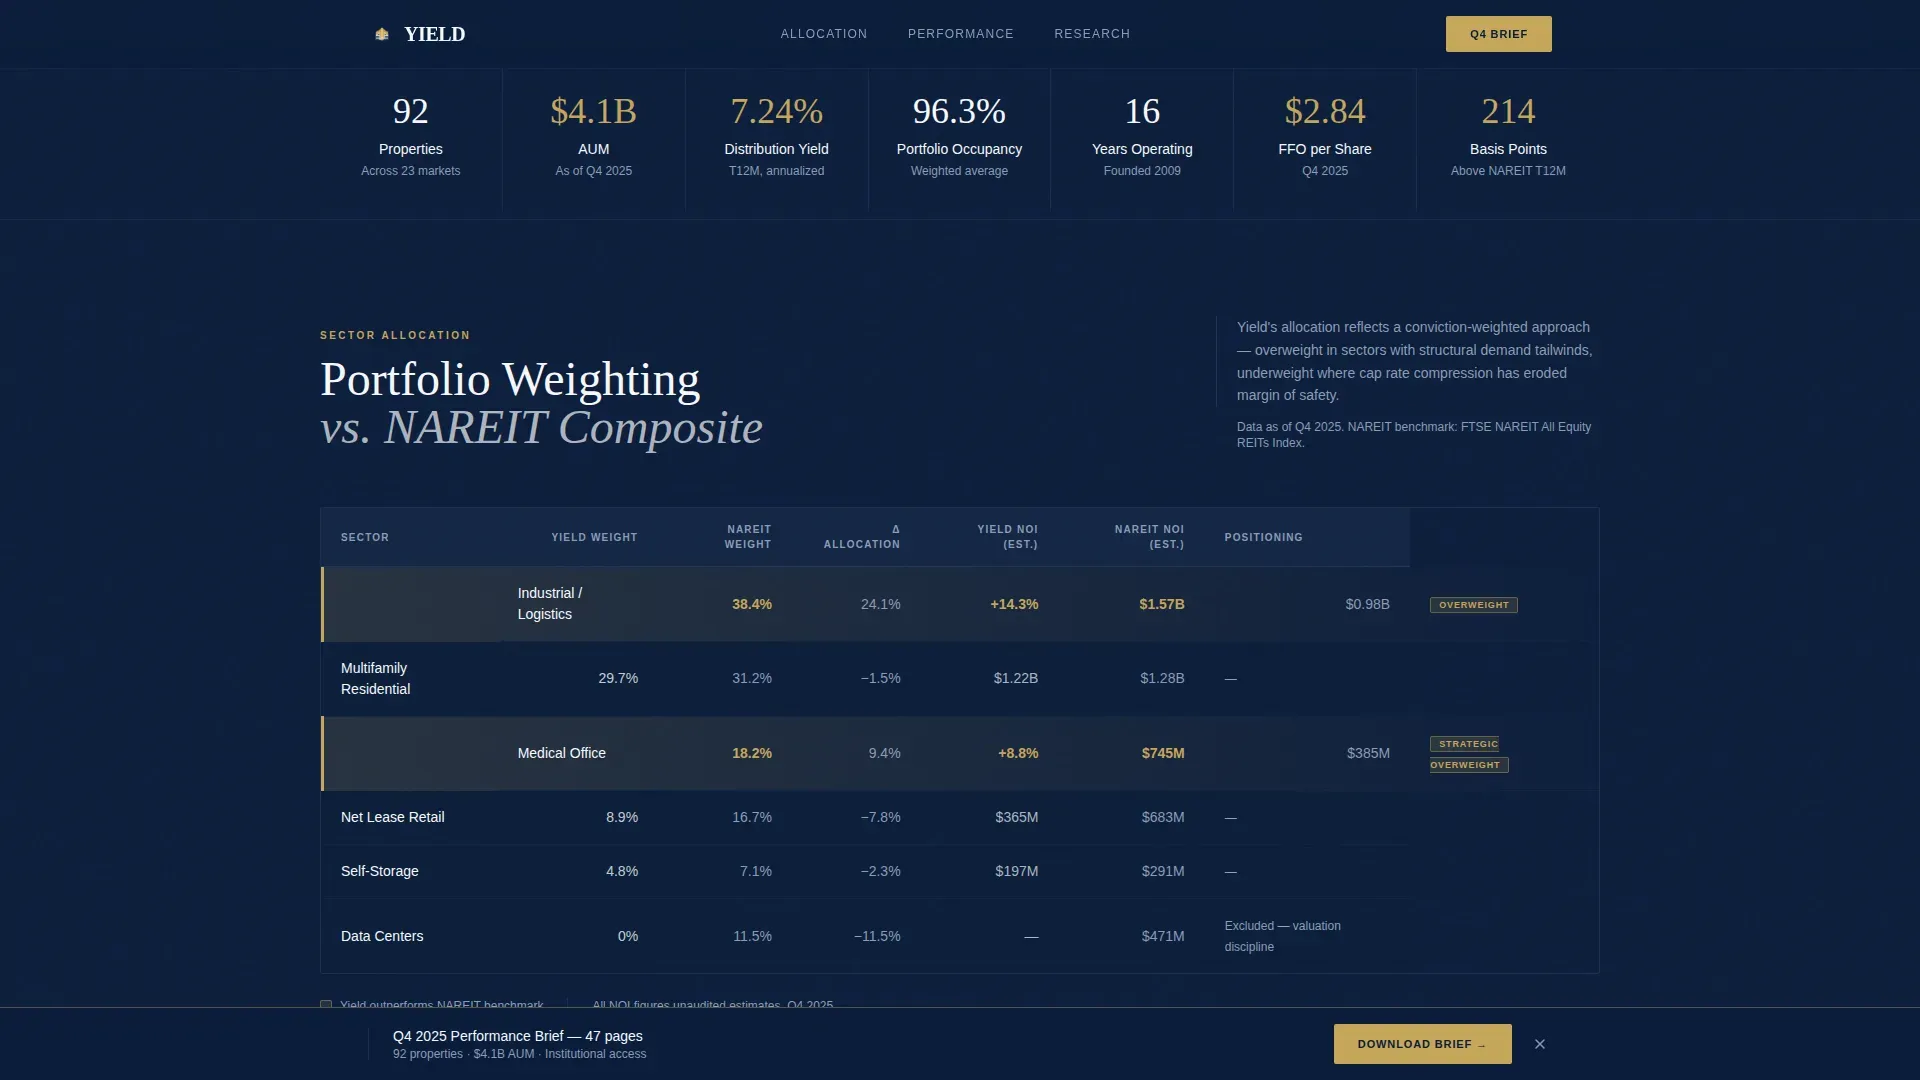
The first comparison table places the firm's portfolio sector weighting side by side against NAREIT benchmark allocations. Each row represents a real estate investment category, and rows where the firm outperforms its index are highlighted in fiduciary gold. This format gives pension fund allocators and board members the precise, sector-level data they need to make data driven decisions with confidence.
Property-Type Performance Grid
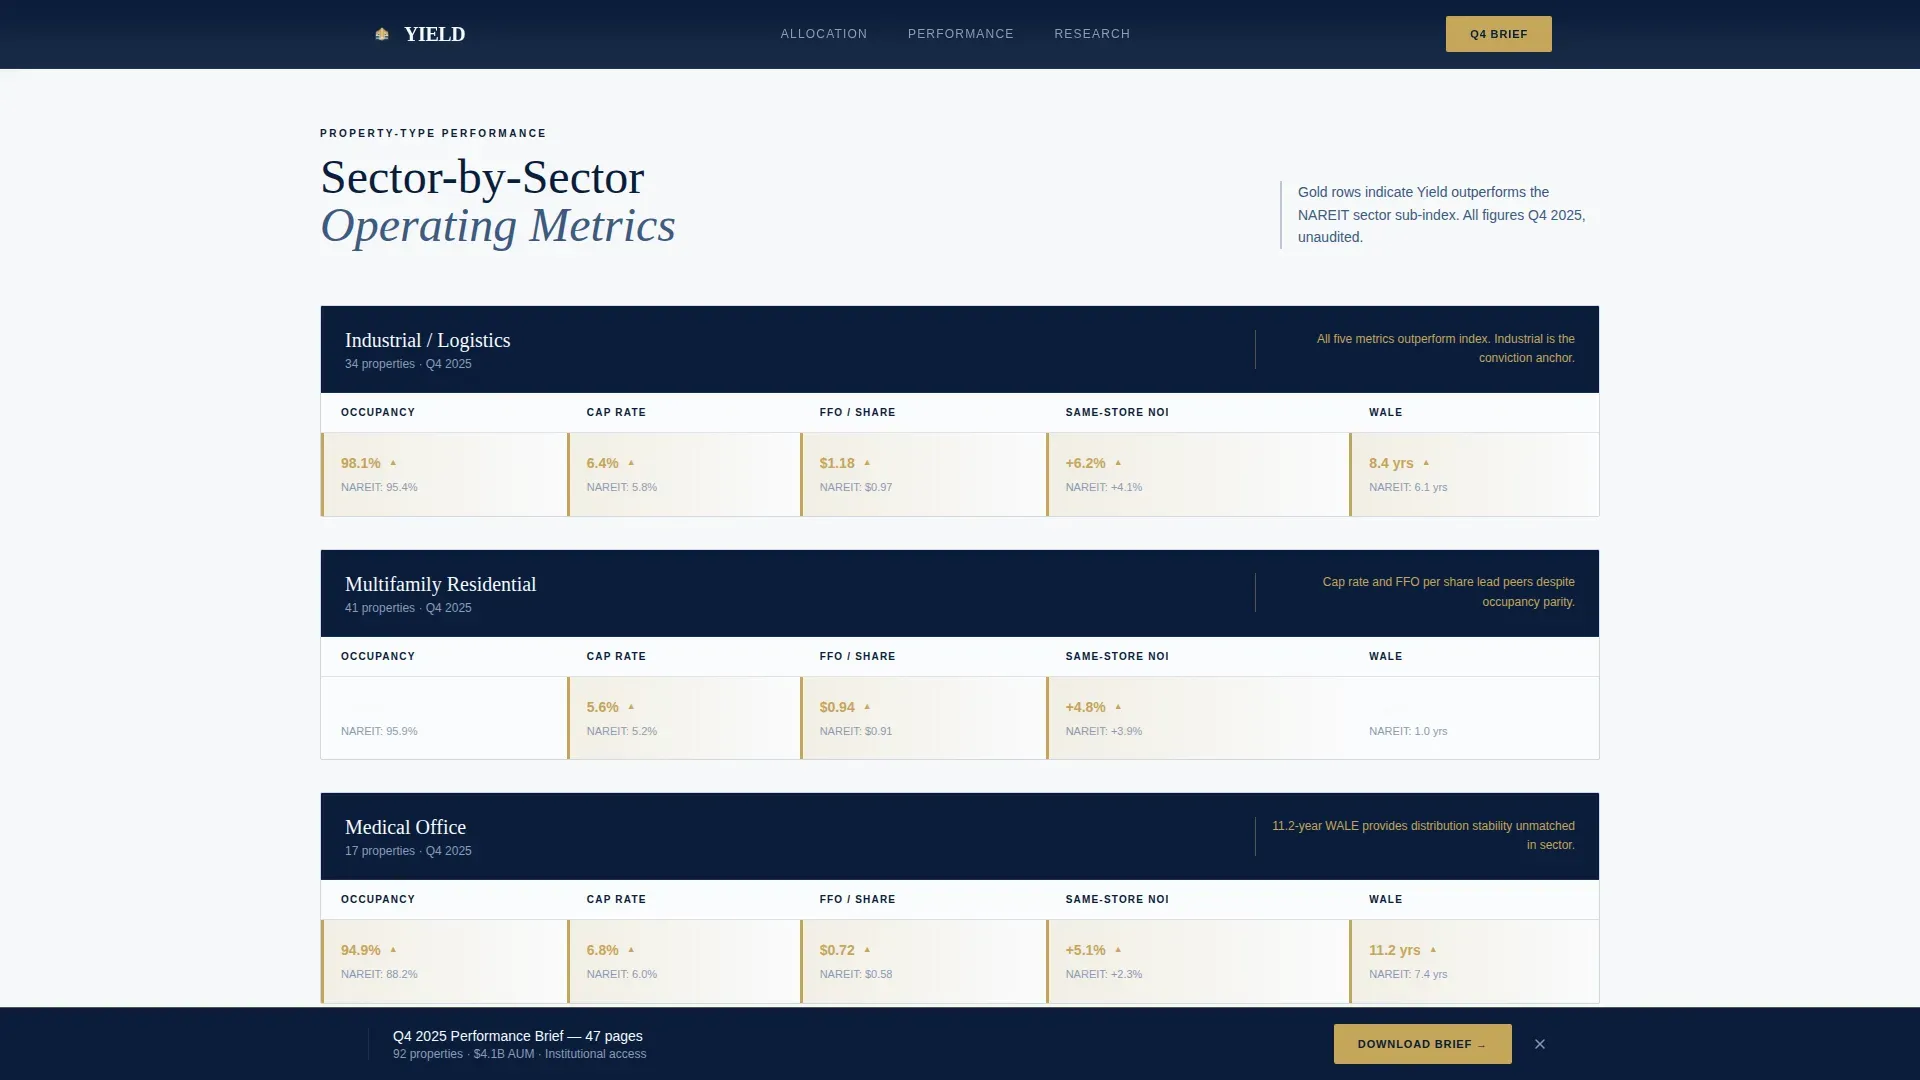
The second table presents occupancy rates, cap rates, and FFO per share across three distinct property types: industrial, multifamily, and medical office. Outperformance cells are highlighted in gold, creating a visual hierarchy that rewards careful analysis. This grid makes it straightforward to evaluate how rental income, cash flow, and lease performance vary across the portfolio.
Gated Lead Capture Form with AUM Qualifier
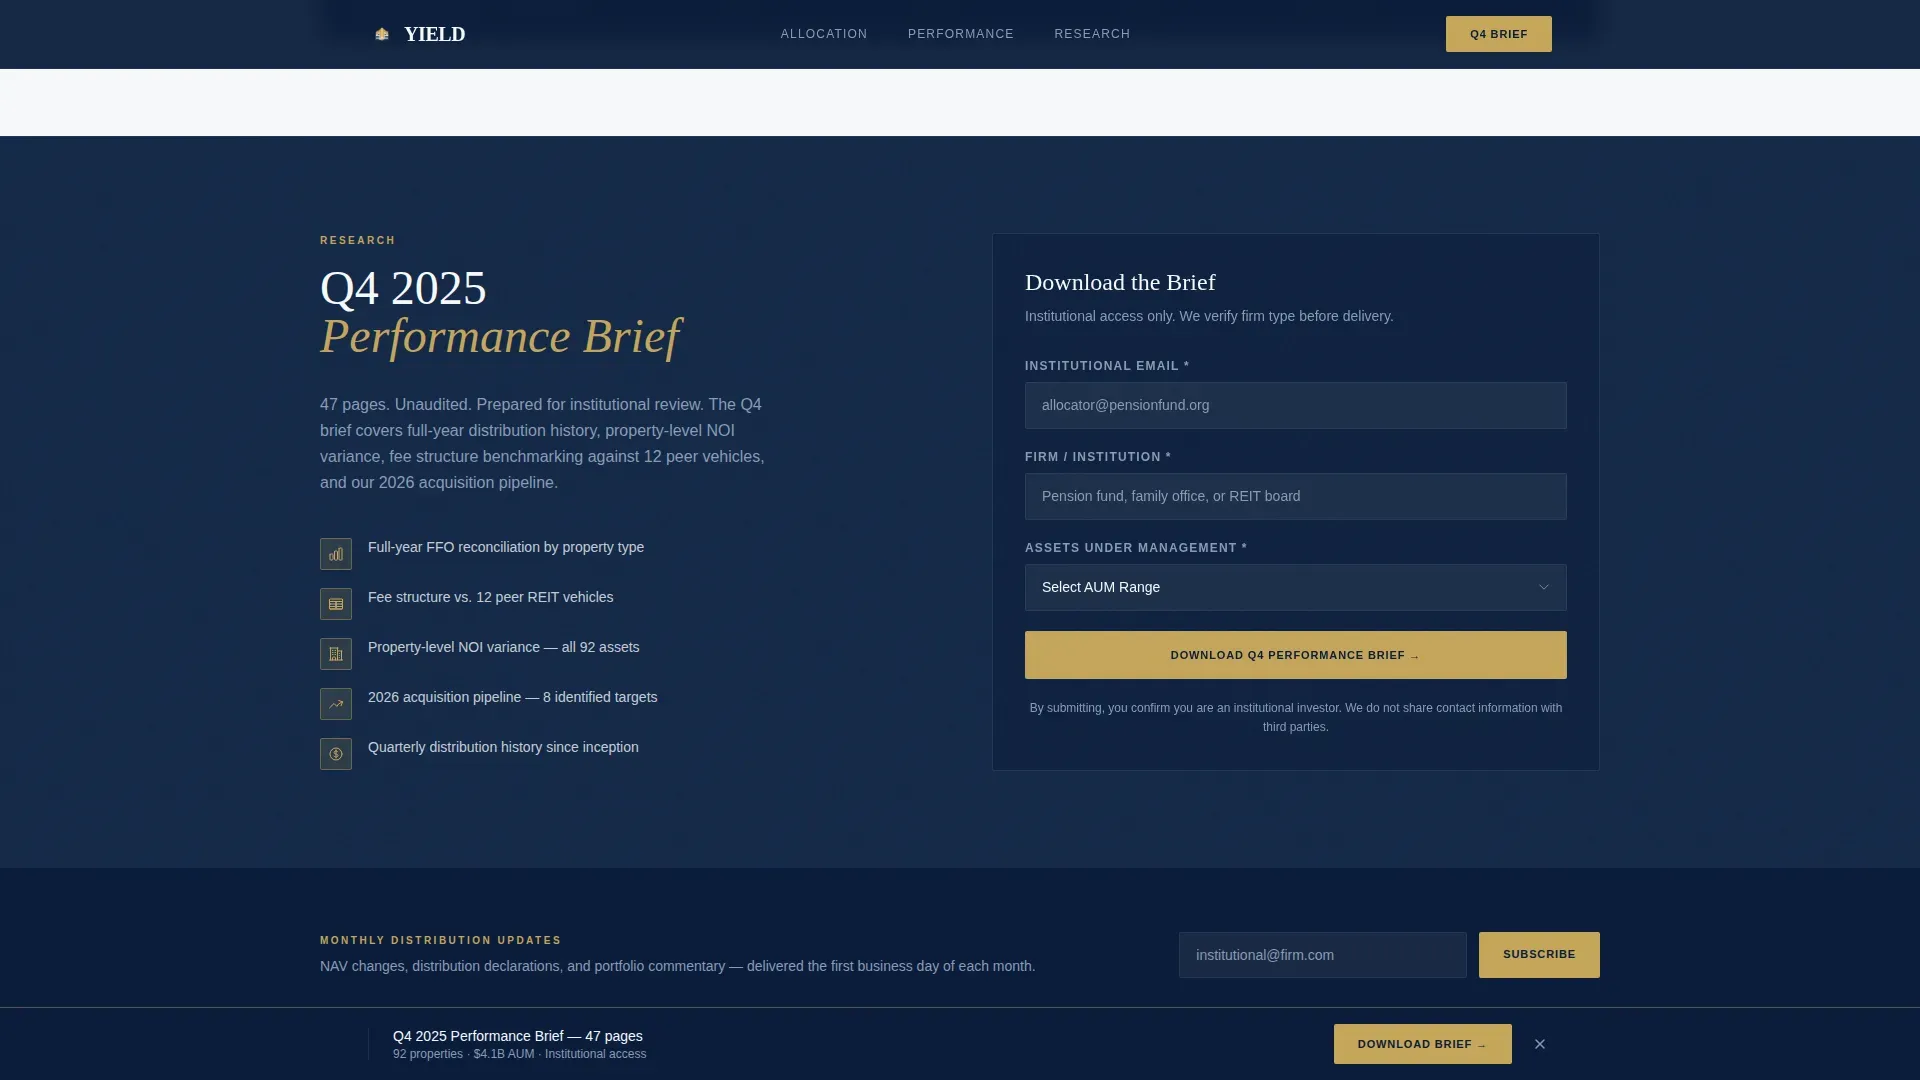
The primary call to action, "Download the Q4 Performance Brief," appears after the second comparison table. The form uses progressive profiling: it first requests institutional email, then firm name, then an AUM range via dropdown (Under $100M, $100M to $500M, $500M to $1B, $1B+). This structure qualifies each lead before the gated PDF is delivered. A sticky call-to-action bar activates at seventy percent scroll depth to reinforce the conversion opportunity without interrupting the reading experience.
Stats Trust Band
A horizontal trust band displays headline figures: total assets under management, number of properties, years of operations, and total distributions paid. These figures serve as institutional social proof, grounding the performance claims in verifiable operational scale. The band reinforces the investment thesis before the reader reaches the footer.
Footer Email Subscription
A secondary conversion path in the footer offers "Subscribe to Monthly Distribution Updates" as a lower-commitment email capture. This gives visitors who are not yet ready to download the brief a way to stay connected. It extends the marketing reach of the page without requiring an immediate decision.
Page sections overview
| Section | Purpose |
|---|---|
| Hero: Headline + Chart | Establish performance authority with bold serif headline and distribution yield line chart |
| Sector Allocation Table | Compare portfolio weighting against NAREIT benchmark by investment sector |
| Property-Type Performance Grid | Show occupancy, cap rate, and FFO per share across three property types |
| call to action Gate: Download Form | Qualify institutional leads by AUM range before delivering gated Q4 PDF |
| Stats and Trust Band | Reinforce scale with AUM, property count, operational years, and distributions paid |
| Footer Subscription | Capture lower-commitment leads via monthly distribution update email signup |
Design & branding system
The visual identity follows a Corporate Precision theme. Every design decision is calibrated to feel like a freshly bound institutional report: dark, authoritative, and precise. The typography pairs Fraunces serif headlines with DM Sans body and data text, creating a clear hierarchy between narrative and numbers.
- Color system: deep institutional navy (#0B1D3A) anchors headers and section backgrounds; polished slate (#3D5A80) frames secondary containers and table borders; crisp ledger white (#F7F8FA) fills data fields and body copy; fiduciary gold (#C5A55A) is reserved exclusively for outperformance indicators and call-to-action elements
- Typography: Fraunces handles all display headlines with the weight and formality of a printed annual report; DM Sans delivers clear, readable data rows and body paragraphs without visual noise
- Motion and interactivity: scroll-linked section reveals and staggered table row animations add a sense of deliberate pacing; the sticky call to action bar triggers at seventy percent scroll depth, keeping the conversion path visible without disrupting the analytical reading flow
Mobile & speed optimization
Although this template is designed desktop-first to match the workstation habits of institutional investors, the layout is built to maintain structural integrity across screen sizes. The responsive design approach ensures that comparison tables and form fields remain readable and functional on any device.
- Responsive design keeps the comparison tables, form dropdowns, and trust band legible at all viewport widths without horizontal scrolling
- Fast static rendering with server-side table components keeps page load times low, supporting a smooth experience even on data-heavy sections
- The sticky call to action bar and gated form are optimized for interaction on both desktop and tablet, preserving lead capture functionality across device types
How this template helps you convert
This landing page is engineered around a single conversion goal: delivering qualified institutional leads who are ready to engage with the Q4 Performance Brief. Every section is ordered to build evidence before asking for information, which is the approach that consistently improves conversion rates for high-trust, data-driven audiences.
- The hero section establishes instant authority with specific numbers and a performance chart, giving visitors a reason to keep reading before any form appears. Visitors who are pre-qualified by the headline are far more likely to complete the lead capture form below.
- The two comparison tables layer in sector allocation data and property-type performance grids, allowing allocators to self-identify as the right audience. By the time they reach the call to action gate, the case for downloading the brief has already been built through data, not promises.
- Progressive profiling in the form collects institutional email first, then firm name, then AUM range, reducing friction at each step while qualifying the lead. The sticky bar at seventy percent scroll depth serves as a persistent reminder, increasing form completion rates among visitors who almost converted on first pass.
Other information about this template
This template sits at the intersection of institutional real estate finance and high-performance landing page design. It is worth understanding the broader investment context this page is built to serve, as well as the practical decisions that make it an effective tool for REIT marketing teams.
- Real estate investment trusts must distribute at least 90% of taxable income to shareholders by law, which creates a consistent, predictable cash flow profile that institutional investors plan around. This template is designed to present that cash flow story clearly.
- Common metrics for evaluating real estate investment trusts include Funds From Operations (FFO), Adjusted Funds From Operations (AFFO), Net Asset Value (NAV), occupancy rates, and dividend yield ratios. AFFO is the most accurate measure of a REIT's true cash-generating capacity, calculated after accounting for recurring capital expenditures. This template's comparison tables are structured to surface exactly these data points.
- The occupancy rate, expressed as a percentage of rented units, directly affects both rental income and cash flow. Rental yield, defined as annual rental income as a percentage of property value, is another critical metric. Both figures are represented in the property-type performance grid built into this template.
- Property taxes, insurance costs, and accounting treatments are variable factors that affect net operating income across property types. The template's table structure can accommodate line items that reflect these cost components when customized for a specific portfolio.
- Interest rates significantly affect real estate investment trusts by raising borrowing costs, compressing property valuations, and shifting investor demand for dividend-yielding assets. The template's comparison table format helps management teams contextualize their performance against benchmarks even in rising-rate environments.
- Debt-to-EBITDA and maturity schedules are critical for assessing financial stability and leverage risk. A lower Net Debt to EBITDA ratio indicates that management is not over-leveraging the balance sheet to pay out high dividends. These figures can be included in the stats trust band or table rows when building out the template.
- WALE, or Weighted Average Lease Expiry, indicates that longer leases provide more predictable income streams, which is crucial for stability-focused portfolios. Including a lease duration row in the performance grid gives allocators another data point for evaluating the durability of rental income.
- Same-Property NOI Growth measures income growth from properties owned for at least a year, stripping out the effect of acquisitions and dispositions to show management's operational capability. This metric is an example of the kind of granular performance signal that distinguishes credible institutional pages from generic real estate landing pages.
- Institutions are increasingly focusing on selectivity, prioritizing real estate investment trusts with durable cash flows and robust balance sheets as valuations normalize. As of early 2026, Land and Data Centers led sector total returns at +15.36% and +8.49% respectively, while Office continued to underperform at -7.24%. The template's sector allocation table is designed to reflect this kind of current, specific performance data.
- Publicly listed real estate investment trusts have historically delivered average arithmetic returns of 11.0% compared to unlisted real estate at 8.3%, making the listed REIT structure a compelling choice for investors seeking both liquidity and growth.
- Global REITs have demonstrated strong correlation with commercial real estate markets, as property values, occupancy rates, and rental income directly affect underlying assets and dividend distributions. The template supports a global REIT context if a firm operates across international markets.
- Management teams that prioritize cash-flow-based metrics over traditional GAAP earnings are better positioned when comparing institutional real estate investment trusts focused on yield. Internal management structures are generally better aligned with shareholder interests than external managers who charge fees based on asset size rather than performance. The fee structure comparison row in this template makes that distinction visible.
- A/B testing is a valuable strategy for improving landing page performance over time. Teams can test different headlines, form field orders, and call to action copy to see which version drives higher conversion rates. Using analytics tools to track user behavior and make data driven decisions is an essential part of optimizing any real estate landing page.
- Customization options in this template allow teams to adjust the color accent on outperformance rows, update the AUM dropdown ranges, and revise the headline to match current portfolio figures. Firms can customize the stats trust band to reflect their own operations, properties, and payment history.
- Individual investors are not the primary audience for this template. It is built specifically for institutional decision-makers who evaluate investment opportunities through a lens of capital allocation, equity returns, and long-term portfolio strategy. However, the template can serve as a foundation for pages targeting a broader investor base if adapted accordingly.
- Well-designed landing page templates can significantly increase lead conversion rates in real estate marketing. Real estate landing pages are crucial for generating leads by showcasing services, assets, and performance data in a format that builds immediate credibility with potential clients.
- The yield institutional reit management comparison table landing page template is the specific product this page describes. It is built to help institutional real estate investment firms create a high-trust, data-first landing experience that generates qualified leads and supports the sales process for complex investment services.

Theme
Corporate Precision
Creative direction
Industry Report
Color system
Midnight Blue
Style
Comparison Table
Direction
Content/Resource
Page Sections
Giant Headline Hero with Distribution Yield Chart
Sector Allocation Comparison Table
Property-type Performance Grid
Gated Lead Capture Form with AUM Qualifier
Stats Trust Band
Footer Email Subscription
Related questions
Who is this landing page template designed for?
What comparison data does the template display?
How does the lead capture form qualify visitors?
Can I customize the table rows and performance metrics?
Is this template suitable for desktop and mobile use?