
Want clearer financial dashboards without spreadsheet chaos? AI can gather data, surface key metrics, and turn numbers into visuals, helping teams review performance more quickly and make confident financial decisions daily.
Can AI really help you build smarter dashboards for financial reporting?
Yes, it can. AI can collect financial data, organize it, and turn it into clear visuals that help teams quickly understand business performance. Instead of digging through spreadsheets, a financial dashboard shows the numbers that matter in one place.
A recent McKinsey report finds that companies using AI in analytics can improve decision-making speed by up to 5x.
If your team works with large financial datasets, AI can make reporting faster and easier to understand.
In this blog, we will walk through how to create a financial dashboard using AI, what metrics to include, and how businesses can turn financial data into clear insights for better-informed decision-making.
Why Businesses Need Financial Dashboards?
A financial dashboard is a visual tool that brings financial data into one place. It helps teams monitor performance, track progress, and understand business results in real time.
Many organizations still rely on spreadsheets. That often leads to scattered data and delayed reporting. A financial dashboard fixes that problem by presenting key metrics clearly.
A financial reporting dashboard makes it easier for users to review results across departments. It allows teams to see profit margins, total profit, and cash flow without switching between files.
With a good financial dashboard, users can:
- Track expenses
- Review total sales
- Monitor cash inflows
- Evaluate profit margins
- Analyze financial health
When teams work with complex data every day, a dashboard simplifies things. It turns raw data into insights that support informed decisions.
How AI Helps Create Smarter Financial Dashboards?
AI improves financial reporting by processing large amounts of financial data quickly. Instead of manual work, AI tools automatically organize dashboard data.
This makes it easier for financial analysts to focus on analysis rather than data preparation.
AI tools can:
- collect data from multiple sources
- clean raw data
- detect patterns in complex data
- spot trends in revenue and expenses
- generate financial dashboard examples
AI also supports real-time data updates. That means the financial dashboard always reflects the latest financial reporting numbers.
For a business that relies on fast insights, that makes a big difference.
How to Build a Financial Reporting Dashboard with Rocket.new
So, how do you actually build a financial reporting dashboard with Rocket.new?
The good news is that the process is well-structured and easy to follow. Instead of spending weeks setting up infrastructure, you focus on the idea, the data, and the insights you want the dashboard to show.
Rocket.new helps convert that idea into a working dashboard step by step. From defining the reporting goal to reviewing the final build, each stage moves the project forward without unnecessary complexity.
Below are the practical steps that guide you from the first idea to a fully functional financial dashboard that clearly displays business metrics, expenses, cash flow, and other financial insights.
Step 1: Define the Financial Reporting Goal Clearly
Start with clarity. A focused goal prevents confusion later. Decide what financial reporting problem the dashboard should solve before opening any tools.
Choose your direction:
- Revenue and profit tracking
- Cash flow monitoring
- Expense management
- Loan portfolio analysis
- Sales and profit margin reporting
Pick one strong focus first. Keep the scope tight for the first version.
Trying to build a massive financial dashboard with every metric usually creates clutter. A clear starting point leads to better insights and faster informed decisions.
Step 2: Sign Up to Rocket.new
Now it’s time to move from idea to action. Create your workspace before building anything.
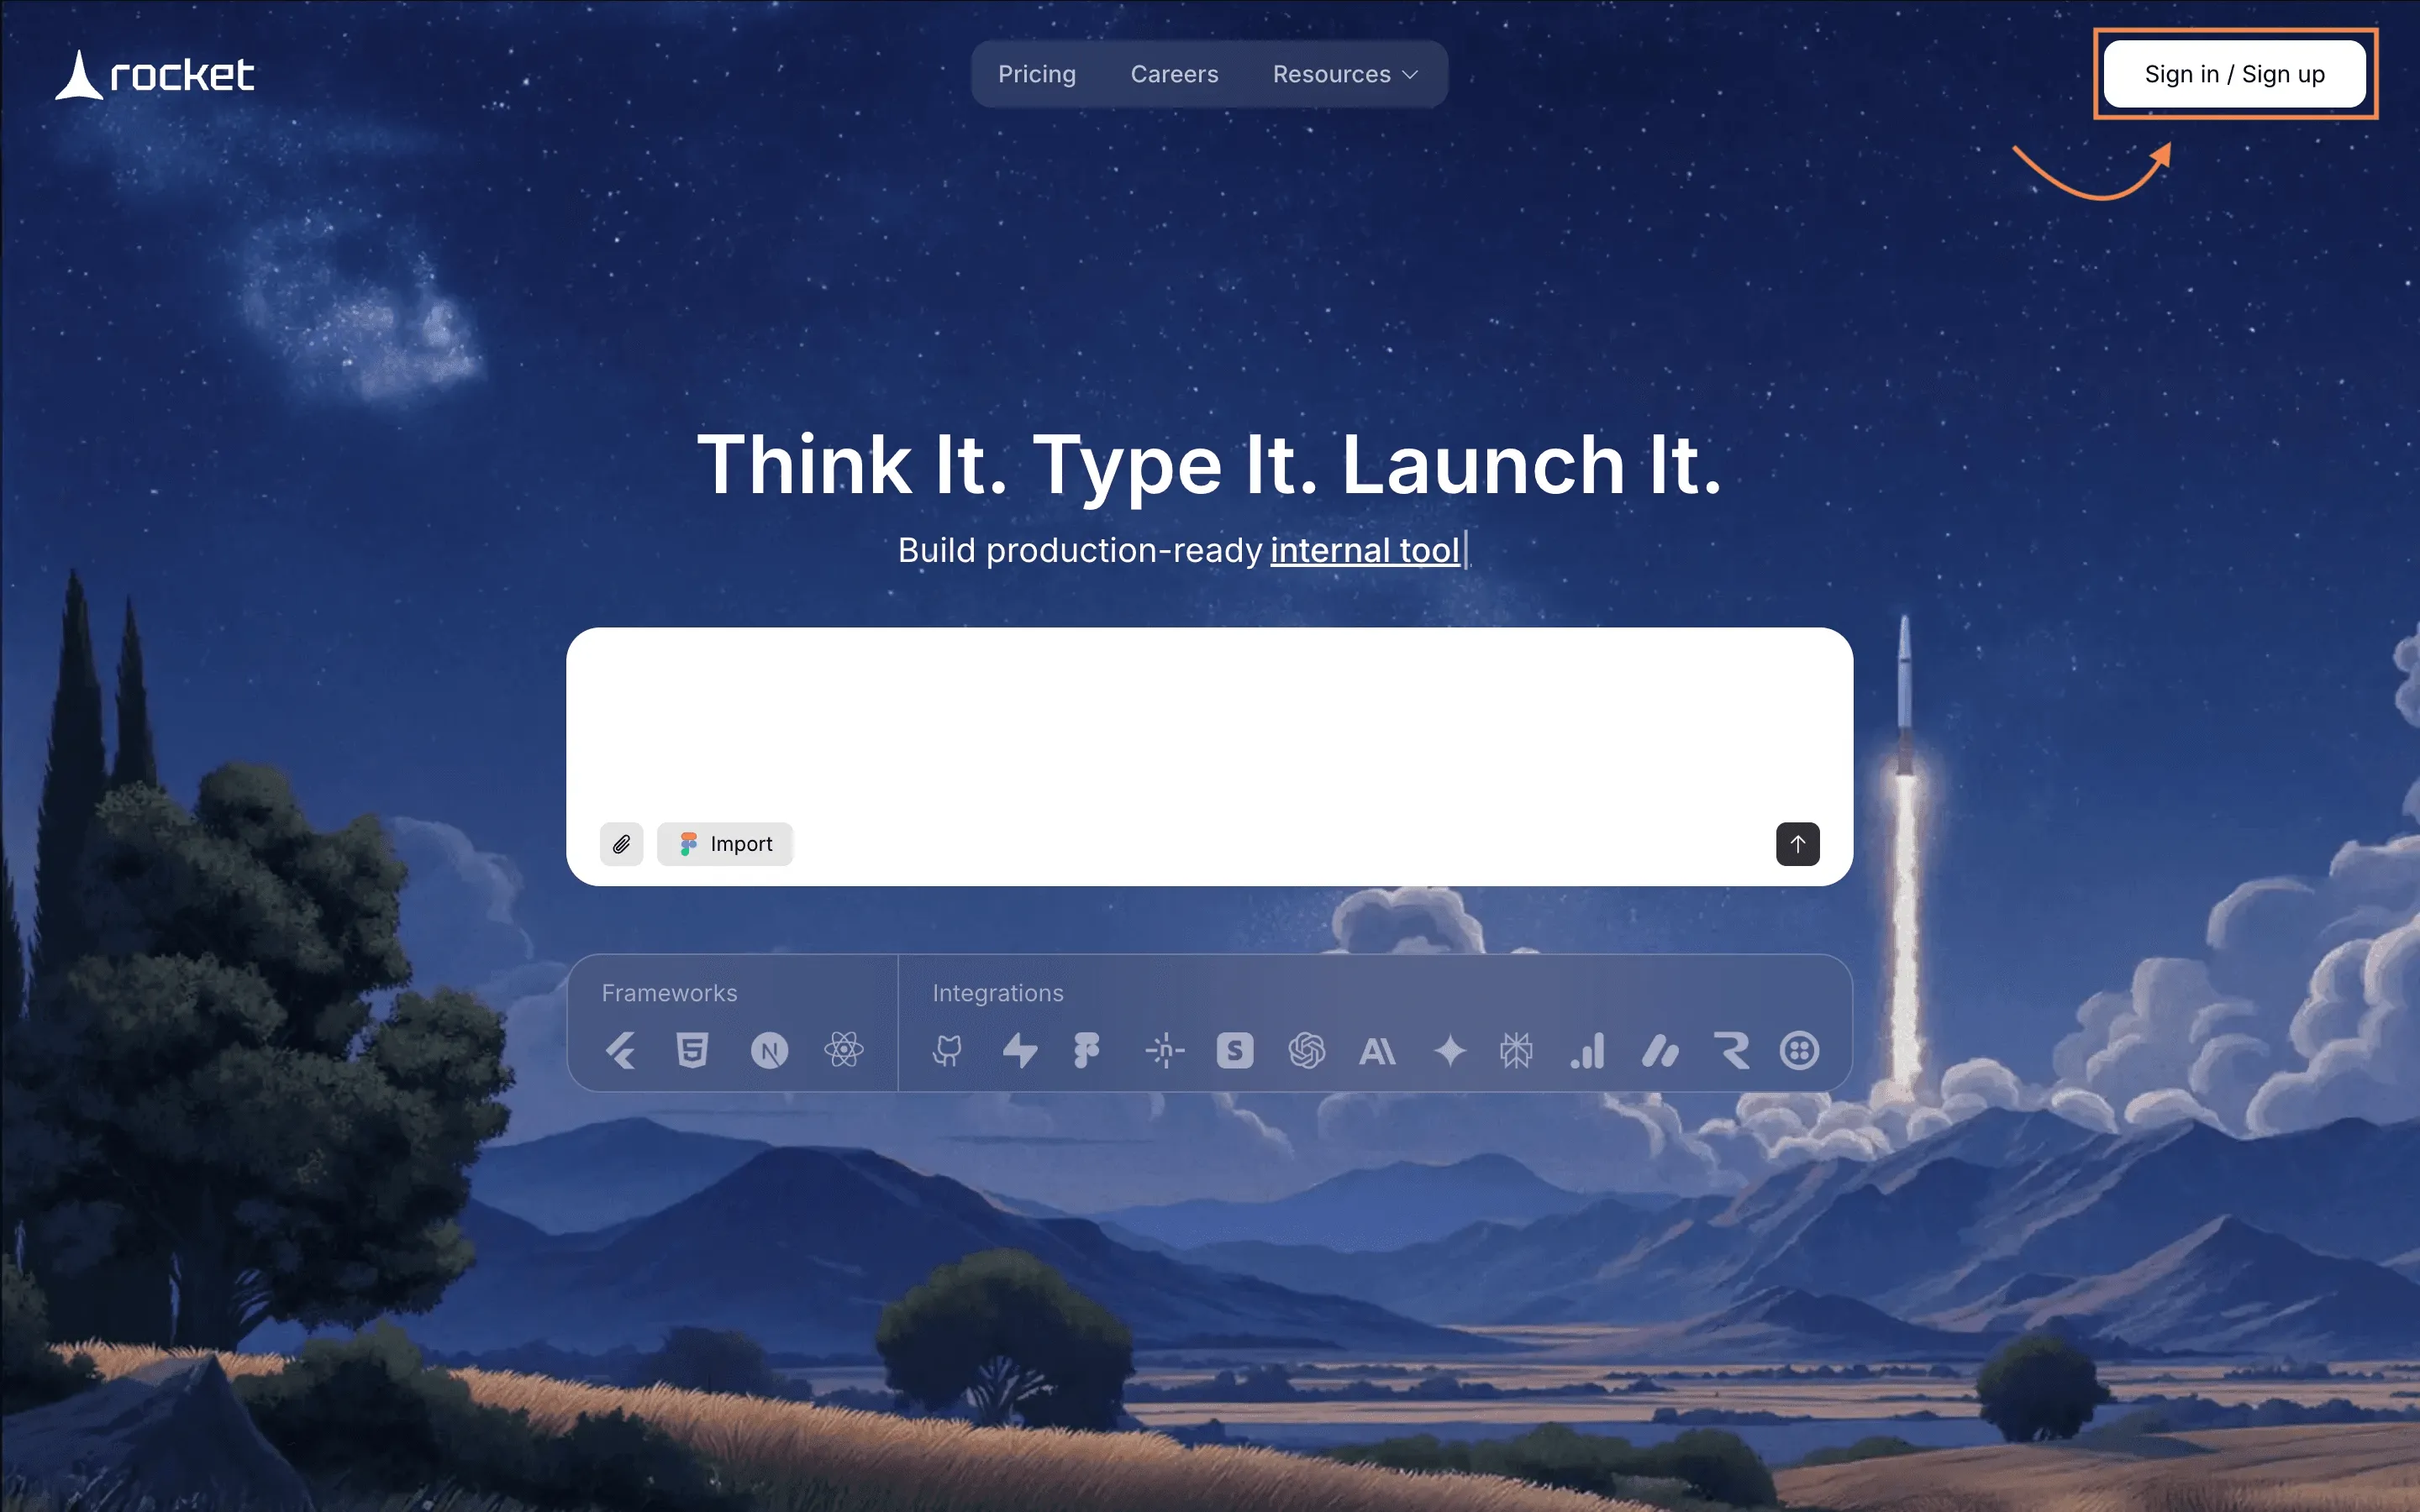
Go to Rocket.new and sign up. Then create a new project from the dashboard.
No complicated setup. No backend configuration. Just a clean environment ready to build your financial dashboard.
This step prepares the space where your financial data and dashboard structure will live.
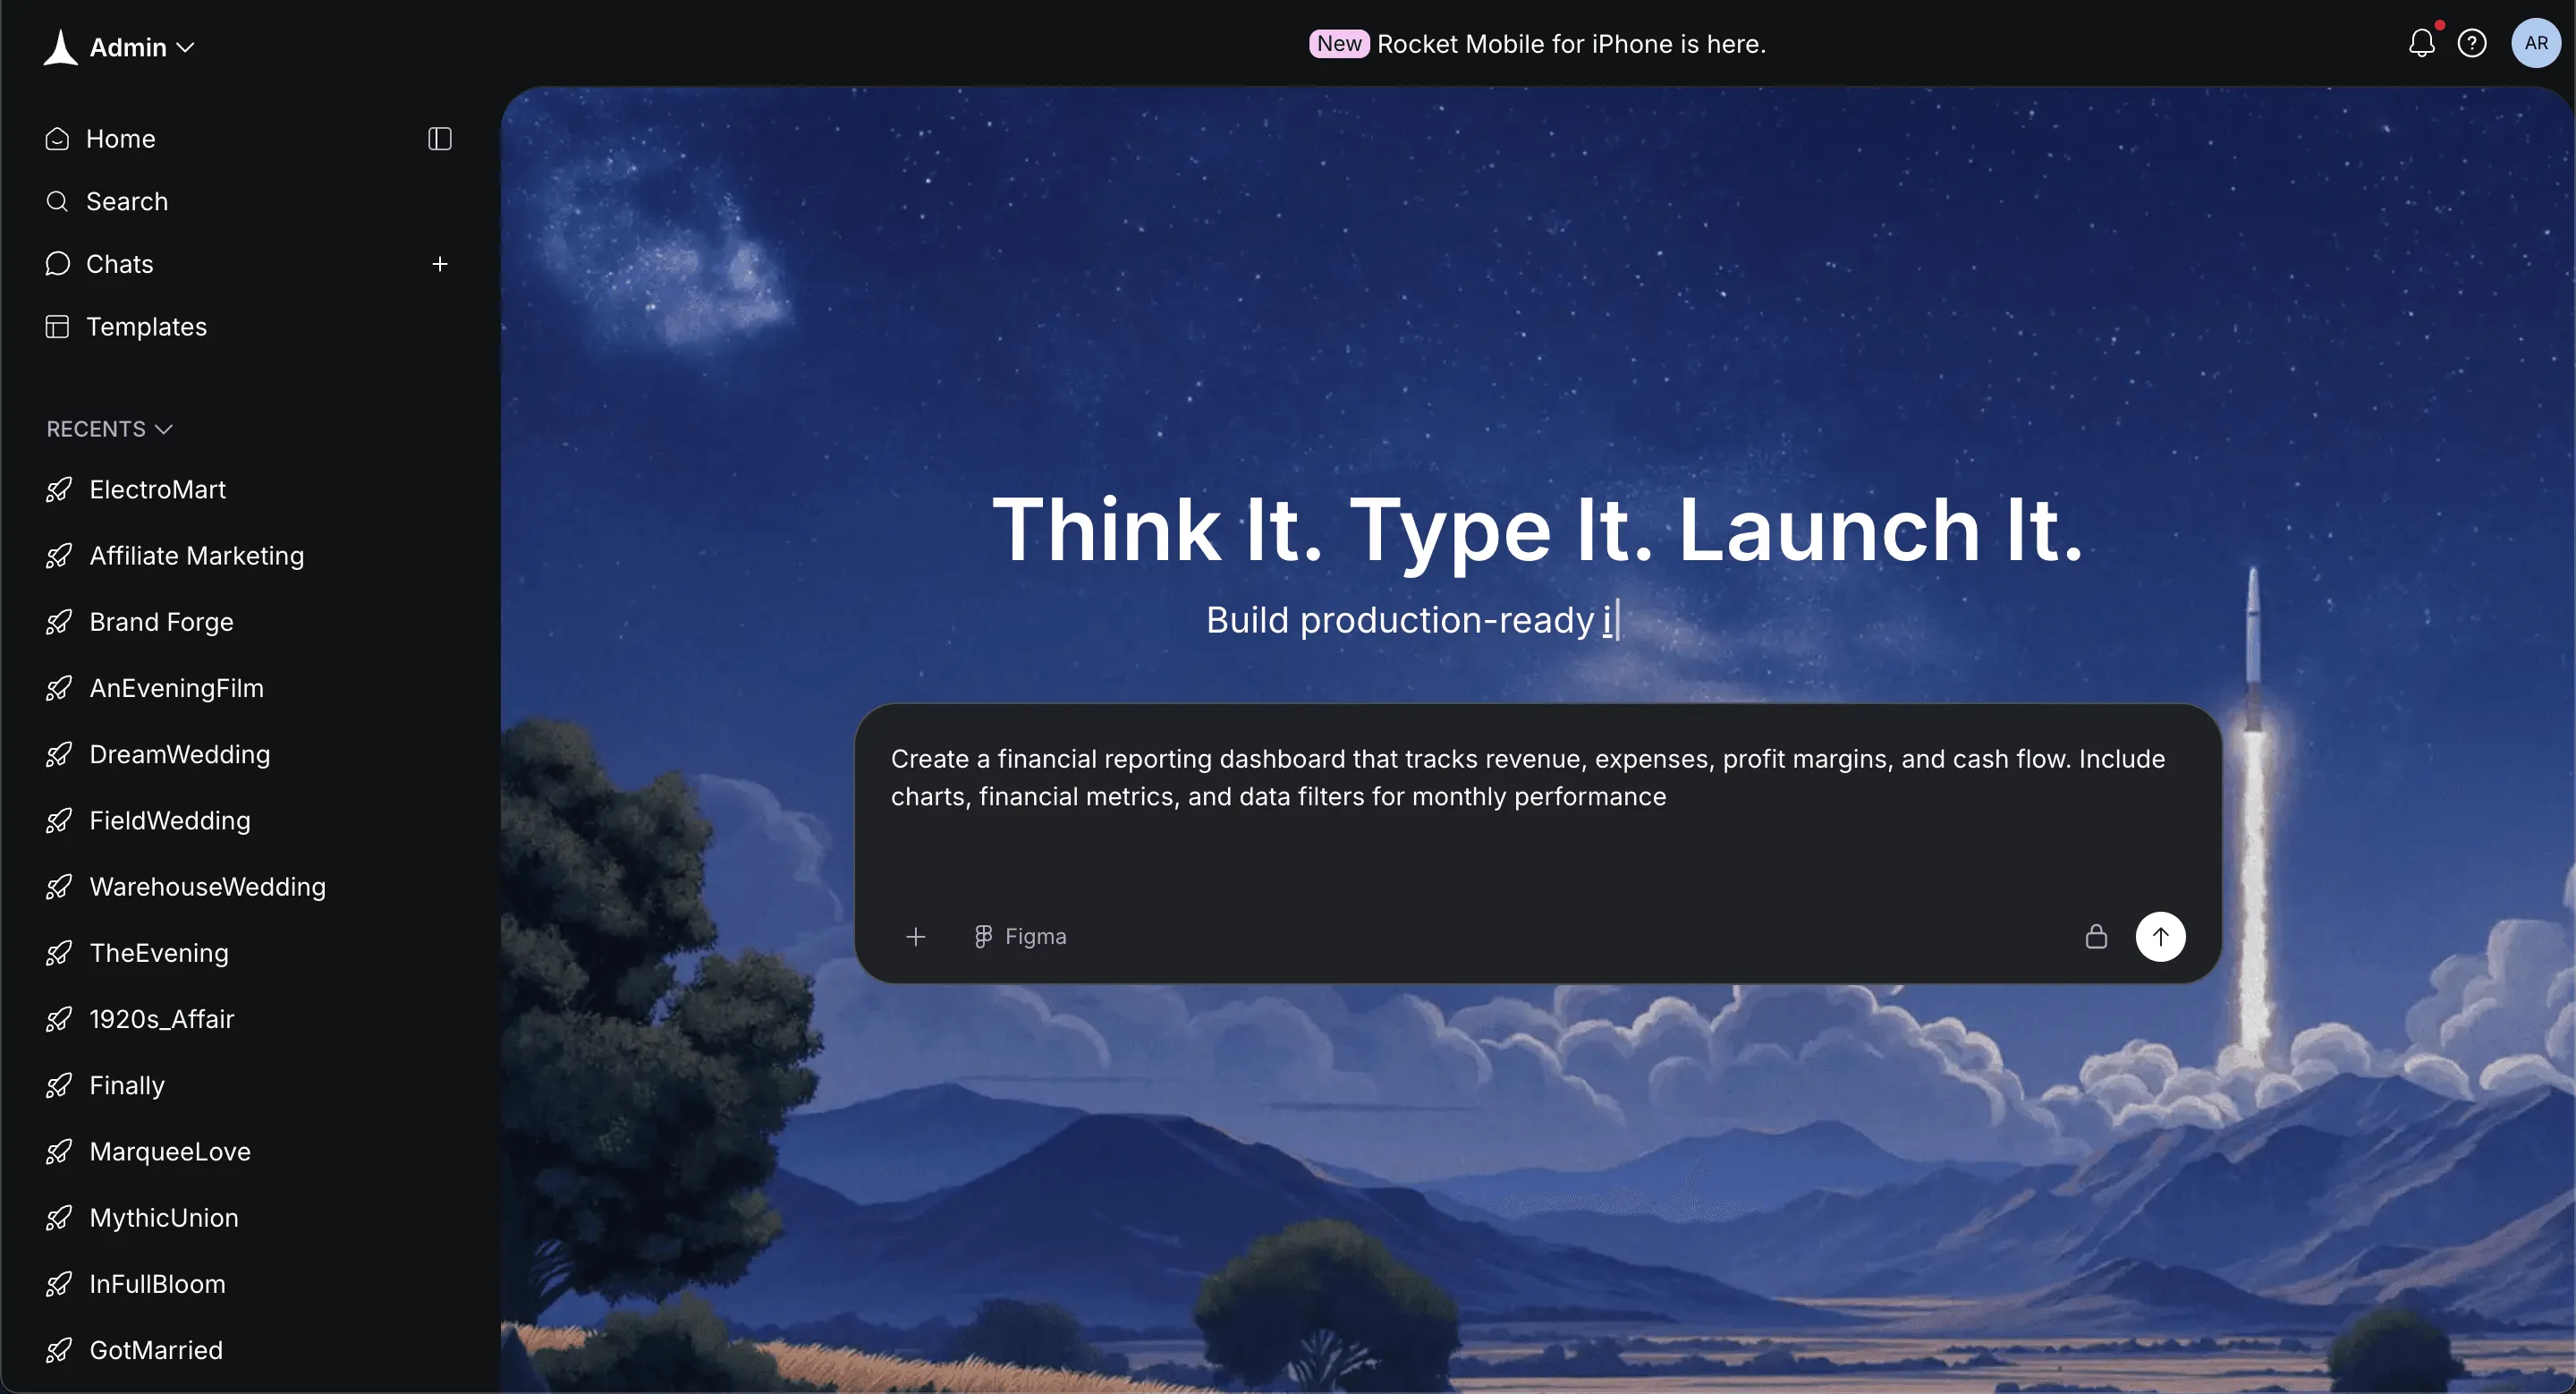
Step 3: Enter a Prompt or Choose a Dashboard Template
The dashboard is starting to take shape.
You can either describe the dashboard you want or choose a template.
Option 1: Enter a prompt
Example:
“Create a financial reporting dashboard that tracks revenue, expenses, profit margins, and cash flow. Include charts, financial metrics, and data filters for monthly performance.”
Option 2: Choose a template
Rocket.new may provide dashboard templates such as:
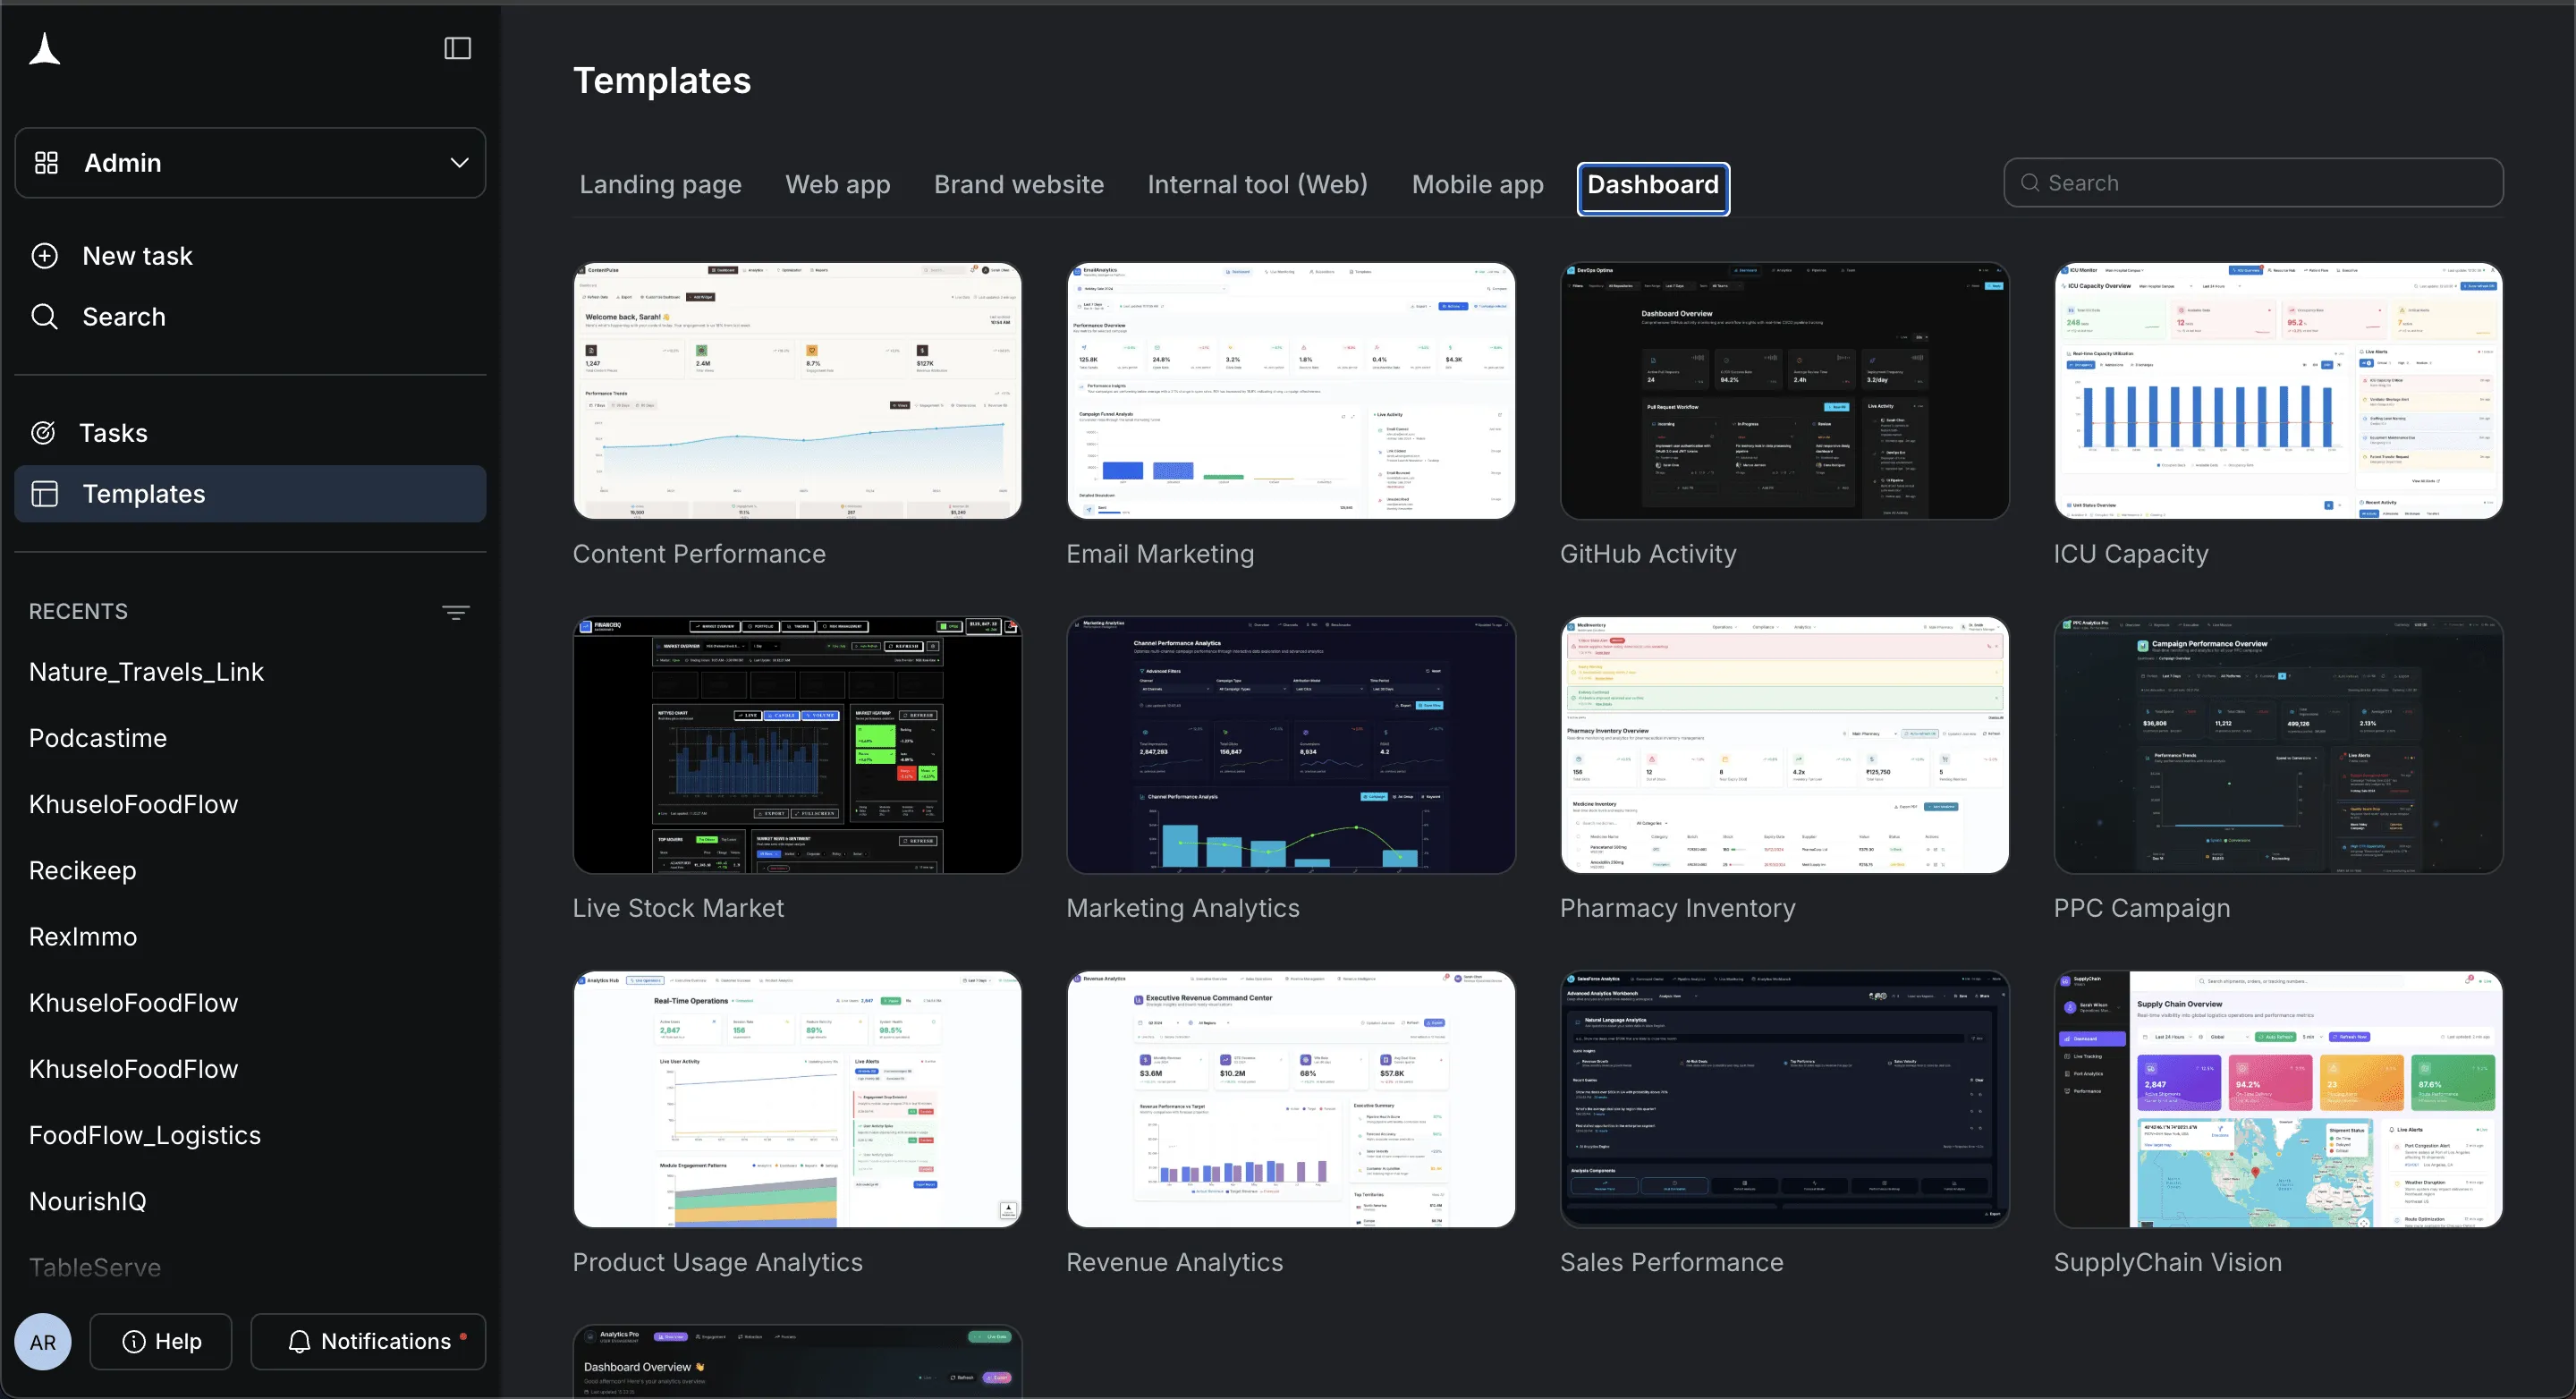
- Business analytics dashboard
- Financial performance dashboard
- Expense tracking dashboard
- Revenue analytics dashboard
Be specific when entering prompts. Clear instructions help the system generate better results.
Step 4: Select the Dashboard Components
Now shape the structure visually. Decide which sections your financial dashboard needs.
Select components such as:
- Revenue summary section
- Expense management charts
- Cash flow analysis panel
- Profit margin graphs
- Financial performance metrics
These elements help users understand financial data quickly.
Confirm the components you want. Then let Rocket.new start building the dashboard structure.
Step 5: Watch the Dashboard Build in Real Time
This part feels satisfying. You actually see the dashboard come together.
Rocket.new generates:
- Frontend dashboard interface
- Backend data structure
- Database connections
- Data visualization components
Instead of spending weeks building systems manually, the dashboard foundation can be built quickly.
This is where traditional development typically slows. With AI support, the dashboard grows much faster.
Step 6: Review the Generated Dashboard
Now pause and review everything carefully. This step matters.
Check questions like:
- Are revenue metrics displayed clearly?
- Does the cash flow chart reflect accurate financial data?
- Are expense categories organized correctly?
- Do profit margins appear across the selected time period?
Look at the dashboard from a user perspective. The goal is clear insights and smooth navigation.
If something feels confusing, adjust it.
Step 7: Modify the Dashboard Using Commands
This is where flexibility appears. Rocket.new provides commands and features to quickly refine the dashboard.
Commands such as:
- "add auth"
- "update app name"
- "generate an image"
You guide the system with simple instructions.
Examples:
- “Add a profit margin chart.”
- “Create a filter for quarterly data.”
- “Change the dashboard layout.”
- “Generate a revenue growth graph.”
Rocket.new updates the dashboard structure after each command.
It feels less like coding and more like directing the system.
Step 8: Test the Dashboard with Real Financial Data
Before launching the dashboard, test everything carefully.
Load sample or real financial data into the dashboard.
Check:
- Data accuracy across charts
- Real time updates for revenue and expenses
- Filters for different time periods
- Cash flow calculations
- Total profit metrics
Testing confirms that the dashboard provides reliable insights for informed decision making.
Fix problems immediately if you find them.
Step 9: Final Review and Deployment
Now polish everything before releasing the dashboard.
Review:
- Dashboard layout clarity
- Financial metrics accuracy
- Data visualization readability
- Access permissions for users
Then deploy the dashboard.
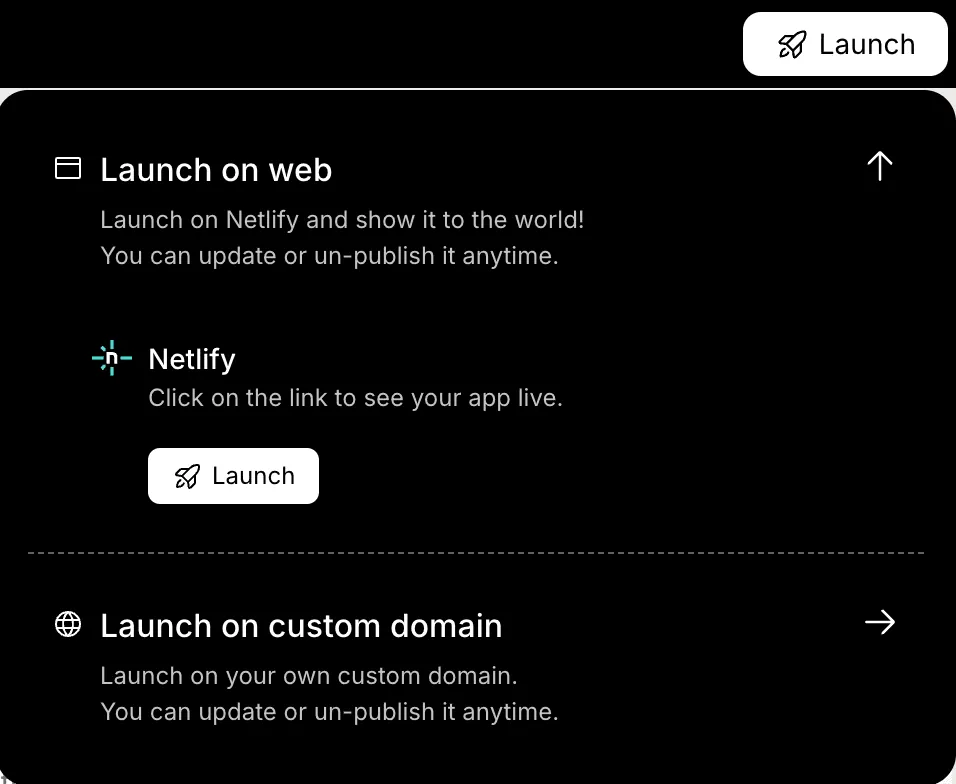
Teams can now open the dashboard and monitor financial performance, track expenses, and review cash flow in real time.
The financial reporting system is now live and ready to support better business decisions.
And that’s the full process. Once these steps are complete, you will have a working financial reporting dashboard that collects financial data, organizes metrics, and shows business performance clearly in one place.'
Community Insight
Many professionals share real experiences with financial dashboards online.
A Reddit user once explained the value clearly:
"Once we moved our reporting into a financial dashboard, meetings changed completely. Instead of debating numbers, we focused on decisions."
This reflects what many financial analysts experience. When data becomes visual and accessible, teams spend less time searching for numbers and more time making strategic decisions.
Financial Dashboard Examples Businesses Use
Different businesses track different financial metrics. That’s why companies often build dashboards around specific reporting needs. Each financial dashboard focuses on a specific area of financial performance and provides a clear, structured view of financial data.
Below are a few common financial dashboard examples that organizations use to monitor financial reporting and support informed decisions.
Cash Flow Dashboard
- Tracks cash flow across multiple time periods
- Shows cash inflows and outgoing expenses
- Helps teams monitor liquidity and maintain financial health
- Useful for identifying cash shortages early
Expense Management Dashboard
- Breaks down expenses by expense type
- Highlights spending patterns across departments
- Helps businesses reduce costs and control budgets
- Supports better expense management
Revenue Dashboard
- Tracks total sales and revenue growth
- Shows profit margins and total profit
- Helps leaders review financial performance quickly
- Useful for spotting revenue trends over time
Portfolio Dashboard
- Analyzes commercial loan portfolios
- Tracks portfolio performance and lending results
- Helps financial analysts monitor loan portfolio data
- Useful for reviewing risk across lending portfolios
These dashboard examples show how businesses use dashboards to organize financial data, monitor key metrics, and identify trends in financial reporting. When dashboards present insights clearly, teams can focus on informed decision-making instead of searching through complex data.
Using AI to Analyze Complex Financial Data
Financial reporting often involves complex data sets. AI tools simplify analysis by quickly processing large collections of financial data.
AI can analyze:
- profit margins
- cash flow
- spending patterns
- portfolio performance
- option valuation
AI also identifies patterns across multiple time periods.
For example, AI might analyze compound annual growth rate across several years. It may detect financial health risks based on changes in expenses or revenue.
That allows teams to make informed decisions before problems grow.
Building Dashboard Templates for Repeated Use
Many companies create dashboard templates to speed up reporting. Dashboard templates help teams create consistent financial dashboards for different departments.
Templates may include:
- expense management layouts
- revenue dashboards
- cash flow dashboards
- investment dashboards
These dashboard templates save time and maintain consistency across financial reporting processes.
Users can adjust input values while the structure stays the same, with the dashboard layout remaining the same.
This makes reporting easier for large teams.
Best Practices for Building Financial Dashboards
When building a financial dashboard, a few simple practices help keep the dashboard clear and useful for users.
- Focus on Key Metrics: Too many numbers create confusion. A financial reporting dashboard should highlight only the most useful metrics.
- Keep the Dashboard Clean: A well designed financial dashboard should present complex data clearly. Avoid clutter and keep visuals simple.
- Update Data in Real Time: Real time data updates help users monitor performance and track progress throughout the time period.
- Provide Actionable Insights: Dashboards should do more than show numbers. They should provide insights that guide strategic decisions.
When these practices are followed, dashboards help support informed decision making across the business.
Making Financial Reporting Clear with the Right Dashboard
Many businesses struggle with scattered financial data. Reports often sit in spreadsheets, different systems, and long email threads. This slows financial reporting and makes decision making harder. A well designed dashboard for financial reporting solves this by organizing financial data, expenses, and performance metrics in one place. With AI, the system collects data from multiple sources, analyzes complex data, and updates the dashboard in real time.
Financial dashboards help teams monitor financial health, track profit margins, and manage cash flow with clarity. When businesses build dashboards focused on insights and informed decision-making, leaders gain a clearer view of performance and future opportunities, making smarter decisions for the business.
Table of contents
- -Why Businesses Need Financial Dashboards?
- -How AI Helps Create Smarter Financial Dashboards?
- -How to Build a Financial Reporting Dashboard with Rocket.new
- -Step 1: Define the Financial Reporting Goal Clearly
- -Step 2: Sign Up to Rocket.new
- -Step 3: Enter a Prompt or Choose a Dashboard Template
- -Step 4: Select the Dashboard Components
- -Step 5: Watch the Dashboard Build in Real Time
- -Step 6: Review the Generated Dashboard
- -Step 7: Modify the Dashboard Using Commands
- -Step 8: Test the Dashboard with Real Financial Data
- -Step 9: Final Review and Deployment
- -Community Insight
- -Financial Dashboard Examples Businesses Use
- -Cash Flow Dashboard
- -Expense Management Dashboard
- -Revenue Dashboard
- -Portfolio Dashboard
- -Using AI to Analyze Complex Financial Data
- -Building Dashboard Templates for Repeated Use
- -Best Practices for Building Financial Dashboards
- -Making Financial Reporting Clear with the Right Dashboard