
Connect IPQualityScore or Cloudflare Turnstile to a Next.js dashboard via Rocket's REST API importer, add native Twilio SMS alerts, and deploy in one click. No security team needed. Full bot monitoring live in one session.
A bot detection dashboard is a real-time monitoring interface that scores incoming traffic for automated behavior, flags anomalies, and triggers alerts when thresholds are breached. Learn how to build a bot detection dashboard for your web app by connecting IP reputation APIs, rate anomaly tracking, and Twilio alerts, no security team or developer required.
What Does a Bot Detection Dashboard Actually Need?
A bot detection dashboard needs four core components: IP reputation scoring, request-rate anomaly tracking, headless browser fingerprinting alerts, and a searchable blocked-traffic log. Together, these cover detection, classification, enforcement, and audit, and you can wire all four without writing security infrastructure from scratch.
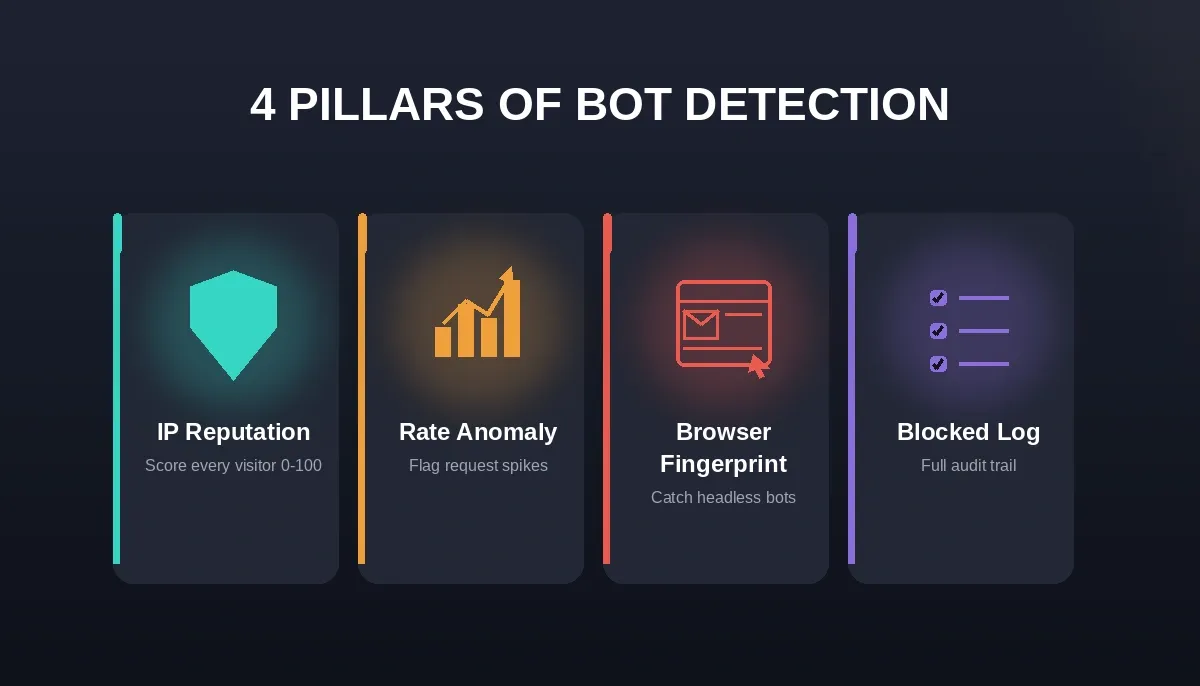
The four pillars every bot detection dashboard must include to cover detection through audit
- IP reputation scoring: Every incoming request carries an IP address. Services like IPQualityScore assign fraud scores (0-100) based on proxy history, VPN usage, and abuse patterns. Your dashboard should display these scores in real time and flag anything above your chosen threshold.
- Request rate anomaly flagging: Bots hit endpoints faster than humans. Track requests per IP per minute and surface any address exceeding normal patterns. A simple time-series chart showing spikes is enough to catch credential stuffing or scraping bursts.
- Headless browser fingerprinting alerts: Modern bots run headless Chrome or Puppeteer. Detection services check for telltale signs: missing plugins, uniform viewport sizes, or JavaScript execution timing inconsistencies. Your dashboard should show a distinct alert category for these.
- Blocked traffic log: A historical record of every blocked or challenged request, filterable by date, IP, threat type, and geographic origin. This is your audit trail and your training data for tighter rules over time.
| Component | What It Does | Key Data Points |
|---|---|---|
| IP Reputation | Scores each visitor's risk level | Fraud score, VPN flag, proxy type |
| Rate Anomaly | Detects abnormal request volumes | Requests/min, burst count, IP clusters |
| Browser Fingerprint | Identifies headless automation | Plugin count, WebGL hash, timing gaps |
| Blocked Log | Records enforcement actions | Timestamp, IP, rule triggered, action taken |
Following web application security best practices helps you verify none of these layers get missed during setup. The Rocket security checklist tutorial also walks through how to apply these layers inside a generated app.
With these four pillars defined, the next step is understanding how the scoring layer actually works under the hood.
How Does IP Reputation Scoring Flag Malicious Traffic?
IP reputation is the first line of defense because it catches known bad actors before they even interact with your application logic. When a visitor hits your app, you pass their IP to a reputation API, which checks it against databases of known proxies, VPN exit nodes, Tor relays, botnets, and previously flagged abusers, then returns a risk score and metadata.
- What the response includes: ISP name, connection type (residential, data center, mobile), VPN/proxy/Tor flags, abuse velocity rating, and a composite fraud score. IPQualityScore returns a score from 0-100 where anything above 75 signals high risk, per their Proxy Detection API documentation.
- Dashboard display: Show the fraud score as a color-coded badge next to each session. Aggregate scores into a histogram so you can spot when your average visitor risk creeps upward.
- Suggested starting thresholds (tune after a week of baseline data): A score above 85 is a reasonable starting point for automatic blocking; scores between 60 and 85 are a reasonable range for a CAPTCHA challenge. These are practical starting points, not IPQS's published tiers; adjust based on your traffic patterns.
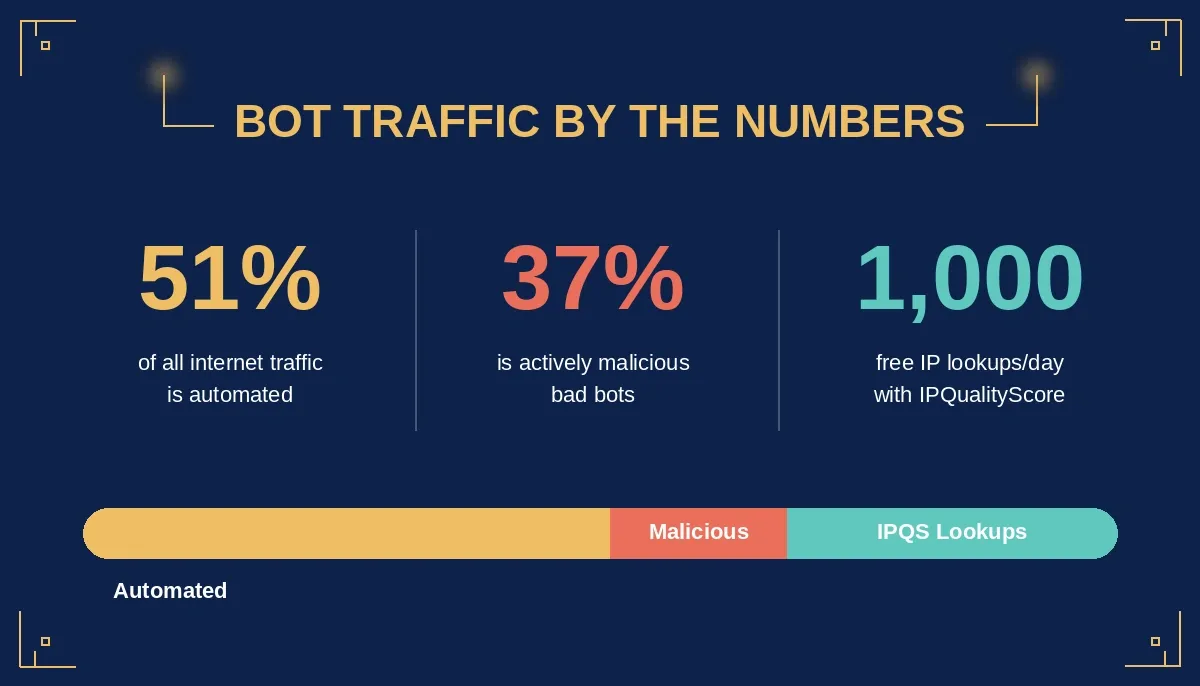
Key numbers that show why IP reputation scoring matters on every public-facing app
Bad bot traffic is not a small problem. Automated traffic now accounts for 51% of all internet activity, and over a third of that is actively malicious. IP reputation scoring is catching real, ongoing threats on virtually every public-facing app.
Pair this with Rocket's AI app builder to generate the server-side scoring logic and dashboard UI from a plain-language prompt, without writing a single API integration by hand.
Which Bot Intelligence APIs Work Best for This?
Two providers dominate the accessible tier of bot intelligence: Cloudflare Turnstile (free, challenge-based) and IPQualityScore (API-based scoring with a free tier of 1,000 lookups per day). The right choice depends on whether you need to protect interactive forms or score all traffic, including background API calls.
- Cloudflare Turnstile operates as a CAPTCHA replacement. It runs invisible challenges in the background, confirming visitors are human without friction. You embed a widget, and Turnstile returns a token you validate server-side. Best for login pages, signup forms, and checkout flows.
- IPQualityScore Proxy Detection API takes an IP address and returns a detailed risk profile in JSON. No widget needed. Best for backend scoring of every request, building threat dashboards, and feeding automated rules.
- When to use both: Turnstile protects interactive entry points. IPQS scores all traffic including API calls, webhooks, and background requests that never touch a form.
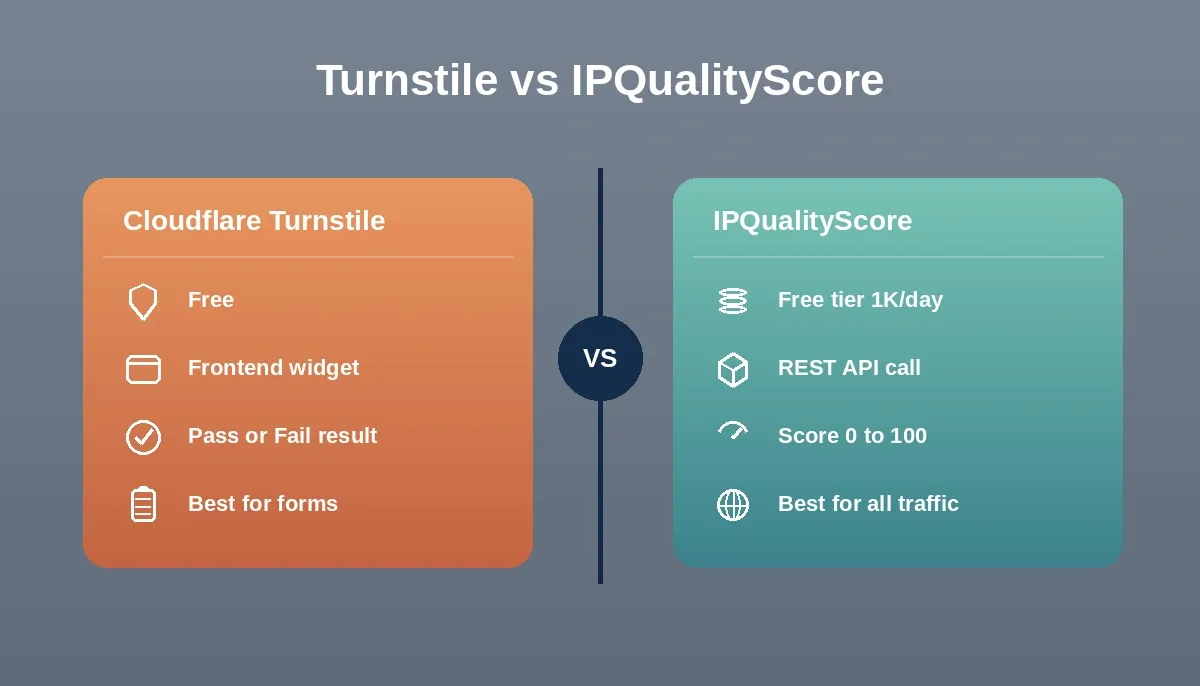
Turnstile is best for form protection; IPQualityScore is best for scoring all traffic, including API calls
| Feature | Cloudflare Turnstile | IPQualityScore |
|---|---|---|
| Pricing | Free | Free tier (1K/day), paid plans |
| Method | Frontend widget + server validation | REST API call per IP |
| Visibility | Binary (pass/fail) | Granular fraud score 0-100 |
| Best for | Form protection | Full traffic scoring |
| Headless detection | Yes (built-in) | Via device fingerprint add-on |
For a vendor-neutral taxonomy of the attack types these APIs defend against, the OWASP Automated Threat Handbook is the authoritative independent reference. Understanding threat categories before you configure thresholds makes your rules significantly more accurate from day one.
Knowing which API fits where is half the puzzle. The other half is actually building the dashboard that consumes their data. If you are also evaluating how Rocket compares to other builders for this kind of project, the Rocket vs Bolt comparison covers the key differences in full-stack generation capability.
From Scraped to Protected: Ship It Fast With Rocket
Most founders and product managers stall at this exact point. They know what to build, they know which APIs to call, but standing up a Next.js dashboard with server routes, database tables, and third-party connectors traditionally means hiring someone or spending weeks learning.
Rocket eliminates that gap entirely. It is a three-pillar platform: Solve, Build, and Intelligence, and the Build pillar is exactly what you need here: a full-stack AI app generator that produces production-ready Next.js applications with Supabase, native Twilio integration, and a generic REST API importer for any service not yet in the named connector library.
Step 1: Describe the dashboard in plain language. Tell Rocket you need a traffic monitoring panel with an IP reputation table, a request rate chart, and an alert configuration screen. It generates the full Next.js application with Supabase for persistence and server-side API routes ready for your IPQS key.
Step 2: Connect bot intelligence APIs through Rocket's REST API importer. IPQualityScore and Cloudflare Turnstile are not named connectors, but Rocket's generic API importer accepts any Postman collection, cURL command, or OpenAPI spec. Paste your endpoint, store your API key as an environment variable, and Rocket wires the authentication, handles response parsing, and maps the data into your dashboard components automatically.
Step 3: Add Twilio alerts in the same session. Twilio is a native connector in Rocket, used for SMS verifications, alerts, and notifications. Tell Rocket to send an SMS when bot traffic exceeds a threshold, it generates the Twilio integration, the webhook endpoint, and the threshold comparison logic without any manual configuration.
Step 4: Deploy in one click. Your bot monitoring dashboard goes live via Rocket's Netlify connector with SSL, a custom domain, and production-grade hosting. If you want to see this kind of build in action before starting, the Build demo shows the full generation flow live.
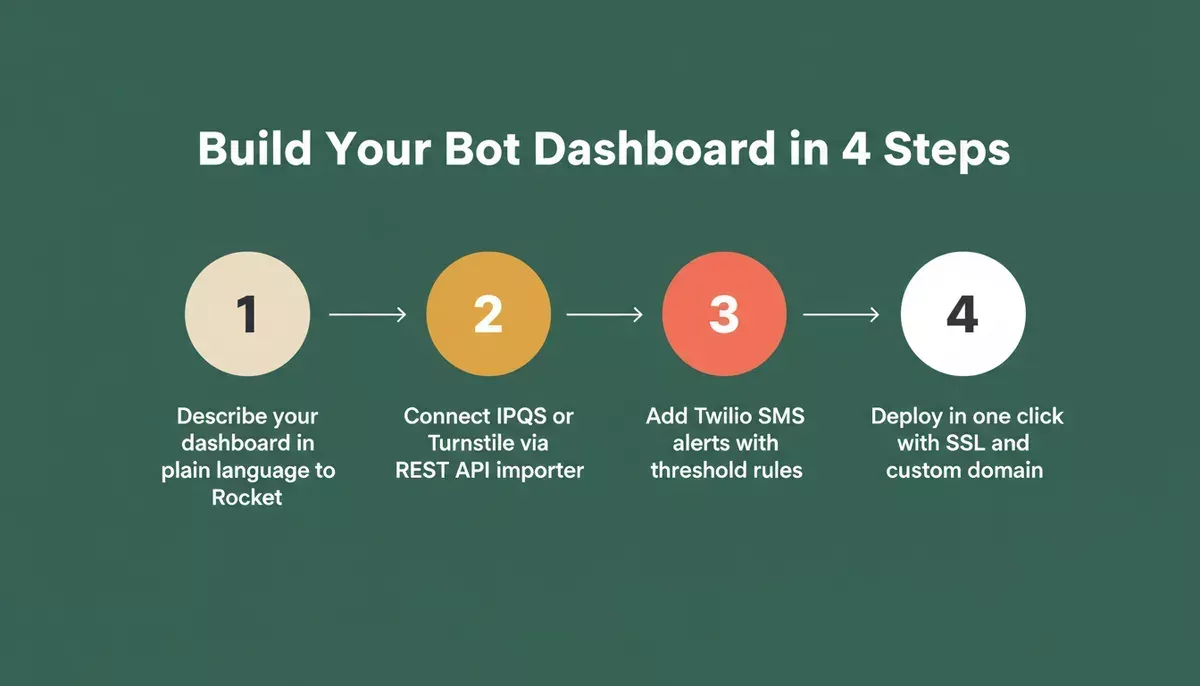 From plain-language prompt to deployed bot monitoring dashboard in four steps using Rocket
| Tool | What It Gives You | What's Missing |
|---|---|---|
| Retool | Dashboard UI | No custom server-side API scoring logic |
| Bolt / Lovable | Frontend code | Auth, database, and deployment left to you |
| Rocket | Full stack: Next.js + Supabase + Twilio + deploy | Nothing, ships the complete system |
Other approaches fall short because they hand you components, not a working system. Rocket ships the complete stack from a single conversation, and because it generates production-ready code, you own and can extend everything after deploy. Explore the full range of what you can build on the Rocket Build page.
How Do You Set Up Automated Alerts When Bots Spike?
Automated alerts are what turn a passive dashboard into an active defense system. The goal is to define thresholds, wire a notification channel, and log every trigger, so you only step in when the data tells you to.
- Step 1: Define your thresholds. Start with two rules: (1) if any single IP exceeds 100 requests per minute, flag it; (2) if overall bot-scored traffic crosses 30% of total requests in a 5-minute window, trigger an alert. You can refine these numbers after a week of baseline data.
- Step 2: Wire Twilio for SMS or voice alerts. Rocket generates a serverless function that checks thresholds on a cron schedule (every 60 seconds). When a threshold trips, it calls the Twilio API to send a message to your phone with the offending IP, its fraud score, and the rule that fired.
- Step 3: Log every alert in your blocked traffic table. Each notification also writes to your dashboard database, so you have a historical record. Over time, this log becomes your training data for tightening rules.
The same pattern- define metrics, set thresholds, connect notification channels- applies across any monitoring use case. The Rocket internal tools recipe shows how to extend this pattern to other operational dashboards beyond bot detection.
Bot detection flow: requests are scored, challenged, or blocked, and high-severity events trigger a Twilio SMS alert
Once alerts are live, your bot detection system runs on autopilot. You only step in when the data tells you to.
Your Traffic Deserves a Watchdog That Never Sleeps
Bot traffic is not a problem you solve once. It is a pattern you monitor continuously, with clear scoring, smart thresholds, and instant notifications pushing updates to your pocket.
The fastest path from "my app is getting scraped" to "I have a live monitoring system" runs through a single tool that handles your full stack. Rocket gives you IP reputation scoring, headless browser fingerprinting detection, rate anomaly tracking, and Twilio-powered alerts, all generated from a plain-language description, deployed in one click.
Ready to build your bot detection dashboard without writing a single line of security infrastructure? Start building on Rocket.new and have a working bot monitoring system live today.
Table of contents
- -What Does a Bot Detection Dashboard Actually Need?
- -How Does IP Reputation Scoring Flag Malicious Traffic?
- -Which Bot Intelligence APIs Work Best for This?
- -From Scraped to Protected: Ship It Fast With Rocket
- -How Do You Set Up Automated Alerts When Bots Spike?
- -Your Traffic Deserves a Watchdog That Never Sleeps