Retail Software Cost Estimator Website Template
This landing page template is built for retail quality management platforms that unify inspection checklists, supplier scorecards, and corrective-action workflows into one live dashboard. It uses a dark glassmorphic design with scroll-reveal animations, an interactive ROI calculator, and a frictionless two-step free-trial form. QA directors and VP ops leaders will recognize their world the moment the page loads.
by Rocket studio
Quick summary
This template delivers a scroll-reveal landing page for a retail quality management platform. It opens with a full-bleed glassmorphic hero dashboard, moves directly into an interactive ROI calculator, then progressively reveals four core feature modules. The design feels like a real control room: near-black surfaces, electric teal data accents, and frosted glass panels floating over deep obsidian. Every section is built to convert QA-focused buyers into free-trial signups.
Who this template is for
This dashboard template is designed for teams that live and breathe quality data every day. It speaks directly to buyers who need to present audit performance to leadership and to developers building or selling retail quality management software.
- QA directors at mid-market grocery chains managing 200-store networks
- Compliance managers at apparel brands tracking 40 or more overseas suppliers
- VP-level operations leaders who report audit pass rates to a board each quarter
What problem this template solves
Retail quality teams often rely on disconnected spreadsheets, email chains, and manual report compilations. The result is delayed visibility into defects, overdue tasks that slip through, and no single source of truth for performance data. This template gives the platform a landing page that directly addresses those pain points. Pain point sections address common retail issues such as inconsistent branding, missed supplier deadlines, and compliance gaps that damage customer satisfaction.
- No unified view of store-level compliance, supplier scorecards, and corrective actions
- Inability to show board-ready audit pass rate data without hours of manual compilation
- Visitors landing on the page cannot quickly determine the platform's real value without a persuasive, structured experience
What you get with this template
You get a complete, production-ready landing page layout that a development team can implement directly. Every section, interaction, and visual element is specified in the brief so nothing needs to be built from scratch. The template saves significant planning time and gives your team a clear build roadmap.
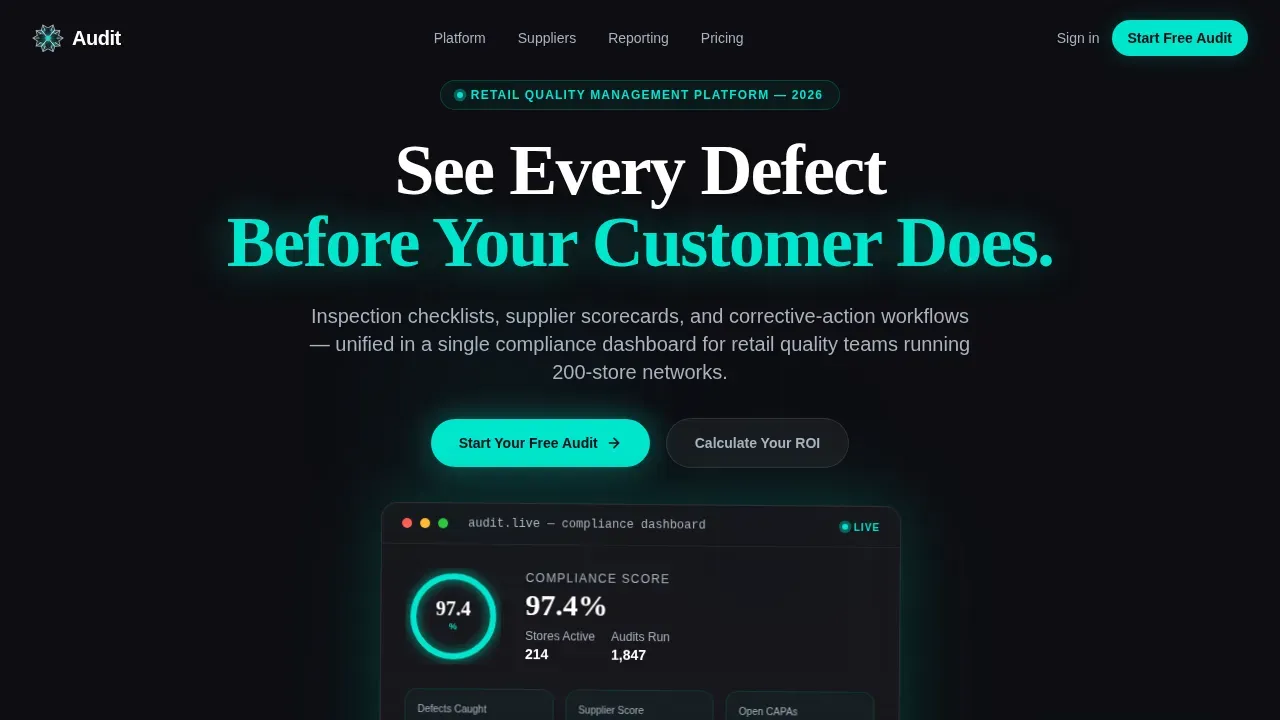
- A full-bleed hero section with an animated glassmorphic compliance dashboard card, radial progress ring, store counter, and teal micro-sparklines
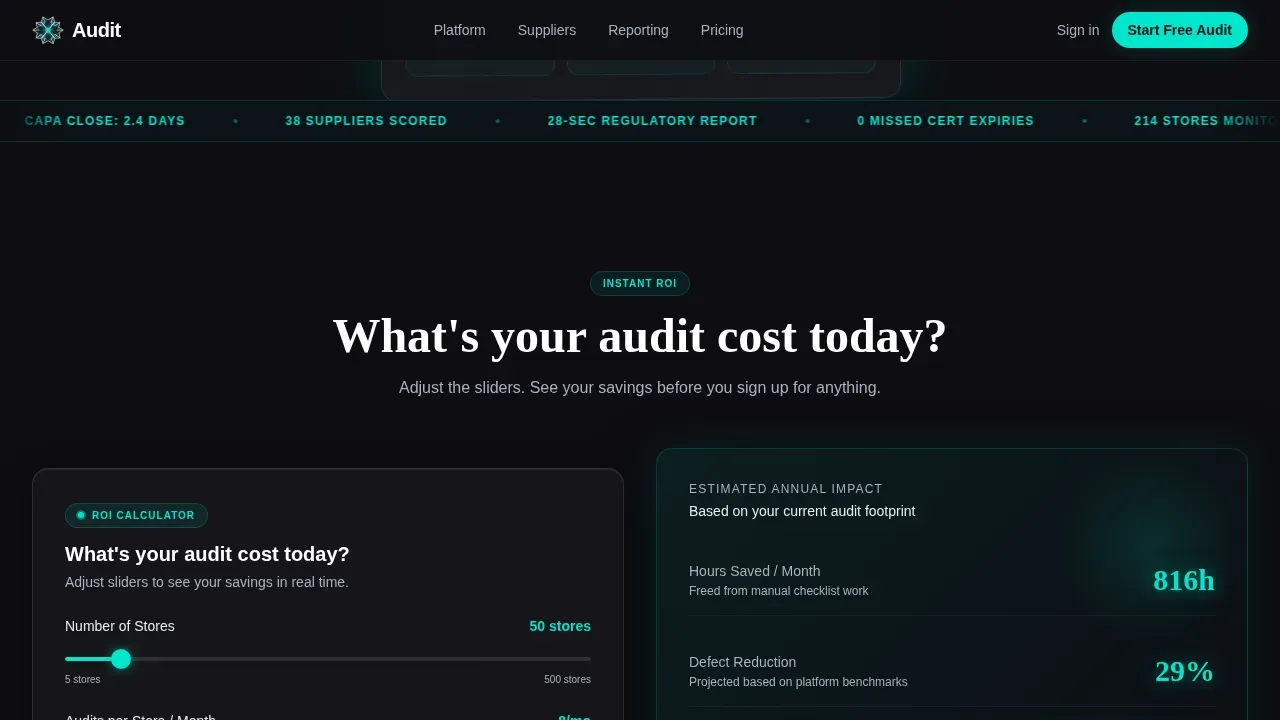
- An interactive ROI calculator with three slider inputs and an animated output card that recalculates savings in real time
- Four progressively revealed feature modules covering the audit builder, supplier scorecards, corrective-action workflow, and executive reporting suite
Feature list
This landing page template includes a carefully planned set of interactive and visual elements. Each feature serves a specific conversion or communication purpose grounded in the template brief.
Glassmorphic Hero Dashboard Card
The hero section consumes the full viewport with a near-black field. A single frosted glass dashboard card floats center-frame, softly lit at its edges with a teal bloom. The card animates on load: a radial compliance ring fills to 97.4%, a store counter ticks upward, and three micro-sparklines display declining defect trends. The product itself is the hero, with no stock photography or human faces. This approach lets the dashboard template communicate quality performance data before the visitor reads a single word.
Interactive ROI Calculator
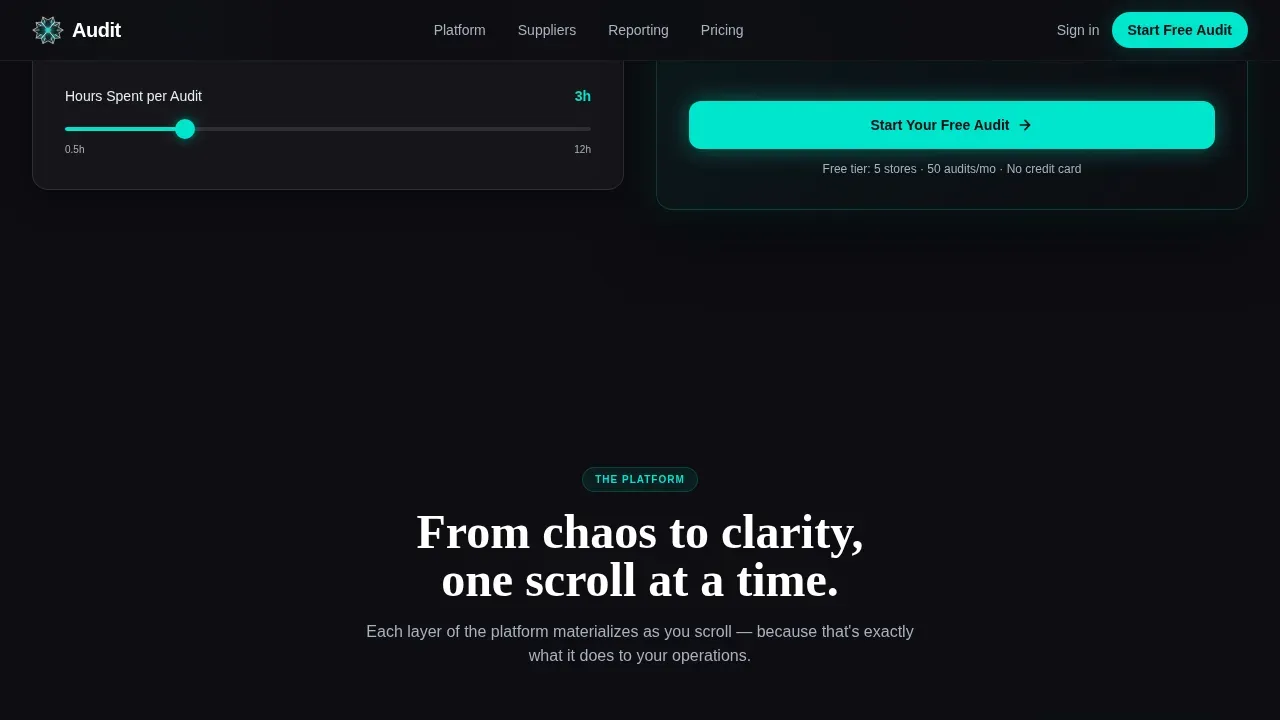
Directly below the hero, an ROI calculator slides into view before the visitor scrolls past the first section. Three slider inputs collect the number of stores, average audits per month, and current hours spent per audit. The moment a slider moves, the glassmorphic output card recalculates projected hours saved, estimated defect reduction percentage, and cost avoided. Teal number-flip animations display the results. This tool earns attention by delivering personal, role-specific value instantly, and it gives the visitor the right data to justify a trial signup.
Scroll-Reveal Feature Module Sequence
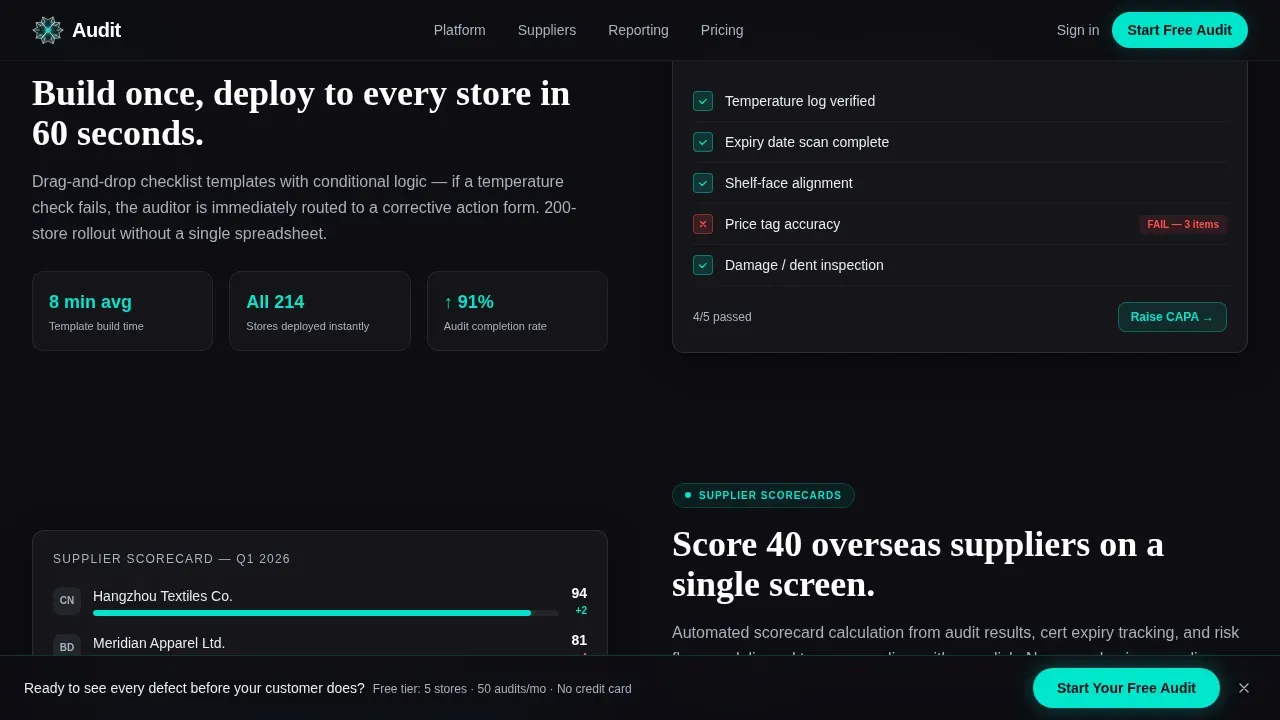
Four platform feature sections materialize from blur to clarity as the visitor scrolls. The audit builder appears first, followed by the supplier scorecard module, the corrective-action workflow, and the executive reporting suite. Each section uses GSAP ScrollTrigger animations that mirror the platform's promise: turning chaos into clarity. Dashboard examples within each module display key performance indicators in context, helping visitors visualize exactly what the live dashboard looks like in use.
Two-Step Freemium Signup Form
The primary call to action is "Start Your Free Audit." It appears beneath the ROI calculator and again in a persistent bottom bar after the third scroll section. Clicking opens a two-step form. Step one collects work email and company name. Step two asks for store count range and primary quality challenge via a dropdown. No credit card is required. The free tier includes five stores and fifty audits per month, stated clearly beside the form to reduce friction. The form is kept concise, requesting only essential fields to keep conversion rates high.
Benchmark Report Secondary Conversion Path
A secondary call to action offers visitors the ability to download a gated Retail QA Benchmark Report as a PDF. This path captures email and role for nurture sequences. It serves buyers who are not yet ready to commit to a free trial but want valuable insights about industry quality benchmarks. The secondary path runs parallel to the primary trial flow without interrupting it.
Persistent Bottom Bar Call to Action
After the visitor passes the third scroll section, a persistent bottom bar appears. It displays the primary "Start Your Free Audit" call to action at all times. This element ensures the conversion opportunity stays visible no matter how deeply the visitor reads into the feature content. The high-contrast teal button against the obsidian bar makes the action element easy to spot.
Page sections overview
| Section | Purpose |
|---|---|
| Hero Dashboard Card | Communicates compliance performance instantly with animated glassmorphic visuals |
| ROI Calculator | Delivers personalized savings data before the visitor scrolls away |
| Audit Builder Module | Shows how inspection checklists are structured and tracked |
| Supplier Scorecard Module | Displays supplier quality metrics and benchmarking tools |
| Corrective Action Workflow | Illustrates how defects are flagged, assigned, and resolved |
| Executive Reporting Suite | Demonstrates board-ready compliance report generation |
| Testimonials Section | Builds trust with role-specific performance metrics from QA personas |
| Free Trial Form | Converts visitors with a frictionless two-step signup experience |
| Benchmark Report Path | Captures emails from visitors not ready to start a trial |
| Footer | Provides navigation, links, and legal compliance context |
Design & branding system
The design system is built around a Dashboard Pro theme with a glassmorphic color system. Every visual decision reinforces the feeling of a live control room at midnight: authoritative, calm, and data-rich. The palette is purposeful and consistent across all sections. Typography pairs a functional sans-serif body font with a display headline typeface that adds gravitas to key statements.
- Color palette: deep obsidian (#0D0D12) base, electric teal (#00E5CC) for live-data accents and interactive elements, muted platinum (#A8B2C1) for secondary text and axis labels, frosted white panel borders at 12% opacity
- Typography: DM Sans for body copy and user interface text, Fraunces for display headlines throughout the page
- Visual treatment: glassmorphic frosted panels with backdrop-blur and subtle border-light, near-black backgrounds, teal glow on every interactive element, no stock photography
Mobile & speed optimization
The template is desktop-first in its design priority, reflecting the primary user context: QA directors checking data at 6 AM on a large monitor. However, the layout is also responsive to tablet devices so that field auditors can access key data from the store floor. Mobile responsiveness is critical for auditors who need the dashboard on the go. The template structure supports responsive compatibility across desktops, tablets, and mobile devices.
- Desktop-first layout with tablet-responsive breakpoints for field auditor use cases
- GSAP ScrollTrigger animations and Client Components handle interactive elements such as the ROI calculator and scroll-reveal modules
- Server Components are used for static sections to support fast initial rendering
How this template helps you convert
Every structural decision in this landing page template is built to move a quality-focused buyer from awareness to action. The page earns trust early, delivers personal value immediately, and removes friction at every signup step.
- The ROI calculator appears before the first scroll, giving the visitor personalized data about hours saved and cost avoided. This is a stronger opening than a static feature list, because it makes the value concrete before the visitor reads further.
- The persistent bottom bar call to action keeps the "Start Your Free Audit" option visible throughout the entire page. Combined with the clearly stated free tier details and the no-credit-card message beside the form, the page removes the two most common objections: uncertainty about value and fear of commitment.
Other information about this template
This section covers additional context that helps buyers and developers understand the full scope and intent of the template. Dashboards are essential tools for transforming data into business value, and different industries require tailored dashboards to effectively visualize and analyze their specific data. Dashboard examples across industries demonstrate how a well-structured kpi dashboard creates clarity faster than any spreadsheet. For example, sales dashboards present organized data to improve forecasting and monitor performance. Financial services dashboards allow for quick comparisons of revenue and margins to identify profitable customers. Manufacturing dashboards visualize plant operations and create efficiencies in supply chains. Healthcare dashboards help analyze patient care key performance indicators to uncover inefficiencies and improve patient outcomes.
This dashboard template is grounded in quality assurance dashboard best practices. Quality assurance dashboards help organizations track key performance indicators to ensure product quality and compliance. The top row of the kpi dashboard layout features high-level KPI cards with critical numbers. The bottom area includes detailed data tables for granular views. Interactive visualizations in the middle section provide trend analysis using a bar chart, a line chart, and other charts where relevant. Return rates broken down by reason, defect, or damage are crucial for identifying product quality issues. Inventory metrics such as Inventory Turnover, Stock-to-Sales Ratio, and Days of Inventory can be tracked. Operational efficiency metrics including Sales per Employee, Shrinkage Rate, and Order Fulfillment Rates appear throughout dashboard examples in this category.
From a data and reporting perspective, the dashboard must be connected to live data sources for real-time data updates. Data integration allows connections with multiple data sources into a single unified view. Contextual data allows for comparison of current performance with historical trends, which helps teams determine where improvement is most critical. Retail dashboards allow businesses to assess marketing campaigns, customer behavior, and inventory across large quantities of store locations. Using this dashboard template, teams can focus on making informed decisions rather than spending time transforming raw data into insights manually. Dashboard examples show that effective visualizations should highlight what matters most to stakeholders, making the right data visible at the right moment.
A google analytics integration example is a common comparison point when buyers evaluate dashboard tools. Google analytics provides traffic and marketing data, while a dedicated kpi dashboard for quality management focuses on operational performance. This template is designed specifically for the retail quality use case rather than general marketing analysis. For demonstration purposes, the hero card displays a 97.4% compliance score, a store counter, and sparklines. This gives the visitor a real picture of the dashboard experience before they sign up. Compared to other dashboards built for marketing or finance reporting, this template prioritizes defect tracking, supplier scoring, and corrective-action reporting as its core metrics.
For teams comparing this to a powerpoint template or a static report format, the key difference is interactivity and live data connection. A powerpoint template works well for one-time presentations, but a connected kpi dashboard lets teams monitor performance continuously. This template demonstrates that difference clearly through the hero animation and the ROI calculator. Buyers who currently manage quality processes through a powerpoint template or spreadsheet will recognize the operational gap immediately. The audit retail quality management dashboard pro landing page template is purpose-built for that moment of recognition, turning the visitor's pain into a clear call to action.
Additional elements worth noting for buyers and developers:
- The template uses a logical information hierarchy: hero, calculator, feature modules, testimonials, and trial form in that order
- Proactive alerts highlight when metrics fall below defined quality thresholds using color indicators
- Photo evidence capability is illustrated within feature module visuals, showing users how to upload images proving store standards compliance
- Customer experience metrics including Net Promoter Score (NPS), Customer Satisfaction Score (CSAT), and Conversion Rate are referenced in the executive reporting module section
- Quality assurance scorecards track staff performance and compliance rates within the supplier scorecard module
- Supplier performance metrics such as on-time delivery and product quality appear in the supplier scorecard dashboard examples
- The benchmark report download path is a secondary conversion that captures role data for nurture, without requiring a credit card
- A privacy policy link should be included beside the lead capture form to maintain compliance when collecting professional data
- Overdue tasks flagging is one of the corrective-action workflow elements shown in the feature module section
- The template can be customized to align with specific business needs, allowing for tailored visualizations and key metrics
- Dashboard examples in this niche benefit from responsive design so that retail managers can access data from any device
Theme
Dashboard Pro
Creative direction
Calculator/Tool First
Color system
Glassmorphic
Style
Scroll Reveal (Progressive)
Direction
Freemium/Trial
Page Sections
Glassmorphic Hero Dashboard Card
Interactive ROI Calculator with Live Output
Scroll-reveal Feature Module Sequence
Two-step Freemium Signup Form
Persistent Bottom Bar Call to Action
Secondary Benchmark Report Download Path
Related questions
What types of retail quality teams will get the most value from this template?
Does the free tier require a credit card to start?
How does the ROI calculator work on this landing page?
Can I download something if I am not ready to start a free trial?
What animations and interactive elements does this template include?



