AR-Enhanced Enterprise Software Cost Calculator Website Template
Augment is a dashboard-style landing page template built for AR-enhanced learning management systems targeting enterprise training teams. It opens with an interactive ROI calculator, then unfolds into a data-dense industry report layout. Deep indigo tones, live-pulse animations, and case study tiles make a compelling visual and evidential case for augmented reality in corporate training.
by Rocket studio
Quick summary
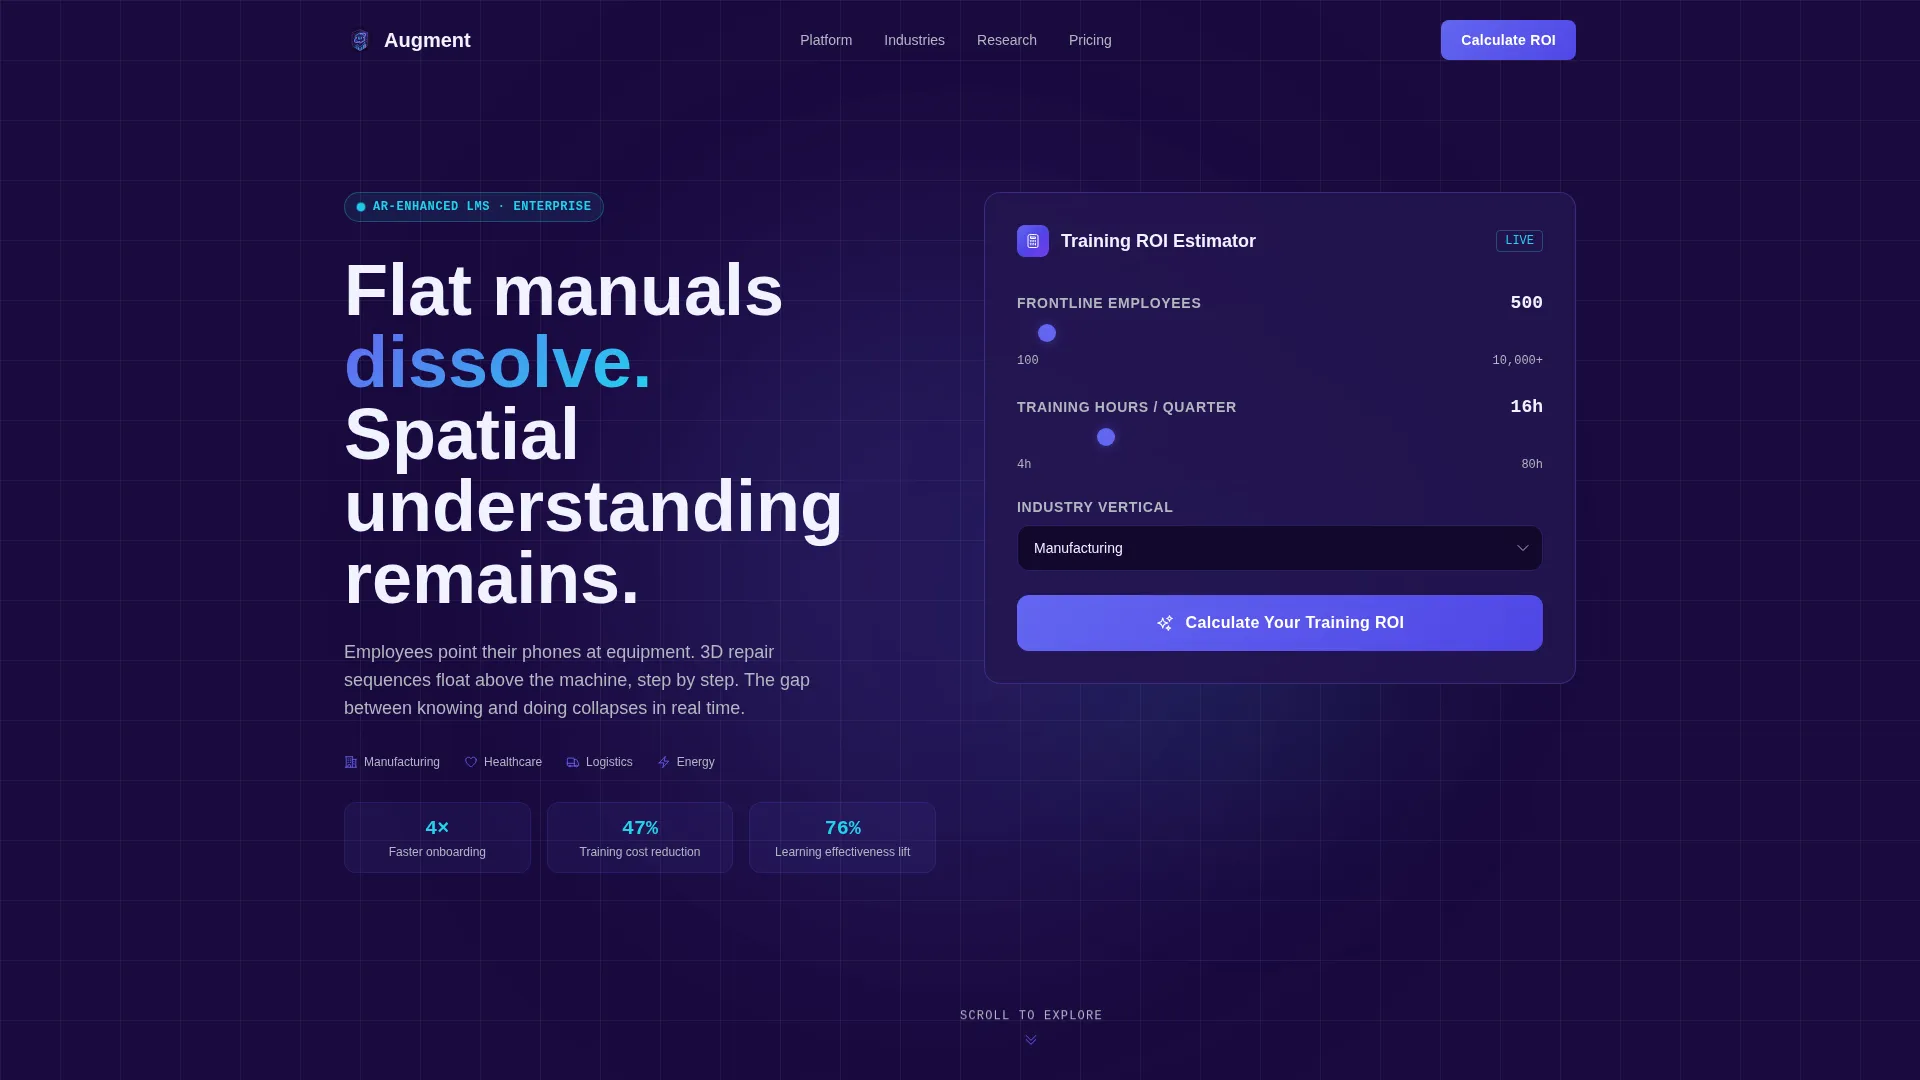
Augment is a single-page lead generation template designed for AR-enhanced corporate training platforms. It opens with an inline ROI calculator, then scrolls through research-backed stat blocks, skill decay timelines, and real-world case study tiles. The Dynamic Motion theme and Electric Indigo color system give every section the feel of a live holographic dashboard in a professional training environment.
Who this template is for
This template is built for enterprise software companies selling augmented reality training solutions to large organizations. It speaks directly to the people who approve training budgets and measure workforce performance outcomes.
- Learning and development directors at manufacturing firms with 500 or more frontline workers
- Healthcare systems onboarding surgical technicians on new medical devices
- Logistics companies that lose significant revenue annually to improper equipment handling
What problem this template solves
Traditional learning management system landing pages rely on feature lists and screenshots. They fail to communicate the gap between passive reading and applied skill. Buyers in manufacturing, healthcare, and logistics need hard evidence before committing to a platform change.
- Static pages cannot show the business cost of knowledge decay or poor training completion
- Visitors leave without understanding their own ROI, making the offer feel abstract
- Generic lead forms interrupt before value is demonstrated, killing conversion momentum
What you get with this template
You get a fully structured, single-page layout that guides enterprise buyers from curiosity to captured lead. Every section builds the case with data before asking for anything in return.
- An interactive ROI estimator that calculates projected savings based on the visitor's own inputs
- A scrollable industry report layout with stat blocks, a skill decay timeline, and case study tiles
- A gated benchmark report flow that reveals full ROI breakdowns only after email capture
Feature list
This template combines interactive data components, animated visuals, and a persuasive editorial structure into one cohesive layout.
Interactive ROI Calculator Header
The page opens with a three-question inline estimator. Visitors enter their number of frontline employees, quarterly training hours, and industry vertical from a dropdown covering manufacturing, healthcare, logistics, and energy. On submission, the dashboard animates to display projected training time reduction in hours and dollars, a knowledge retention lift percentage, and an estimated incident rate decrease.
Live-Updating Data Cards
Calculator results render as animated data cards with indigo gradient fills. Each card pulses with micro-animations that make the numbers feel active rather than static. A subtle three-dimensional wireframe of a warehouse floor rotates slowly in the background, with augmented reality annotation points flickering into view around it.
Industry Report Scroll Layout
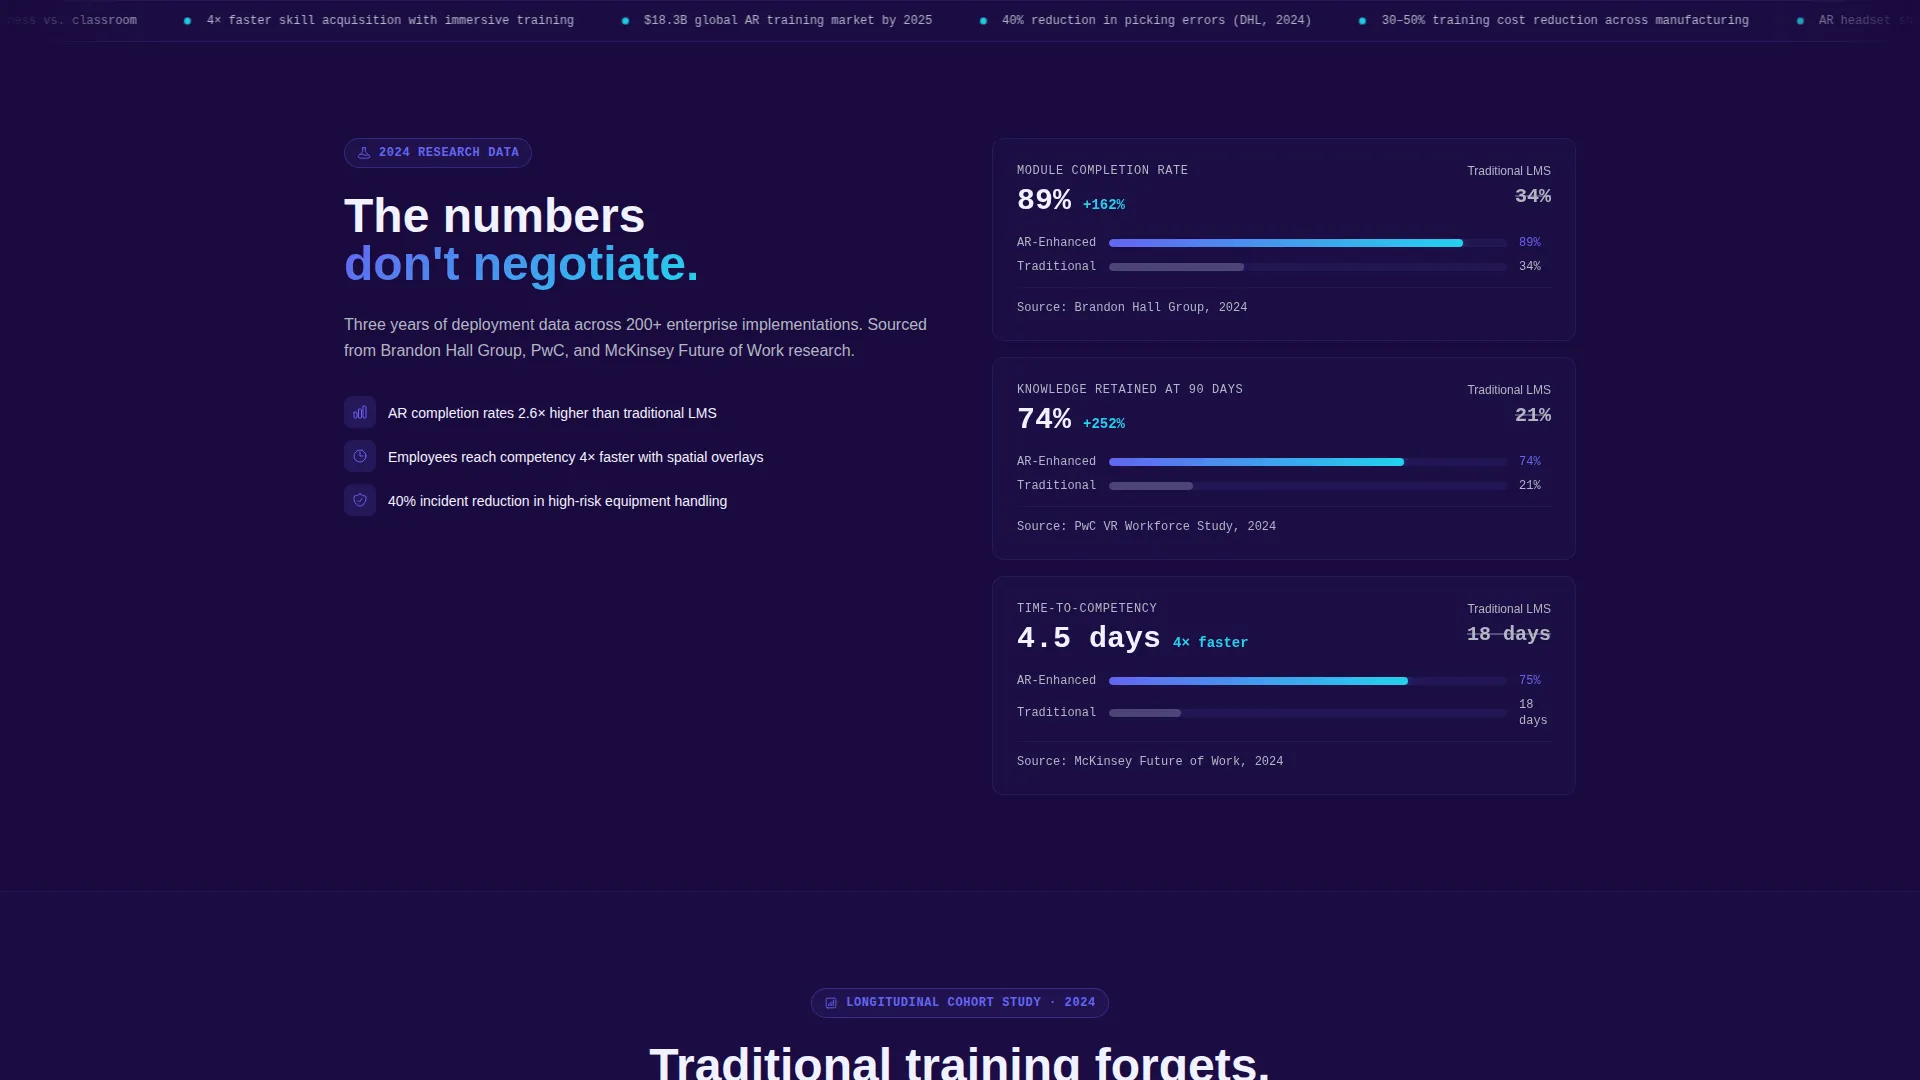
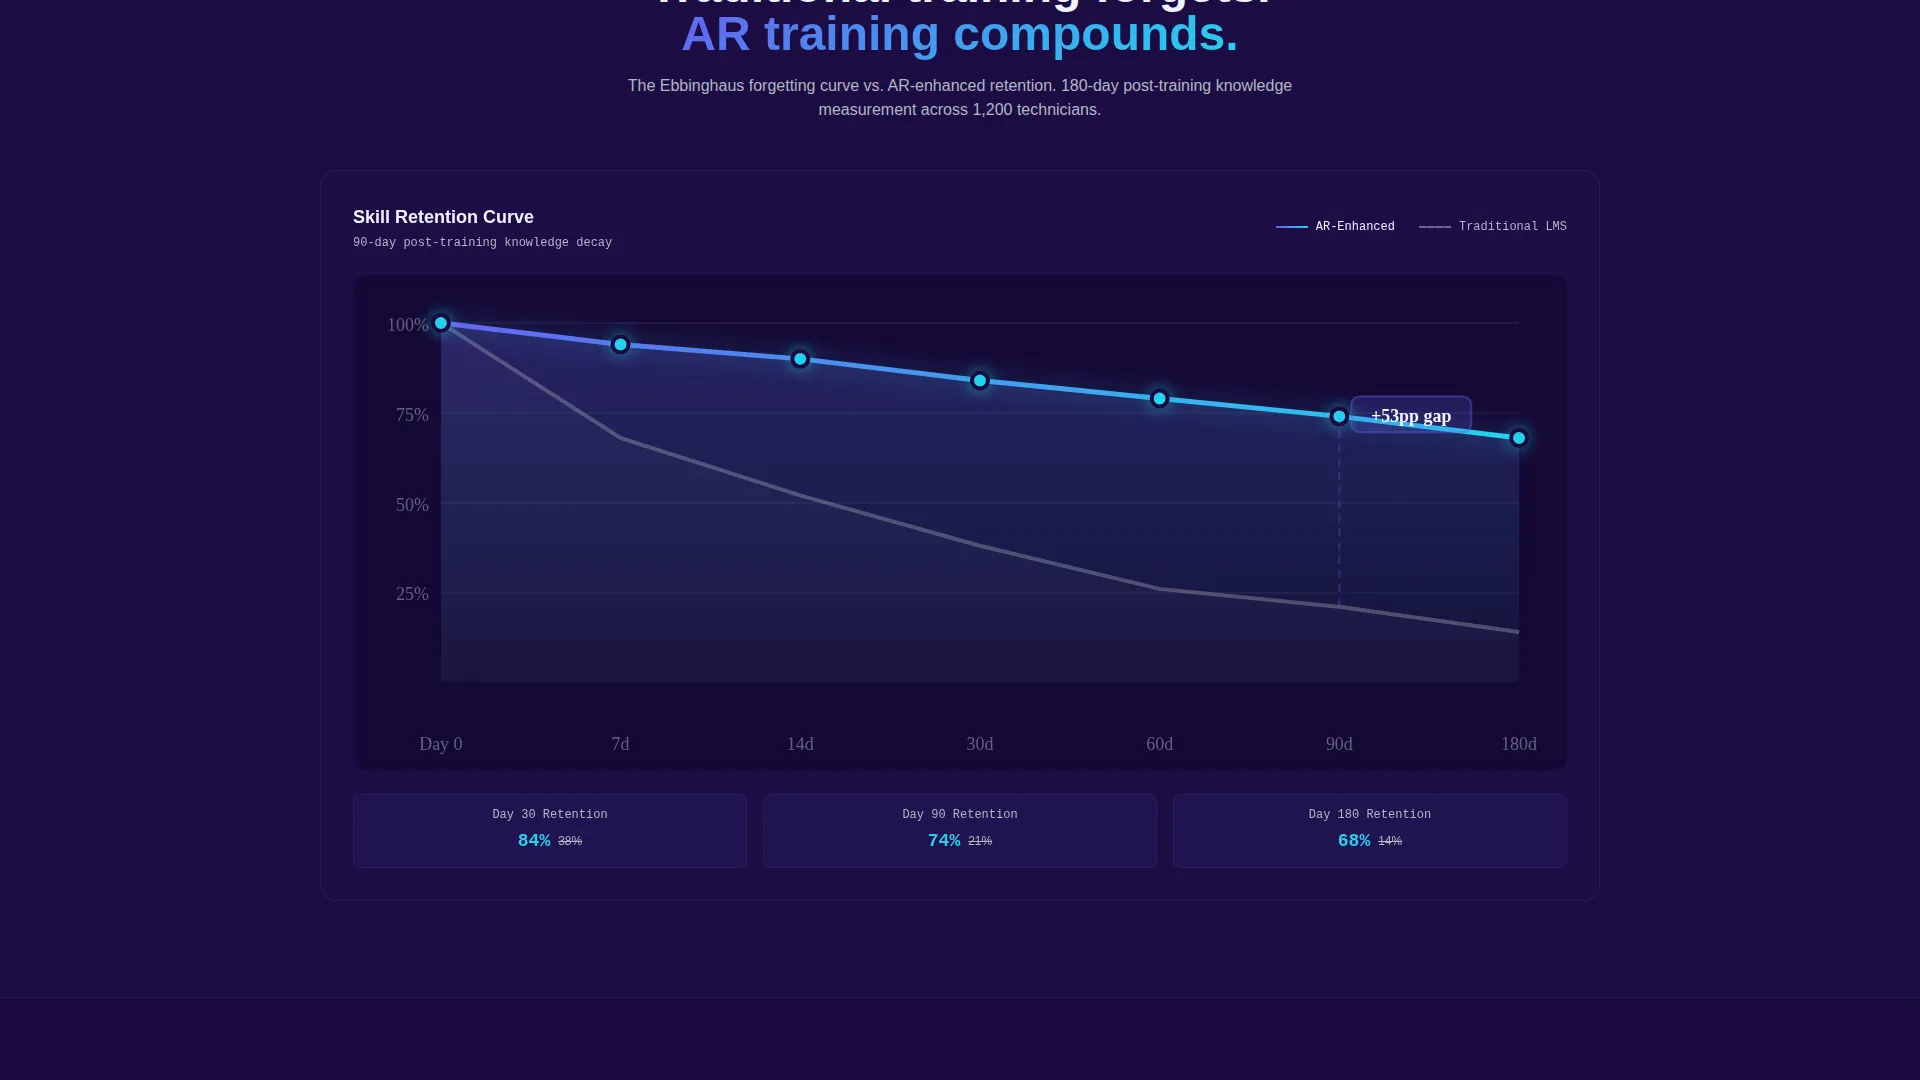
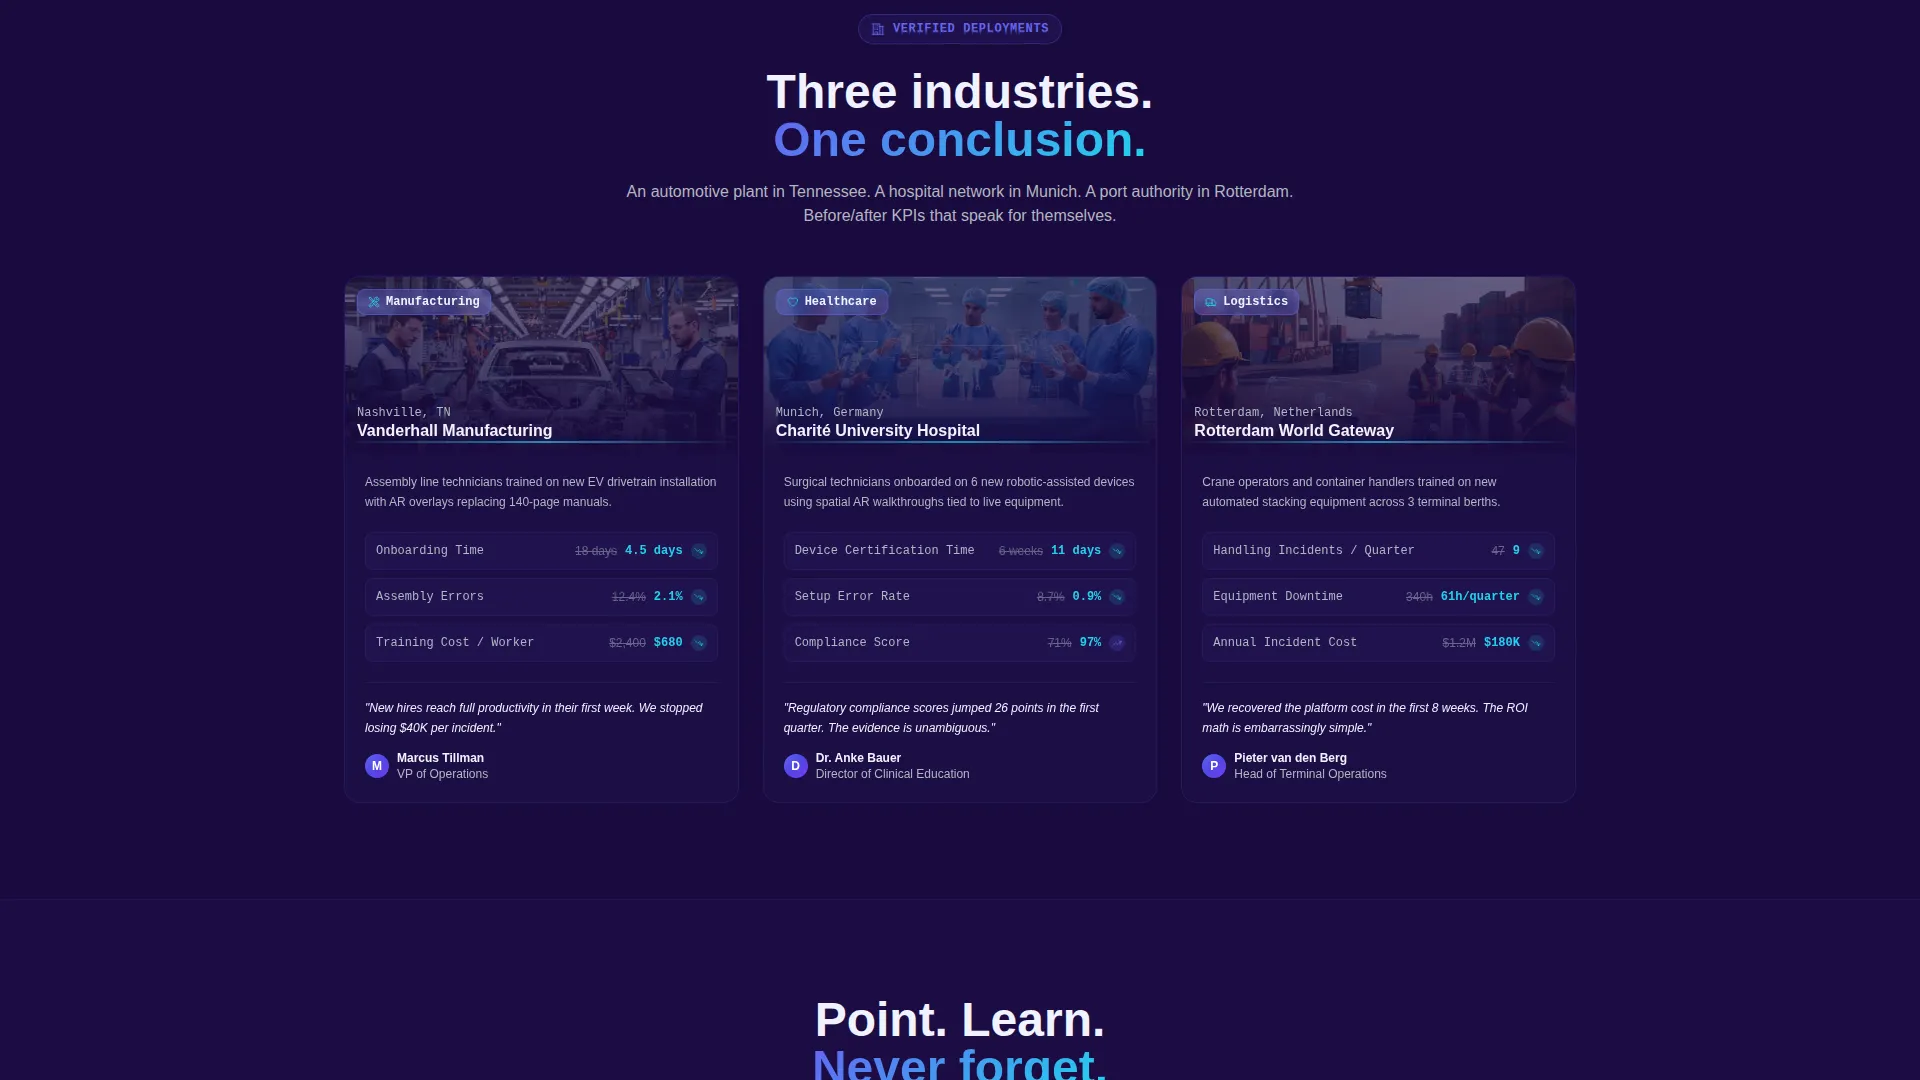
Scrolling past the calculator reveals a data-dense card grid structured like a professional research report. The first row compares traditional learning management system completion rates against AR-enhanced module results. A horizontal timeline in the second row shows skill decay curves, with the AR cohort line rising while the control group declines. The third row presents case study snapshots from an automotive plant, a hospital network, and a port authority.
Case Study Dashboard Tiles
Each case study is presented as a mini dashboard tile with before-and-after key performance indicators. Real-world locations ground the data: a manufacturing plant in Tennessee, a hospital network in Munich, and a port authority in Rotterdam. The format mirrors an executive briefing rather than a marketing testimonial.
Partial Reveal and Email Gate
The ROI estimator intentionally shows partial results upfront. The full breakdown unlocks only after the visitor submits a work email, company size range, and an optional current learning management system field. This sequence turns the form into a continuation of the experience rather than a barrier.
Sticky Secondary Call to Action
After the visitor scrolls past the first section, a sticky call-to-action bar appears reading "Get the Full Benchmark Report." It stays visible throughout the scroll, offering a consistent conversion point without interrupting the reading flow.
Page sections overview
| Section | Purpose |
|---|---|
| ROI Calculator Header | Capture attention with personalized savings estimates |
| Animated Results Dashboard | Visualize training time and cost projections |
| Completion Rate Stat Blocks | Compare traditional versus AR-enhanced training outcomes |
| Skill Decay Timeline | Show knowledge retention curves over time |
| Case Study Tiles | Ground claims in real-world before-and-after data |
| Benchmark Report Gate | Convert engaged visitors into qualified leads |
| Sticky call to action Bar | Maintain a persistent conversion path while scrolling |
Design & branding system
The Electric Indigo color system is built to feel like a live holographic projection. Every color in the palette serves a functional purpose, not a decorative one.
- Deep void indigo (#1A0A3E) forms the primary background, creating an immersive darkened-bay atmosphere
- Electric indigo (#6366F1) radiates from interactive elements and data card highlights, while cool titanium (#B0B8C1) handles secondary text and grid lines
- Reactive cyan (#22D3EE) fires on hover states and live data pulses, signaling interactivity throughout the scroll
Mobile & speed optimization
The template layout is designed to remain clear and functional at smaller screen sizes. Dashboard tiles and stat blocks reflow gracefully so mobile visitors can still engage with the calculator and read the data sections without horizontal scrolling.
- The inline ROI calculator is touch-friendly, with dropdowns and input fields sized for mobile use
- Data cards and case study tiles stack vertically on smaller screens, preserving readability
- Micro-animations are scoped to visible elements, keeping the visual experience focused on content rather than background noise
How this template helps you convert
Every structural decision in this template is built to move a skeptical enterprise buyer from first impression to a submitted lead form.
- The ROI calculator personalizes the value proposition immediately. Visitors see their own projected savings before any pitch copy appears, making the offer feel relevant rather than generic.
- The industry report scroll builds an evidential wall. Each section adds a new layer of data, moving the visitor from interest to conviction through sourced statistics, decay curves, and real-world case snapshots.
- The partial reveal gate exchanges full results for a work email. Because the visitor has already seen partial numbers, submitting their details feels like unlocking something they earned rather than filling out a cold form.
Other information about this template
This template is part of a broader category of high-intent enterprise software landing pages designed to serve complex, considered-purchase sales cycles. A few additional notes for teams evaluating it:
- The template style is Dashboard and Data Grid, suited to platforms where data credibility is central to the buying decision
- The Dynamic Motion theme uses controlled animation to signal product sophistication without overwhelming informational content
- The creative direction follows an Industry Report format, which aligns well with the buying habits of learning and development directors who regularly consume analyst-style research
- The template is categorized under Technology, specifically within the AR-Enhanced Enterprise Software subcategory, making it relevant for teams positioning next-generation workforce training tools
Theme
Dynamic Motion
Creative direction
Industry Report
Color system
Electric Indigo
Style
Dashboard/Data Grid
Direction
Lead Generation
Page Sections
Interactive ROI Estimator
Animated Data Dashboard Cards
Industry Report Scroll Sections
Case Study Mini Dashboards
Partial Reveal Lead Gate
Sticky Benchmark Report Call to Action
Related questions
Who is the primary audience for this template?
Can I customize the calculator inputs and result metrics?
How does the partial reveal lead gate work?
Is this template designed for a single product or a full software platform?
What does the Dynamic Motion theme add to the page experience?



