Nonprofit Software Specialist Cost Calculator Website Template
Claims is a modular landing page template built for nonprofit claims management firms. It features a live recovery calculator in the header, a data-card grid styled like a proprietary industry report, and a dual lead-generation path. The template is designed to turn overlooked reimbursement numbers into compelling visual proof before a visitor ever scrolls.
by Rocket studio
Quick summary
Claims is a single-page lead generation template for nonprofit claims recovery firms. The header opens with an interactive calculator that projects recovered-dollar estimates in real time. Below it, a modular card grid presents denial and recovery data like a classified research report. The design runs on a dark, iridescent palette that feels technological and urgent throughout.
Who this template is for
This template is built for organizations that help nonprofits recover revenue from denied, underpaid, or overlooked claims. It speaks directly to the financial decision-makers those firms serve.
- Hospital chief financial officers at faith-based and independent health systems
- Grant administrators and finance directors at social service agencies and large foundations
- Claims recovery consultancies and nonprofit billing firms seeking qualified leads
What problem this template solves
Many nonprofit claims recovery firms struggle to communicate the scale of lost revenue quickly enough to earn a conversation. Visitors leave before they feel the urgency. This template solves that by leading with motion and numbers, not words.
- Visitors cannot quantify their own potential loss until they interact with something that shows them a real figure
- Static pages fail to communicate the compound nature of denial rates, recovery timelines, and payer-mix impact
- Prospective clients who are not ready to call still leave without any connection point
What you get with this template
This template delivers a complete single-page layout built around two conversion paths and one central creative argument: your organization is almost certainly leaving money behind. Every section is designed to build that case progressively.
- A live calculator header with organization type selector, annual claims volume input, and an animated denial-rate slider
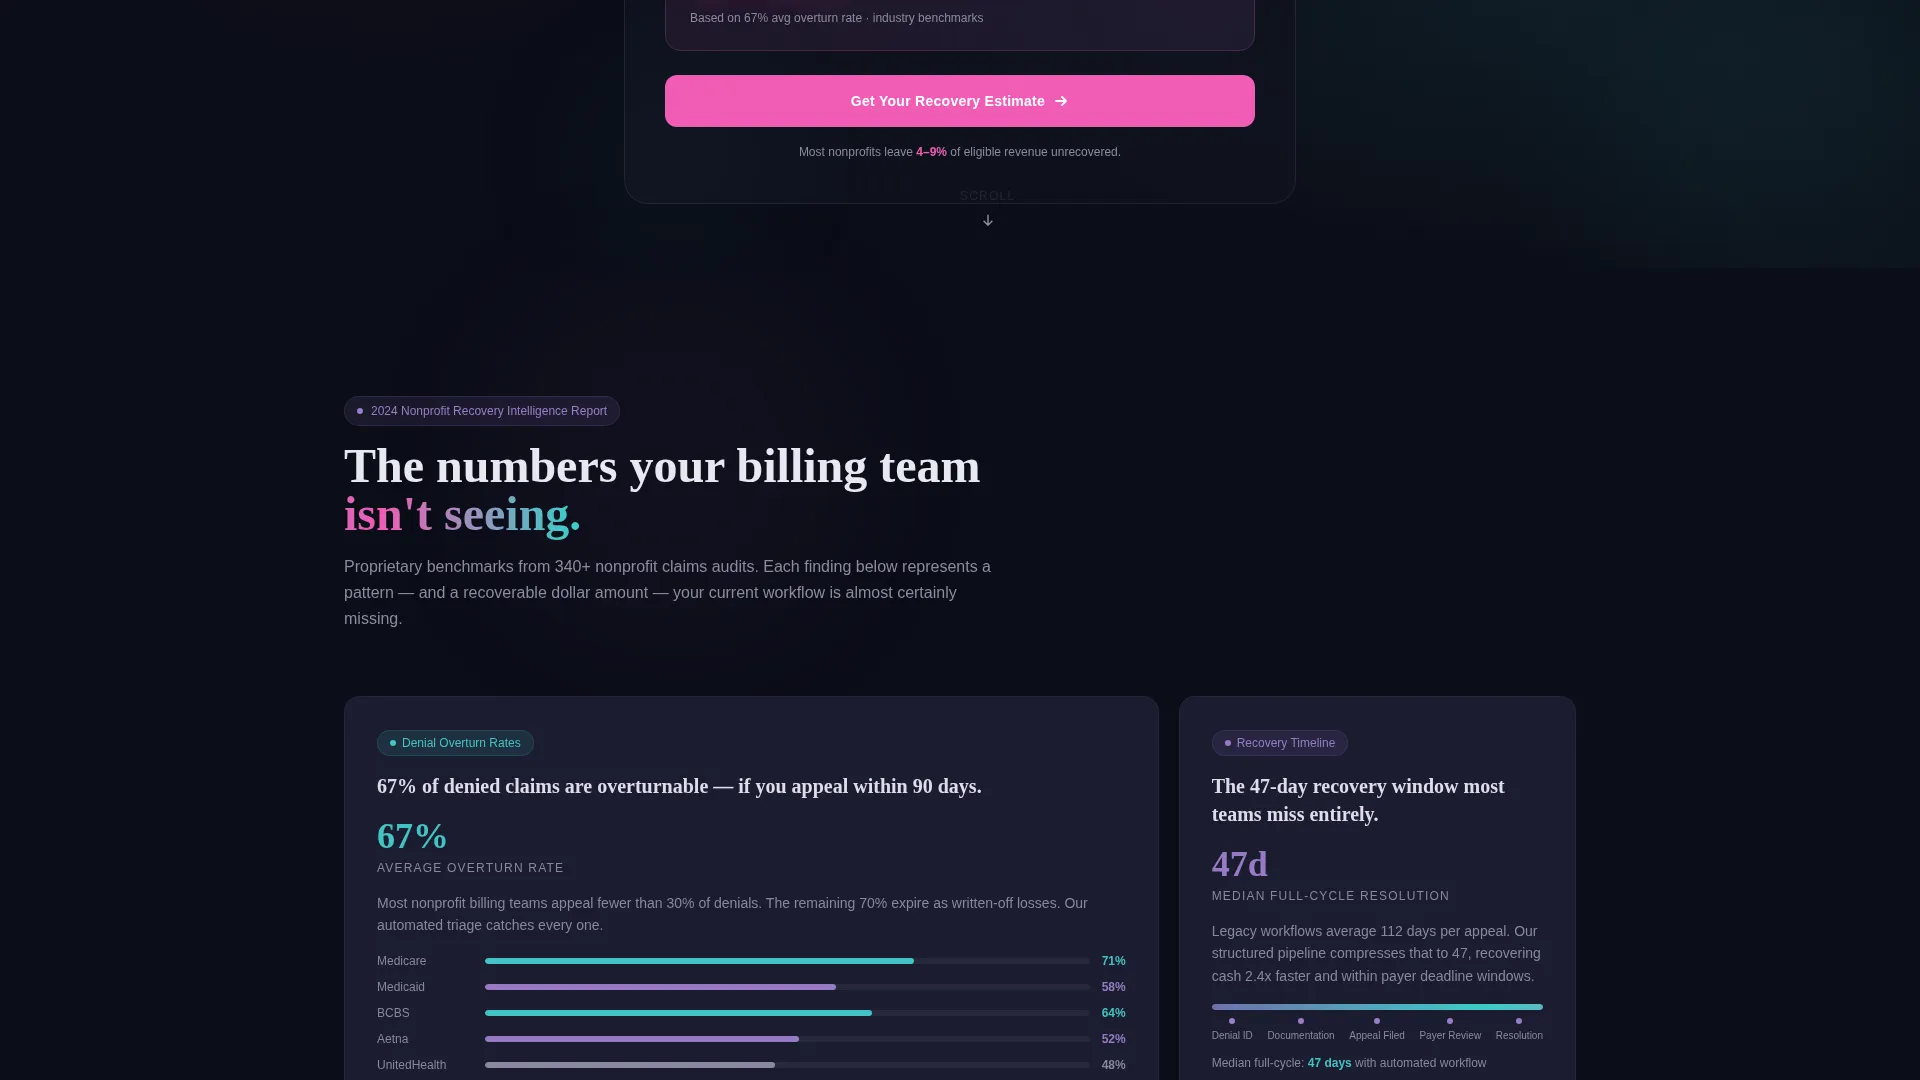
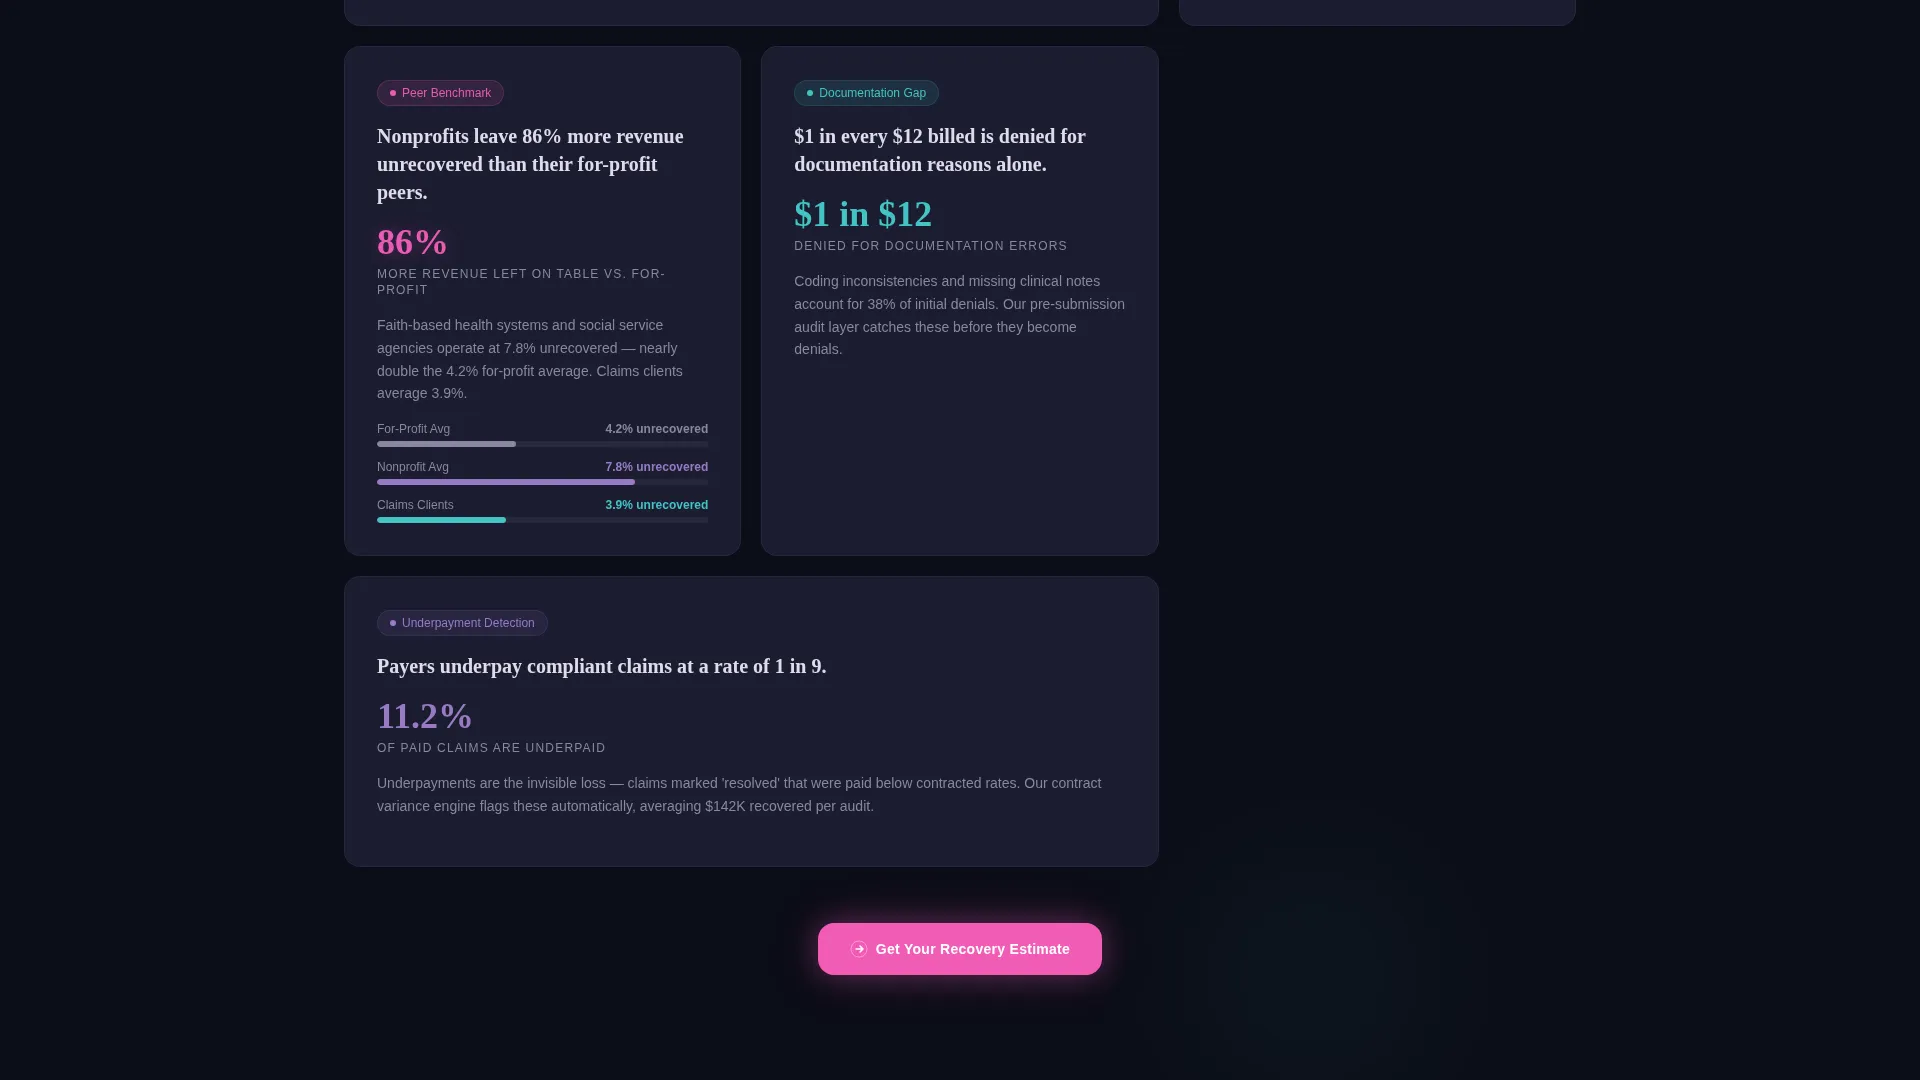
- A staggered card grid presenting denial overturn rates, recovery timelines, and nonprofit-versus-for-profit benchmark comparisons
- A primary lead form capturing organization name, claims volume, payer mix, and work email, plus a secondary email-gated benchmark download
Feature list
This template is built from the prompt up as a purposeful evidence machine. Each feature below serves the single goal of turning a skeptical finance director into an engaged lead.
Live Recovery Calculator Header
The header centers a dark glass panel calculator in the viewport. Visitors select their organization type, enter annual claims volume, and drag a denial-rate slider. Projected recovery figures animate upward in iridescent pink with easing curves, delivering a dollar estimate before the visitor is asked for anything.
Staggered Data Card Grid
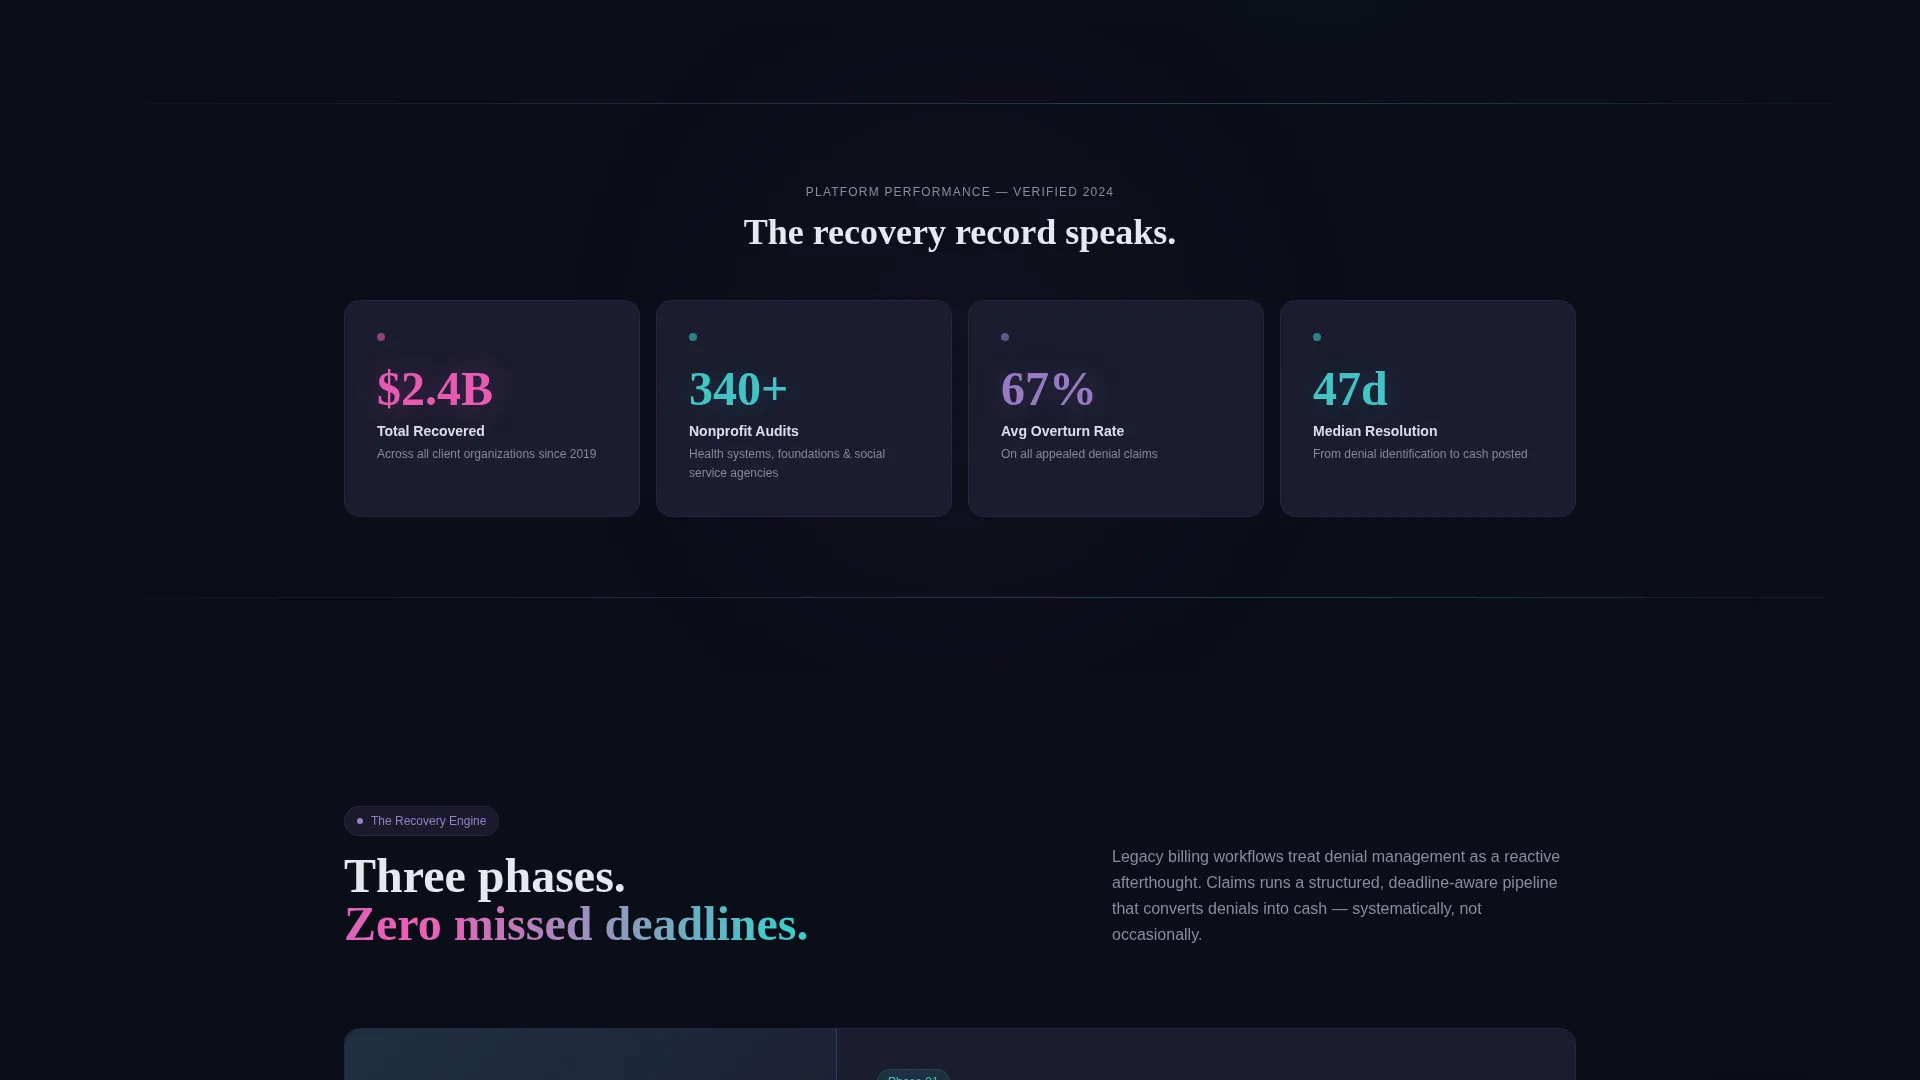
The card grid below the calculator is modular and self-contained. Each card reads like a page from a proprietary white paper. Card one shows denial overturn rates by payer, card two maps average recovery timelines, and card three benchmarks nonprofit losses against for-profit peers. Cards animate into the viewport with staggered parallax drift and a faint iridescent shimmer.
Dual Lead Generation Paths
The primary call to action, "Get Your Recovery Estimate," appears inside the calculator and repeats as a floating button after every third card. A secondary path offers a downloadable 2024 Nonprofit Recovery Benchmark behind an email gate, capturing leads who prefer to research before committing to a conversation.
Dynamic Motion Theme
The page opens with motion before the first scroll. Animated dollar projections, parallax card entrances, and iridescent shimmer trails all reinforce the core message: money is moving, and it should be moving toward the visitor's organization. Motion is a design argument, not decoration.
Industry Report Creative Direction
Every card is styled like a torn page from a classified research document. The scroll experience feels like flipping through increasingly specific findings. Each module builds the evidence case with more urgency and precision than the last, creating a rhythm of growing alarm and growing confidence.
Floating Repeat call to action
The primary call to action does not rely on a single placement. It floats back into view after every third card, ensuring that a visitor who becomes convinced mid-scroll can act immediately without hunting for a form.
Page sections overview
| Section | Purpose |
|---|---|
| Calculator Header | Animate recovery projections live |
| Subheader Stat Line | Anchor the 4 to 9 percent loss claim |
| Denial Overturn Card | Show payer-level overturn rate data |
| Recovery Timeline Card | Map average time-to-recovery benchmarks |
| Nonprofit versus. For-Profit Card | Benchmark losses against sector peers |
| Floating call to action Button | Repeat primary lead-gen action |
| Primary Lead Form | Capture qualified organization details |
| Benchmark Download Gate | Capture research-stage email leads |
Design & branding system
The visual identity follows a Dynamic Motion theme built on an AI Iridescent color system. The palette is designed to feel like light refracting through a prism placed on a server room floor: technological, alive, and slightly otherworldly.
- Deep void black (#0B0D17) dominates all backgrounds; spectral violet (#7B5EA7) washes card surfaces as a translucent overlay; shifting teal (#3DCCC7) carries body text links and progress indicators
- Hot iridescent pink (#F15BB5) fires only on hover states, call-to-action buttons, and the most urgent recovery figures, reserving maximum visual impact for the moments that matter most
- The overall tone is dark, precise, and kinetic, designed to feel like proprietary financial intelligence rather than a standard nonprofit vendor page
Mobile & speed optimization
The modular card grid and calculator panel are structured to reflow cleanly on smaller screens. The layout prioritizes the calculator interaction and the primary call to action at every viewport width.
- The staggered card animations are designed to preserve their entrance effect on mobile without requiring horizontal scroll or layout breakage
- The floating call-to-action button remains accessible and visible as the visitor scrolls through the card grid on any device size
How this template helps you convert
The conversion strategy is built on a simple principle: show a dollar figure before asking for a name. Every layout decision supports that sequence.
- The calculator delivers a personalized recovery estimate first, earning trust before the lead form appears, which removes the most common objection to filling out a form
- The card grid builds a progressive evidence case across multiple data findings, so by the time a visitor reaches the primary form, the urgency has been established through data, not claims
- The secondary benchmark download provides a lower-commitment entry point for finance directors and grant administrators who need internal justification before engaging directly
Other information about this template
This template sits at the intersection of nonprofit software and financial recovery technology. It is designed for a niche where trust is earned through specificity and motion, not generic promises.
- The template style is Card Grid (Modular), making individual data cards easy to update, reorder, or expand as new benchmark data becomes available
- The header concept is a Calculator or Estimator, a format that has proven effective for high-consideration B2B services where buyers need to see value quantified before committing
- The creative direction is Industry Report, which positions the firm as a source of authoritative sector intelligence rather than just a vendor
- The landing page direction is Lead Generation, with two distinct capture paths designed to serve prospects at different stages of readiness

Theme
Dynamic Motion
Creative direction
Industry Report
Color system
AI Iridescent
Style
Card Grid (Modular)
Direction
Lead Generation
Page Sections
Live Recovery Calculator
Staggered Data Card Grid
Dual Lead Capture Paths
Floating Repeat Call to Action Button
Dynamic Motion Visual Theme
Industry Report Card Styling
Related questions
Who is this landing page template designed for?
Can I update the data inside the cards?
What does the calculator in the header actually do?
What are the two lead capture paths in this template?
Does the floating call-to-action button appear throughout the page?



