Neuromorphic Research Lab Landing Page Template
Synapse is a split-screen landing page template built for neuromorphic computing research labs. It pairs cinematic data visualizations with journal-style copy to communicate hard benchmarks, synaptic plasticity research, and a free simulation path. The Dynamic Motion design system, frosted-glass panels, and event-driven animations make dense technical content feel precise and alive.
by Rocket studio
Quick summary
Synapse is a single-page template designed for a neuromorphic computing research lab. It uses a 50/50 split-screen layout to pair live data visuals with analytical copy. Every section is crafted to earn credibility with technical audiences and guide them toward a free sandbox trial or benchmark download.
Who this template is for
This template is built for teams working at the frontier of brain-inspired computing. It speaks directly to people who evaluate hardware on benchmarks, not marketing claims.
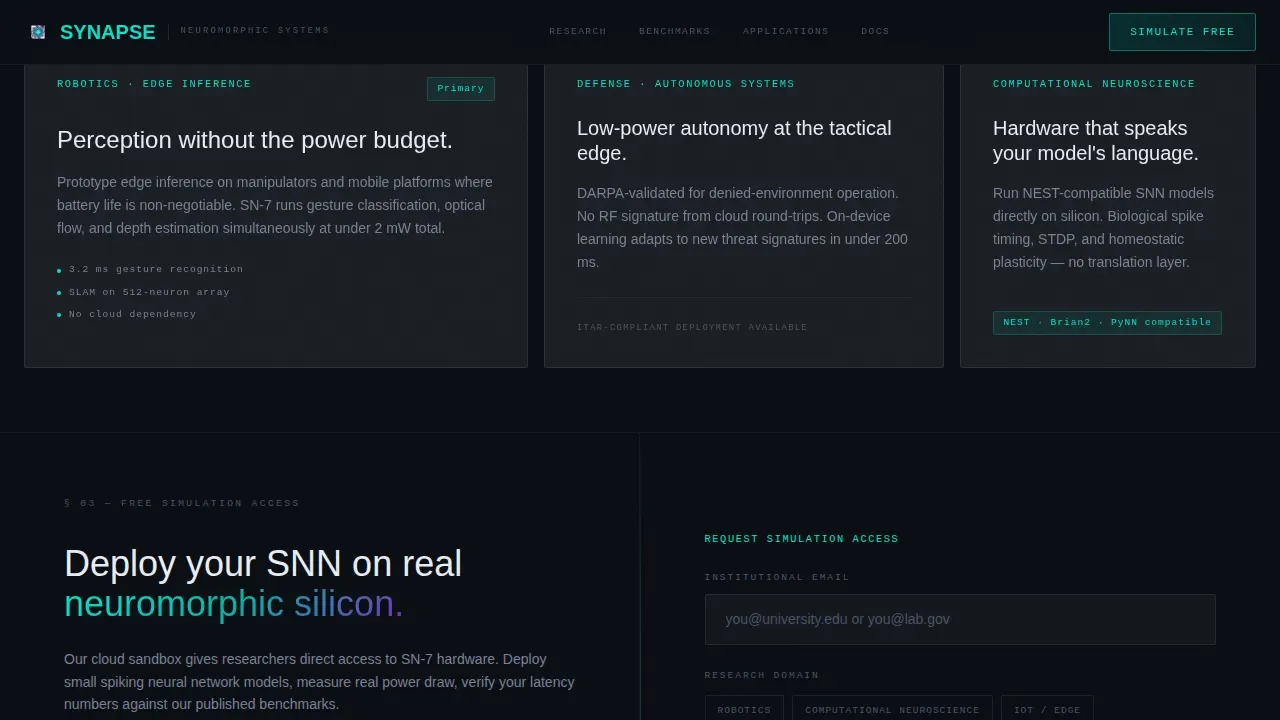
- Robotics engineers prototyping edge inference on low-power neuromorphic hardware
- Computational neuroscientists who need a chip architecture that aligns with their spiking neural networks models
- Defense contractors and procurement leads assessing autonomous systems that learn on-device without cloud round-trips
What problem this template solves
Neuromorphic computing research is technically rich but visually underserved. Most lab pages fail to communicate the gap between traditional computing and brain-inspired approaches in a way that converts serious researchers into trial users.
- Conventional research pages bury benchmarks in PDFs, losing the engineers who need to verify numbers fast
- Generic templates cannot carry the weight of interdisciplinary work combining neuroscience, materials science, and computer engineering
- Visitors leave before reaching the call to action because the value proposition is never front-loaded with hard data
What you get with this template
You get a complete, production-ready landing page structured around credibility, visual impact, and rapid navigation. Every section is mapped to a specific conversion goal.
- A split-screen hero with a live spike raster animation and a rotating 3D chip wireframe, plus a logo bar for partner social proof
- Five purpose-built content sections covering benchmarks, spike propagation, use cases, and a gated simulation form
- A glassmorphic design system with substrate black, bioluminescent cyan, and synaptic violet, built on Manrope and JetBrains Mono typography
Feature list
This template delivers six carefully considered features. Each one is grounded in the brief and tuned for technical audiences.
Split-Screen Hero with Live Spike Animation
The hero opens with a 50/50 split. The left panel runs a canvas-rendered spike raster plot showing hundreds of spiking neurons firing as vertical cyan streaks. The right panel holds a CSS 3D wireframe of the flagship chip rotating continuously, its active cores pulsing violet. Motion is constant but unhurried, echoing how the brain processes signals at a measured pace.
Logo Bar with Infinite Scroll
A frosted-glass horizontal strip sits above the hero headline and carries partner logos rendered in monochrome. The strip drifts left in a seamless infinite scroll, reinforcing institutional credibility before the visitor reads a single word of copy. This device sets expectations that the lab operates at a serious research level.
Benchmark-Driven Copy Sections
Each split-screen data section pairs a live chart on the left with a tightly written analytical paragraph on the right. The copy is formatted like a journal abstract, escalating from problem statement to evidence to implication. Hard numbers like inference latency and power draw anchor every claim and give researchers data they can verify against published literature.
Full-Width Spike Propagation Diagram
Midway through the page, a full-width animated diagram shows a spike traveling across a network of neurons and synapses in real time. This is the page's single cinematic moment. It visualizes how artificial synapses fire, adapt, and reset, giving neuroscientists and engineers an immediate intuition for the chip's brain-inspired architecture.
Dual Conversion Path with Gated Form
The primary call to action invites visitors to simulate workloads on neuromorphic hardware through a free-tier cloud sandbox. A three-field form captures institutional email, research domain, and a one-sentence workload description. A lighter secondary gate offers a benchmark report download for visitors who want the data before committing to a trial.
GSAP ScrollTrigger Parallax System
Frosted-glass cards stack and overlap as the user scrolls. Each card slides over the previous one with a depth-of-field blur, creating the sensation of flipping through layered research transparencies. Cyan pulses on scroll events. Violet appears only on hover, rewarding interaction the way a real synapse responds to stimulus.
Page sections overview
| Section | Purpose |
|---|---|
| Logo Bar | Display partner and client logos in infinite scroll to establish credibility |
| Split-Screen Hero | Introduce the lab with spike raster animation and 3D chip wireframe |
| Benchmark Data Sections | Pair power and latency charts with journal-abstract analytical copy |
| Spike Propagation Diagram | Full-width cinematic animation showing real-time signal travel across a network |
| Use Case Bento | Split layout covering robotics, defense, and neuroscience application contexts |
| Simulation call to action Form | Gated form capturing institutional email, research domain, and workload description |
| Benchmark Report Gate | Secondary download path gated by email only |
| Footer Strip | Single-row linear footer with contact and institutional links |
Design & branding system
The visual identity is built on a Dynamic Motion theme with a Glassmorphic color system. The palette feels like peering through a laboratory cleanroom window at night, where dark silicon wafers catch traces of instrument light and every surface is slightly frosted.
- Core colors: substrate black (#0B0E14) as the base, translucent frosted panel white at 12% opacity (#FFFFFF1F) for card surfaces, bioluminescent cyan (#00E5CC) for active-state accents and data traces, and synaptic violet (#7B2FBE) reserved for hover states and graph peaks
- Typography: Manrope for all body and heading copy, JetBrains Mono for data labels, benchmark figures, and code-adjacent elements
- Motion system: GSAP ScrollTrigger drives parallax card stacking and scroll-triggered cyan pulses; violet activates only on user interaction, keeping the interface calm until the visitor engages
Mobile & speed optimization
The template is desktop-first, designed for researchers working at workstations where complex data visualizations render at full fidelity. It scales responsively to tablet viewports so lab members and partners can review content on multiple devices.
- GPU-accelerated CSS transforms power all parallax and card-stacking animations, keeping motion smooth without blocking the main thread
- The canvas spike raster and CSS 3D chip wireframe are scoped to their containers, preventing layout reflow during animation cycles
- Responsive breakpoints ensure the split-screen layout reflows gracefully on tablet, maintaining readable columns and accessible form fields
How this template helps you convert
The conversion strategy front-loads hard evidence before asking for anything. Visitors learn the problem, see the proof, and then encounter the offer.
- Hard benchmarks appear in the first two scroll sections, giving researchers numbers to evaluate before the call to action ever appears, building the trust that brain-inspired computing claims require
- The dual conversion path separates ready-to-trial visitors from data-first visitors, so the template captures both segments without friction
- The simulation form uses a minimal three-field structure asking only for institutional email, domain, and workload description, reducing abandonment while qualifying leads with meaningful context
Other information about this template
This template communicates interdisciplinary depth across neuroscience, materials science, and computer engineering. It is built to represent labs whose work spans neuromorphic architecture research, hardware-software co-design, and biological foundations alongside application drivers like robotics and autonomous systems.
- The template supports a publications section where selected papers can be listed with links to full papers and optional impact metrics like citations and press coverage, consistent with how credibility in neuromorphic computing relies on open-source contributions and standardized testing
- The layout can accommodate a Principal Investigator section with a headshot and bio, plus professional bios for lab members highlighting expertise in nanoengineering, computer architecture, or computational neuroscience, helping the lab attract recruits and partners
- A Latest News block can be added to communicate updates on grants, awards, or recent breakthroughs, keeping returning visitors engaged with the lab's momentum
- Brand terms and institutional names referenced in the Surfer keyword targets, including Intel's Loihi, Oak Ridge National Laboratory, the National Science Foundation, the California Institute of Technology, and associate professor affiliations, are appropriate for use in the publications, team, and news sections of the built-out page
- The contact section supports an email address, office location, and links to institutional profiles, giving procurement leads and potential partners a clear path to reach the lab


Theme
Dynamic Motion
Creative direction
Industry Report
Color system
Glassmorphic
Style
Split Screen (50/50)
Direction
Freemium/Trial
Page Sections
Split-screen Hero with Spike Raster
Benchmark-driven Data Sections
Full-width Spike Propagation Animation
Dual-path Conversion System
GSAP Parallax Frosted-glass Cards
Logo Bar with Infinite Scroll
Related questions
What audiences is this template designed to convert?
Can I customize the benchmark charts and data visualizations?
Does the template support a publications or team section?
How does the dual conversion path work?
Is this template suited for a lab working across multiple research domains?


