Home Repair Landing Page Template
Dispatch is a dashboard-style landing page template built for home services training platforms. It opens with a fully interactive revenue projection calculator above the fold, then unfolds as a data grid packed with cohort metrics, close rate comparisons, and testimonial cards styled like dispatch notes. The Midnight Blue and cyan palette makes every number feel operational and real.
by Rocket studio
Quick summary
Dispatch is a single-page template designed for home services training platforms. It leads with a live revenue estimator, then flows through a data grid that shows course outcomes, ticket averages, and time-to-return benchmarks. The dark, terminal-style visual system signals authority to trade operators who think in numbers, not motivational copy.
Who this template is for
This template is built for training platforms that serve working trade professionals. If your audience thinks in routes, trucks, and close rates, this page speaks their language directly.
- Owner-operators running small fleets who need to understand their business numbers
- Franchise managers onboarding groups of new technicians each quarter
- Trade school graduates ready to price and run jobs profitably
What problem this template solves
Most training platforms lead with promises. Trade professionals want proof. This template skips the persuasion intro and puts a working revenue tool front and center, letting the visitor see their own gap before you say a word.
- Generic landing pages waste the first scroll on headlines that do not quantify value
- Trade audiences distrust motivational copy and respond better to operational data
- Platforms with strong outcome data have no structured format to display it credibly
What you get with this template
You get a fully structured, single-page layout that moves a visitor from curiosity to click without a single form. Every section earns the next one.
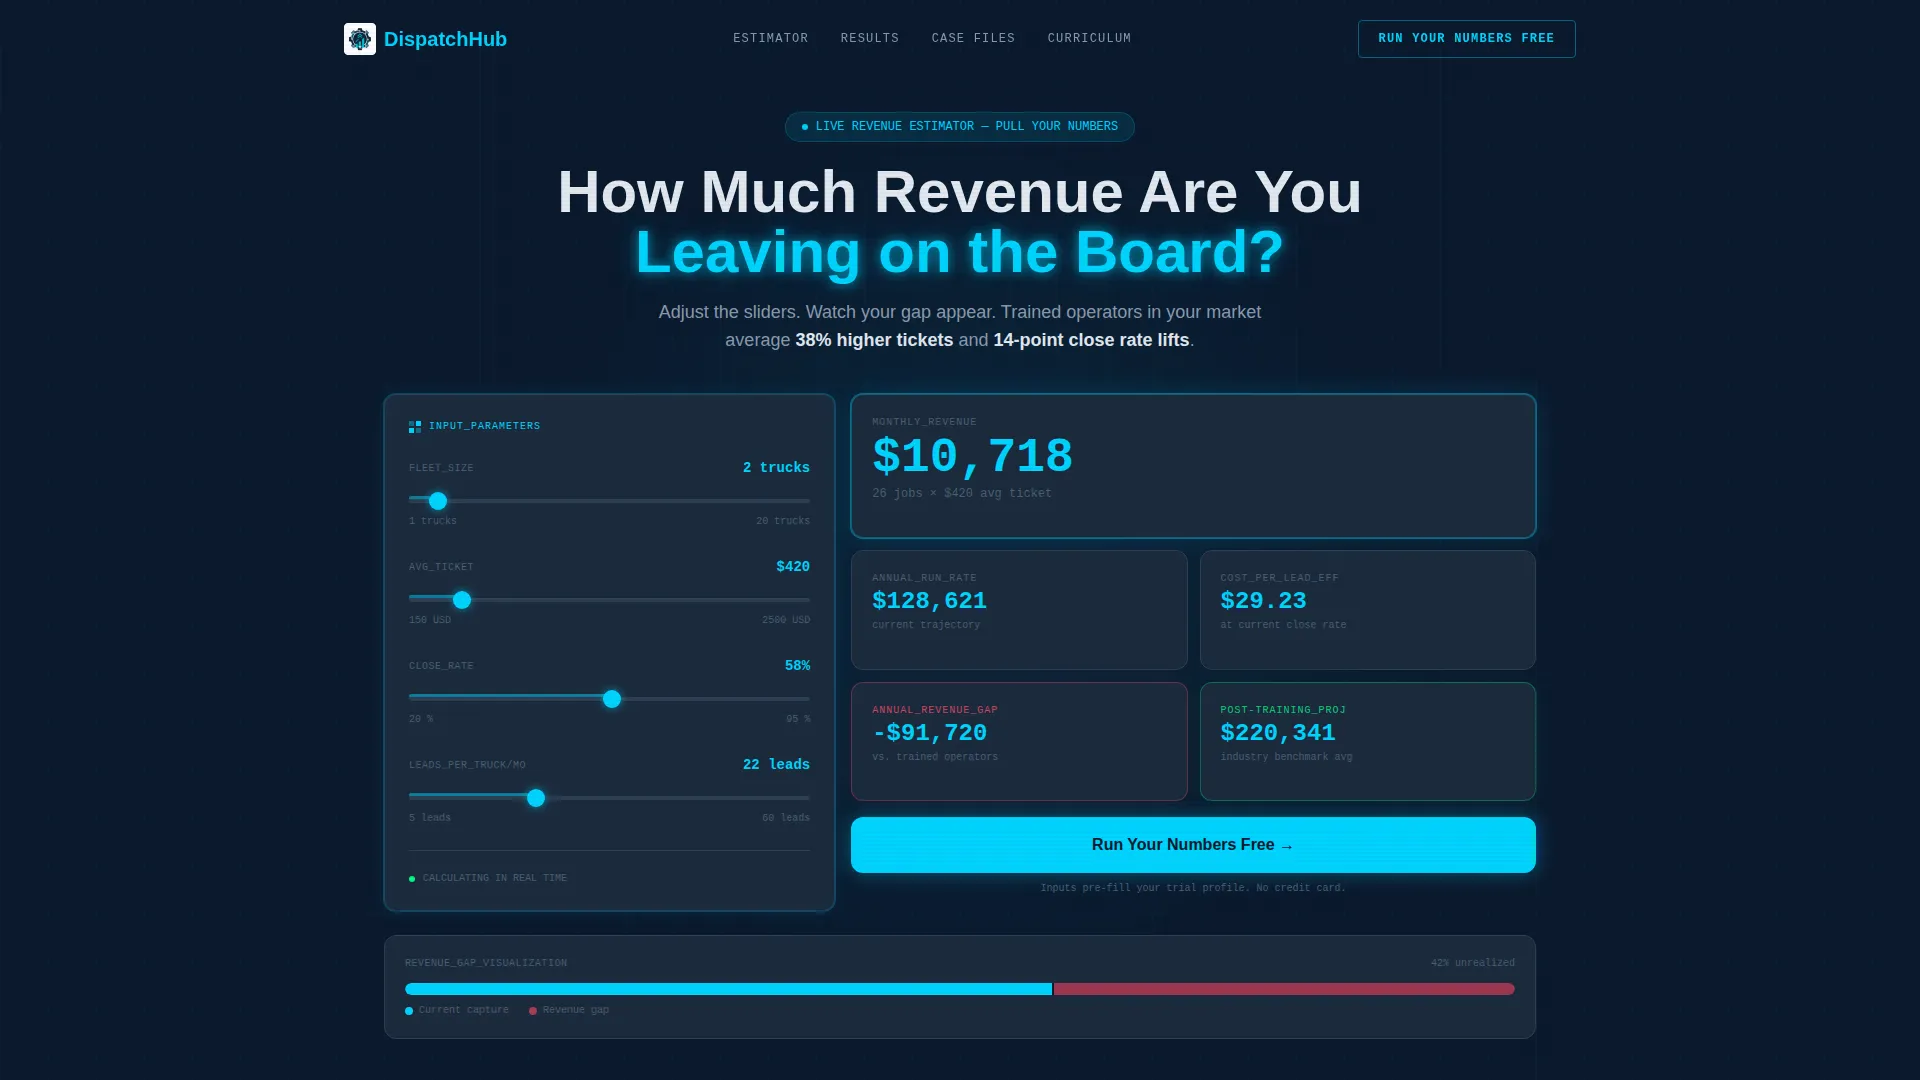
- An interactive calculator header that animates projected monthly revenue, cost-per-lead efficiency, and annual growth in real time
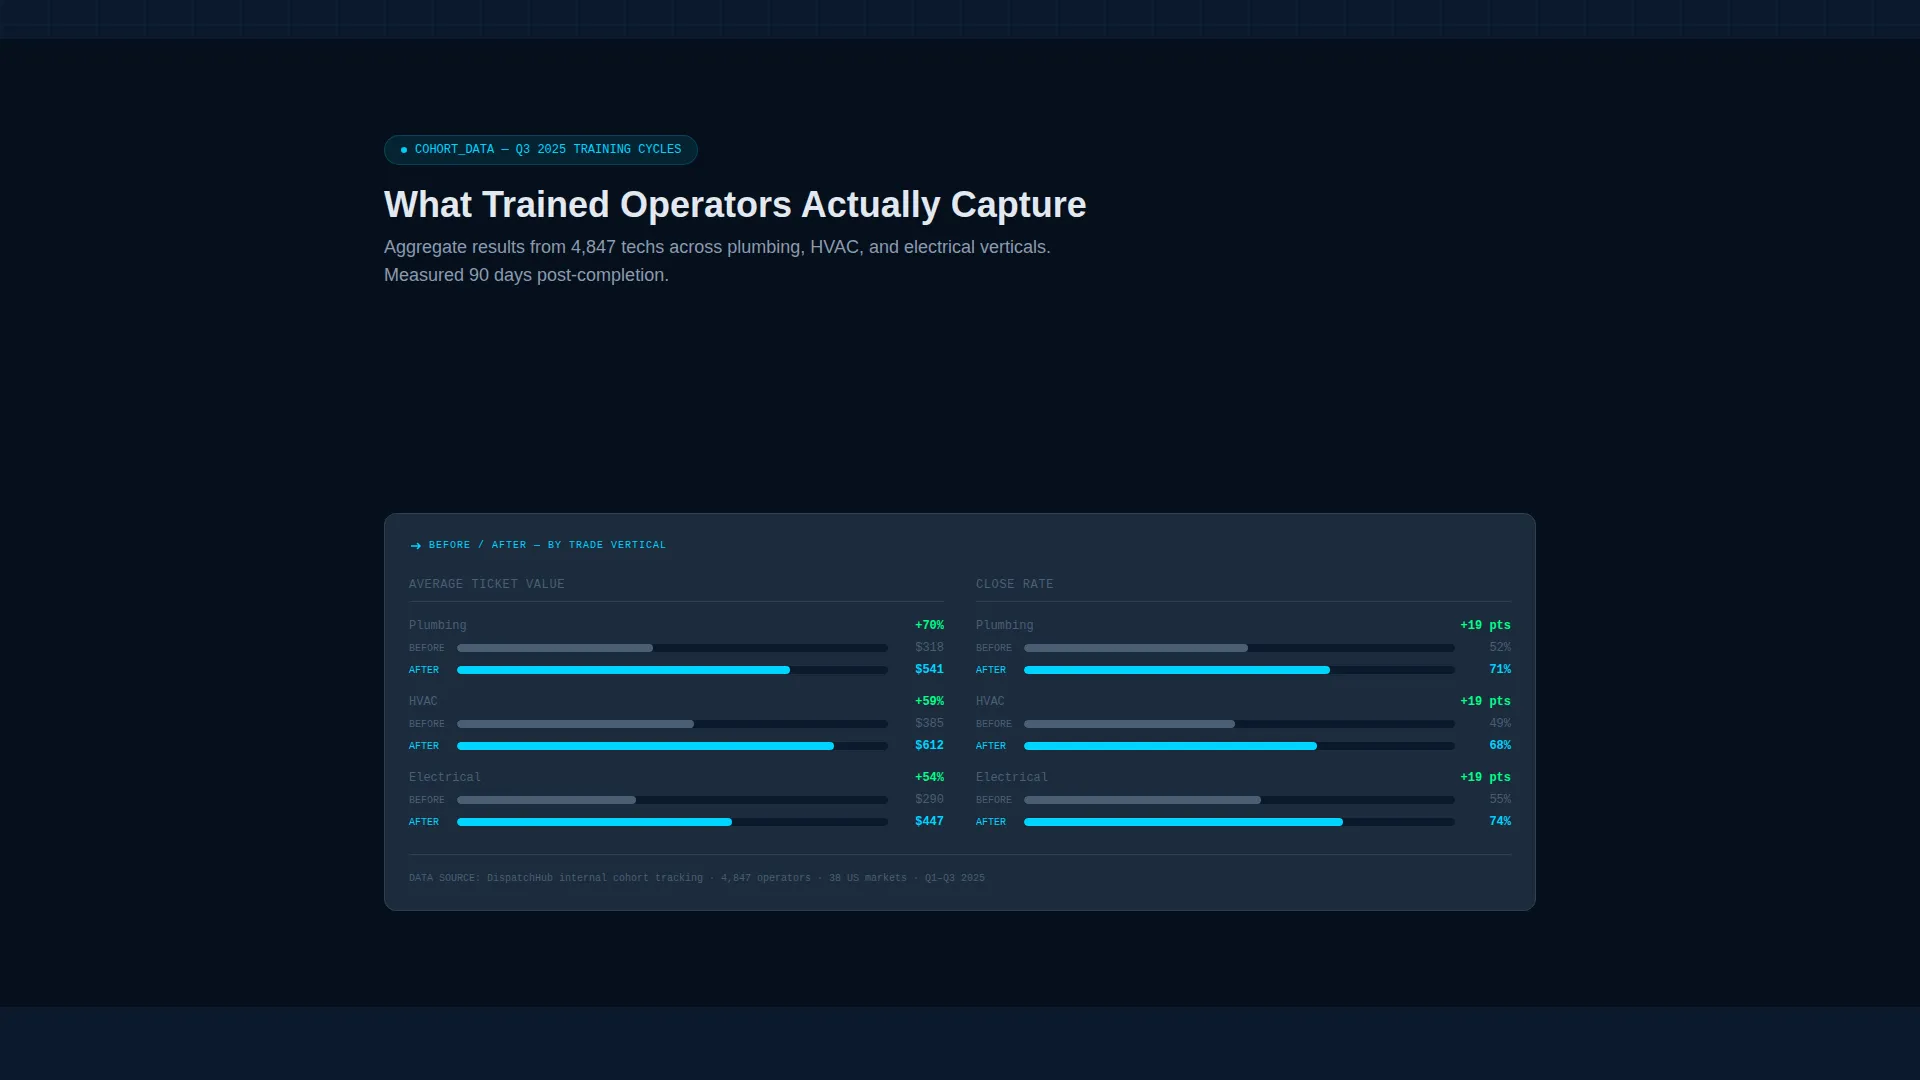
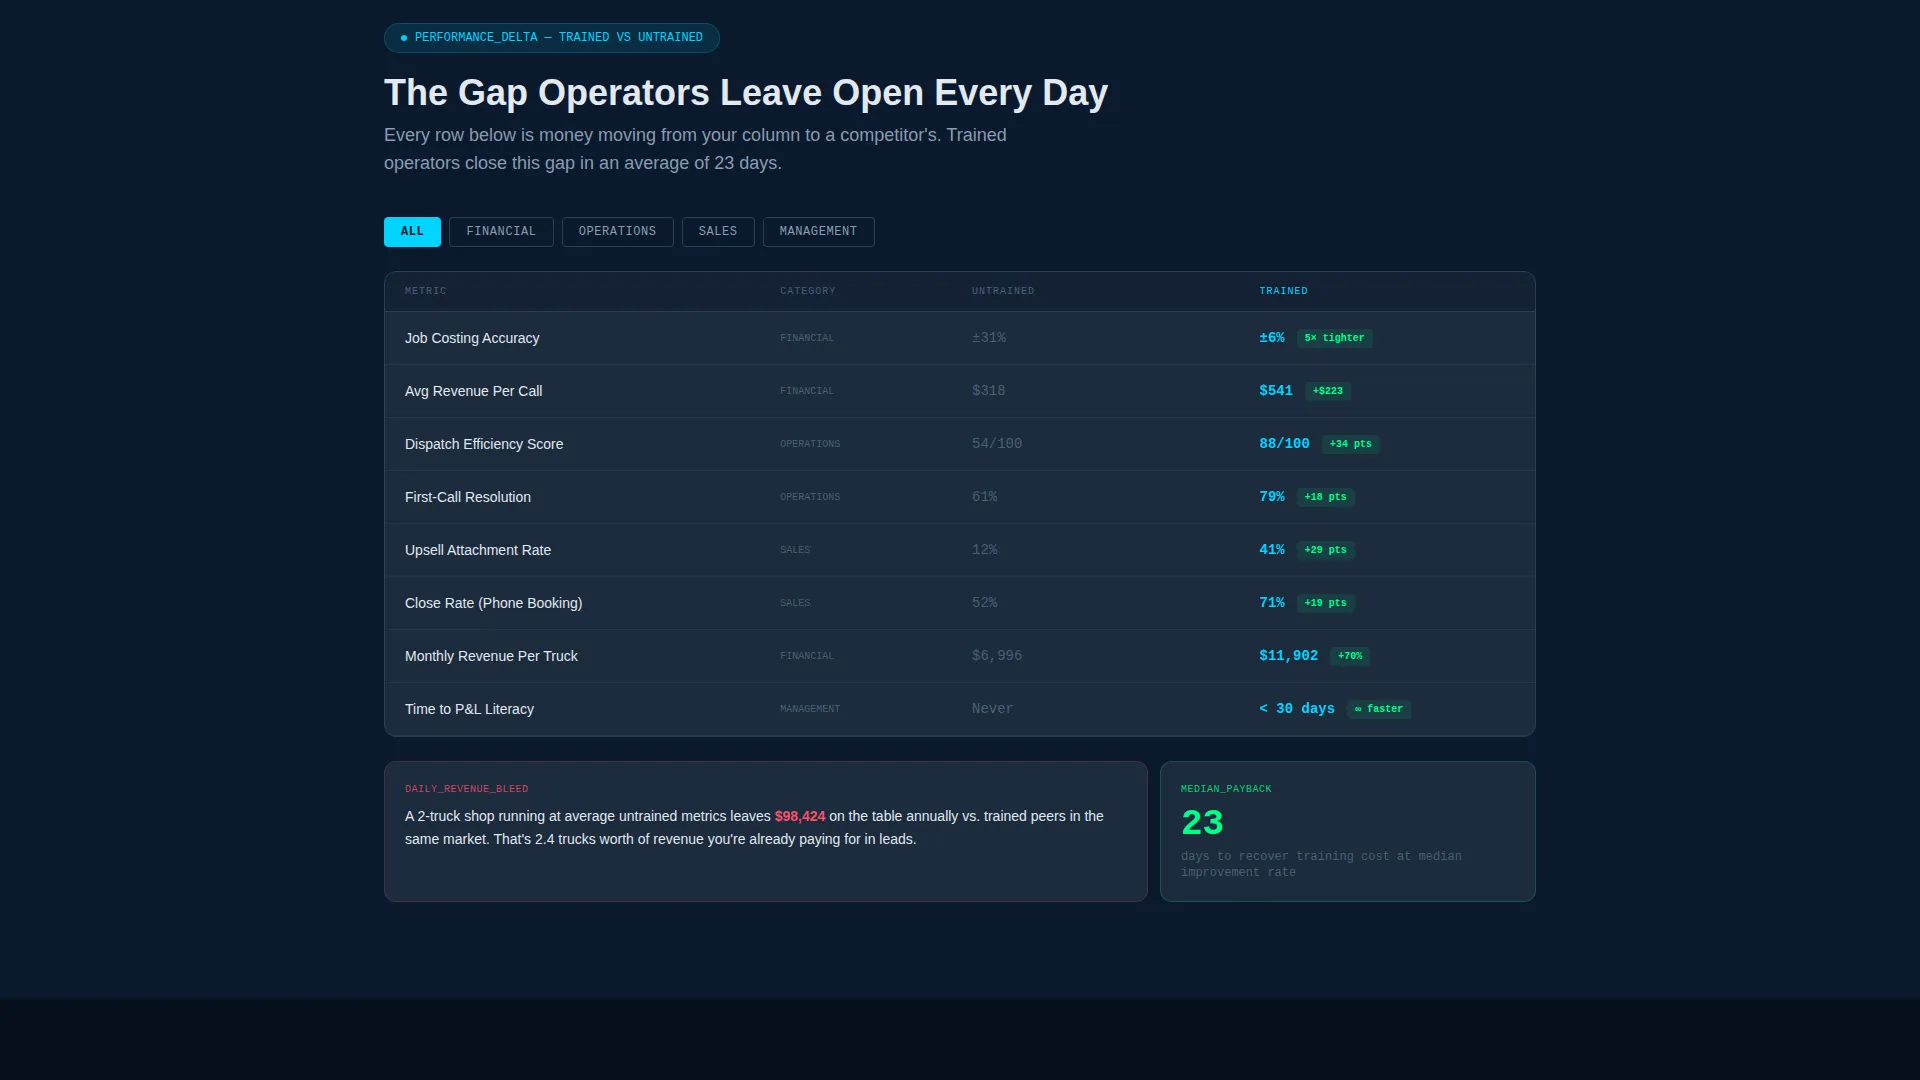
- A modular data grid body with cohort completion metrics, average ticket comparisons by trade vertical, and before-and-after close rate panels
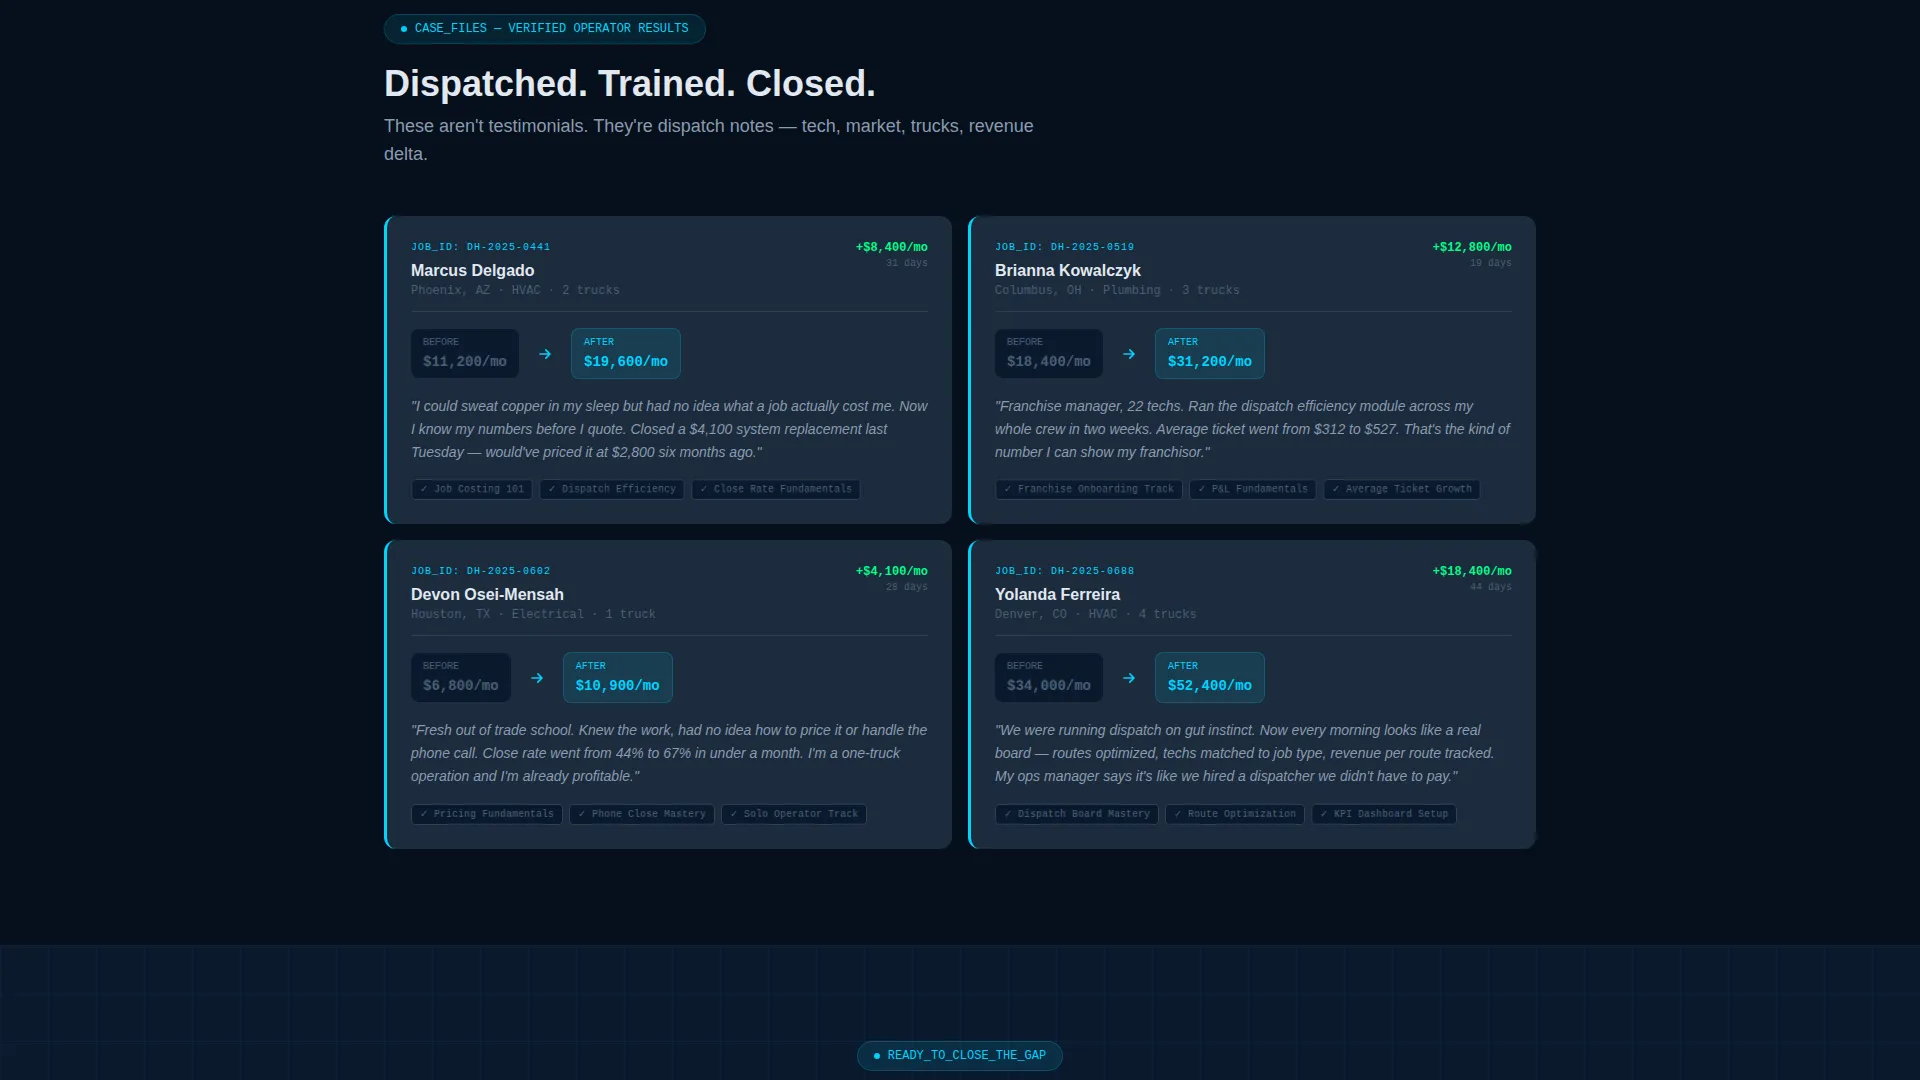
- Dispatch-note-style testimonial cards showing tech name, market, truck count, and revenue delta
- A persistent bottom call-to-action bar that activates after the first scroll, repeating the primary prompt without interrupting the read
Feature list
This template is built around a core set of purpose-designed components that work together as a single operational flow.
Interactive Revenue Projection Calculator
The header is a fully working estimator. Visitors enter truck count, average ticket price, and close rate, then watch a live dashboard animate their projected monthly revenue and annual growth trajectory. Numbers render in cyan against navy tiles and update in real time as sliders move. The tool earns the click before a single word of copy does.
Modular Data Grid Layout
Below the calculator, the page unfolds as a structured grid of data cards. Each row escalates the stakes: first what the visitor is leaving on the table, then what trained operators capture, then how fast the gap closes. The layout is modular, so each card block stands on its own while the full grid tells a connected story.
Dispatch-Style Testimonial Cards
Testimonials are formatted like dispatch notes, not review paragraphs. Each card surfaces the technician name, market, truck count, and revenue delta. This format is instantly credible to trade professionals because it mirrors the operational data they already read every day.
Dual Call-to-Action System
The primary call to action, "Run Your Numbers Free," appears first inside the calculator results panel. It then repeats as a persistent bottom bar after the first scroll. A secondary path, "See the Full Curriculum," opens a slide-out course catalog grid for visitors who want to inspect before committing.
Calculator-to-Signup Input Handoff
When a visitor clicks the primary call to action, their calculator inputs carry forward into the trial signup flow. Their truck count, ticket price, and close rate pre-fill their profile. No data entry is repeated, and no form appears on this page.
Cohort Outcome Data Panels
The data grid includes dedicated panels for course completion metrics drawn from real cohorts, average ticket increases by trade vertical, and time-to-return-on-investment benchmarks. These panels give the platform's claims a structured, visual home that trade operators can scan and trust immediately.
Page sections overview
| Section | Purpose |
|---|---|
| Revenue Calculator Header | Lets visitors project monthly revenue and annual growth with their own numbers before scrolling |
| Live Results Panel | Animates projected output in real time and surfaces the primary call-to-action button |
| Data Grid Body | Displays cohort metrics, ticket comparisons, and close rate panels in escalating rows |
| Dispatch Testimonial Cards | Shows outcome data per technician in a dispatch-note format for immediate credibility |
| Course Catalog Slide-Out | Opens a full curriculum grid for visitors who need to review content before deciding |
| Persistent Bottom Bar | Repeats the primary call to action as a fixed element after the first scroll |
Design & branding system
The Midnight Blue color system gives this template the visual authority of a fleet management interface running in a dark control room. Every color has a functional role, not a decorative one.
- Deep terminal navy (#0B1A2E) covers primary backgrounds, keeping the eye focused on data
- Steel panel gray (#1C2B3D) surfaces card backgrounds and data module containers
- Cool interface white (#E2E8F0) handles all typography, axis labels, and supporting text
- Live-wire cyan (#00D4FF) activates on interactive elements, hover states, and key performance indicator highlights, pulsing wherever data updates in real time
Mobile & speed optimization
The template is structured so the data grid and calculator remain functional and readable across screen sizes. Operational clarity does not collapse at smaller viewports.
- Slider inputs and real-time number rendering in the calculator are built for touch interaction
- Data grid cards reflow into single-column stacks on smaller screens without losing their visual hierarchy
- The persistent bottom bar stays anchored and legible regardless of device width
How this template helps you convert
This template removes the usual friction between curiosity and commitment. Every structural decision pushes the visitor forward without pressure.
- The calculator header turns passive visitors into active participants before they read a single claim, making the revenue gap personal and specific to their own numbers.
- The escalating data grid rows build progressive urgency by showing what trained operators capture compared to untrained ones, moving the visitor closer to the call to action with each section.
- The input-handoff system removes the friction of a form entirely. The visitor's data moves with them into the trial signup, making the first step feel like a continuation rather than a new task.
Other information about this template
This template is a strong fit for home services training platforms positioning themselves as the operational alternative to generic business education. A few additional details worth noting before you build.
- The template style is Dashboard and Data Grid, designed specifically to present training outcome data in a format trade professionals already trust
- The creative direction is Calculator First, meaning the interactive tool does the primary persuasion work and the remaining sections provide supporting evidence
- The page direction is Click-Through, so there is no embedded form; the goal of every element is to move the visitor toward the trial enrollment click
- The Data Command theme means the visual system is intentionally austere and operational, with no stock photography, illustration, or motivational headline copy included in the design
- This template is categorized under Home Services Software and Software as a Service within the Technology category, making it a natural fit for platforms serving plumbers, electricians, and heating, ventilation, and air conditioning technicians
Theme
Data Command
Creative direction
Calculator/Tool First
Color system
Midnight Blue
Style
Dashboard/Data Grid
Direction
Click-Through
Page Sections
Interactive Revenue Projection Calculator
Modular Escalating Data Grid
Dispatch-note Testimonial Cards
Dual Call-to-action System
Calculator Input Handoff to Signup
Cohort Outcome Data Panels
Related questions
Does this template include a working calculator?
Is there a form on this landing page?
Can I display my platform's real cohort data in the grid?
Who is this template built for?
What does the secondary call to action do?


