Specialist Consulting Digital Presence Appointment Booking Website Template
Consult is a single-page analytics consulting landing page template built on a Data Command visual theme. It uses a glassmorphic card grid layout to turn a firm's proof points into a compelling evidence wall. With a live dashboard header, stats-first scroll sections, and two distinct lead capture paths, it moves serious buyers from first impression to booked call.
by Rocket studio
Quick summary
Consult is a modular card grid landing page template designed for analytics and operations consulting firms. It opens with a live-style dashboard header, builds credibility through oversized impact statistics, and closes with two lead capture options: a diagnostic call booking form and a gated checklist download. The visual system uses deep charcoal, frosted glass panels, and electric cyan accents.
Who this template is for
This template is built for consulting firms that lead with data. It suits practices where the work is analytical, the clients are executives, and the sales cycle depends on demonstrated pattern recognition rather than broad promises.
- Analytics and operations consulting firms targeting mid-market companies
- Strategy practices serving CFOs, operations VPs, and private equity portfolio managers
- Consultants who want a landing page that earns trust before asking for the meeting
What problem this template solves
Many consulting firms have credibility that their website does not show. A generic services page fails to convey the precision and depth that executive buyers expect. This template closes that gap.
- Visitors leave before understanding the firm's actual methodology or results
- Generic layouts cannot carry the weight of complex, data-driven value propositions
- There is no clear path for visitors who are not yet ready to book a call but are still qualified leads
What you get with this template
You get a fully structured single-page layout that sequences proof, context, and conversion in a deliberate order. Every section is designed to build confidence before asking for anything.
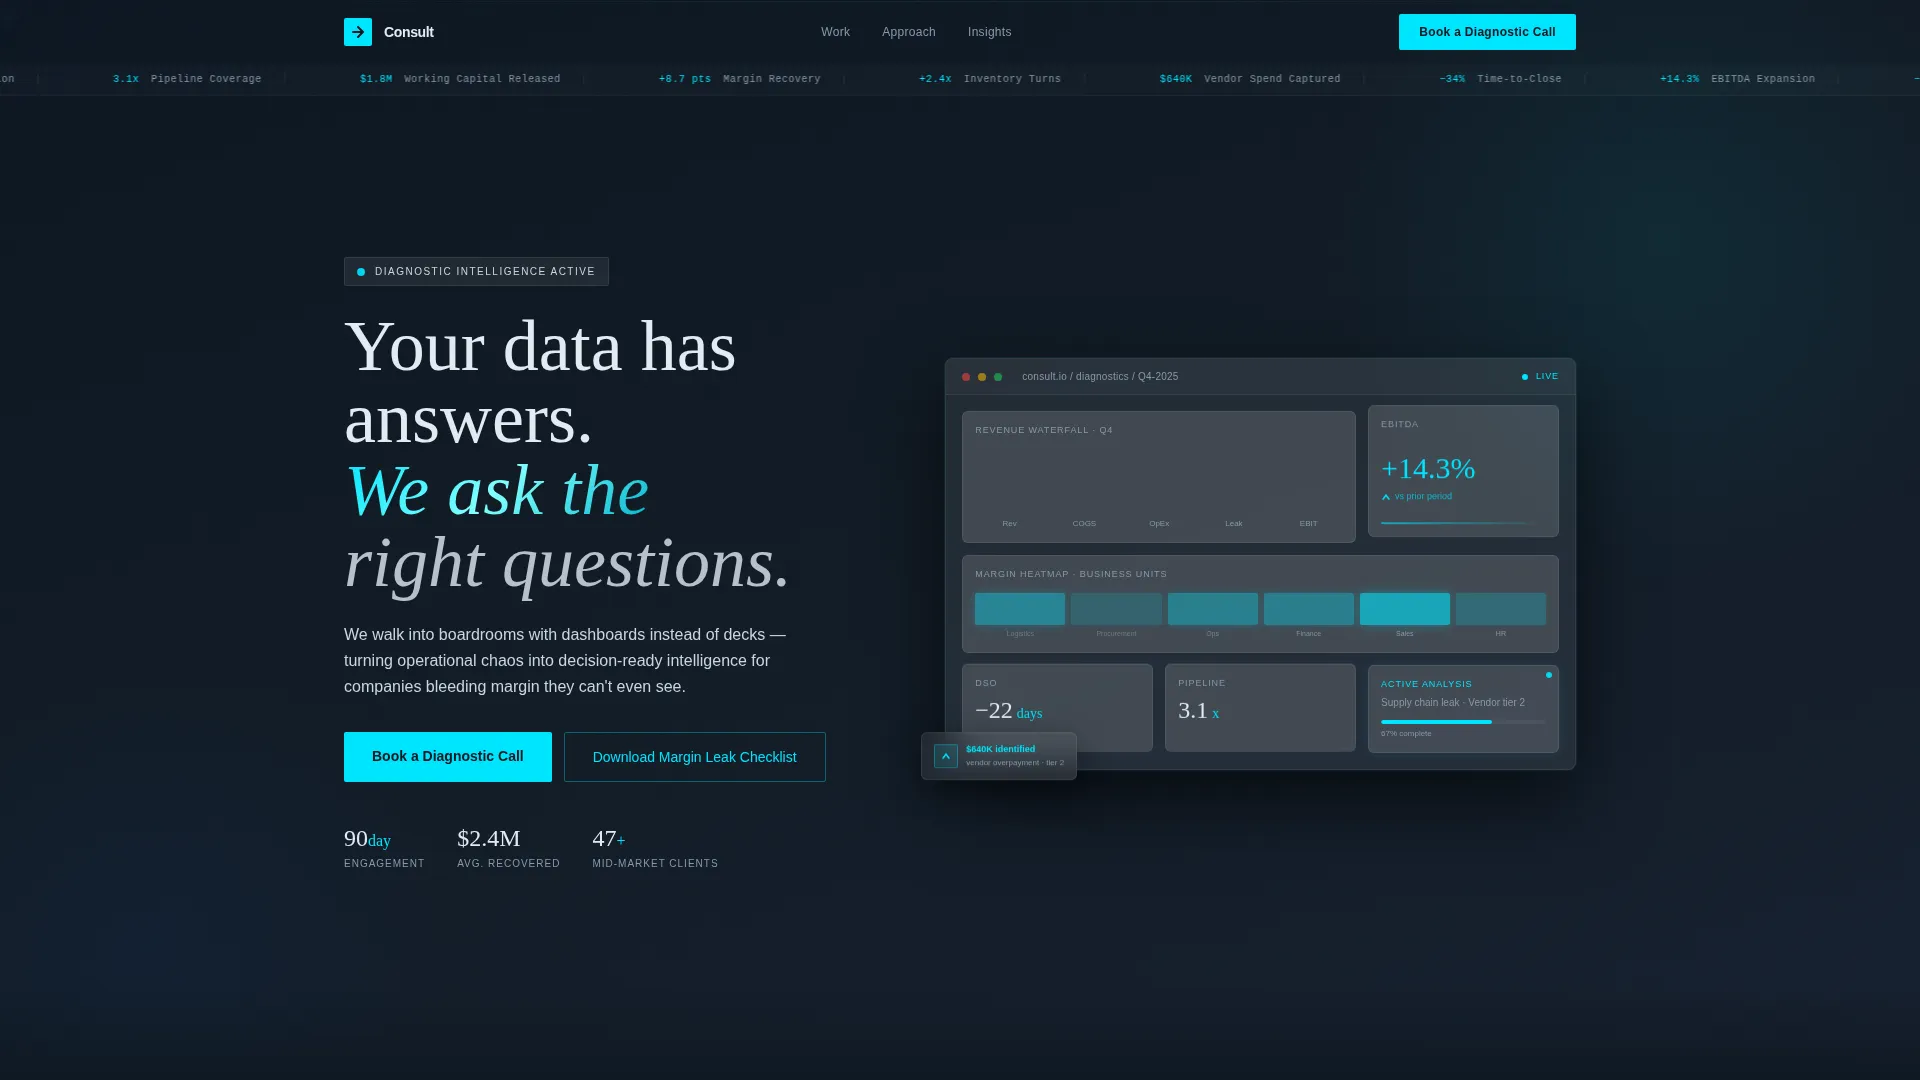
- A viewport-filling dashboard header with animated KPI ticker, revenue waterfall chart, and margin heatmap
- A stats-first scroll structure where oversized impact numbers lead each section before supporting card grids tile in
- Two lead capture paths: a "Book a Diagnostic Call" form and a gated "Download the Margin Leak Checklist" option
Feature list
This template is built around a set of integrated components that work together to establish authority and drive action.
Live Dashboard Header
The header fills the entire viewport with a stylized analytics interface. It shows interconnected cards including a revenue waterfall chart, a margin heatmap, and a scrolling KPI ticker displaying real-feel metrics. A ghost cursor trail implies a strategist already at work inside the system.
Stats-First Scroll Sections
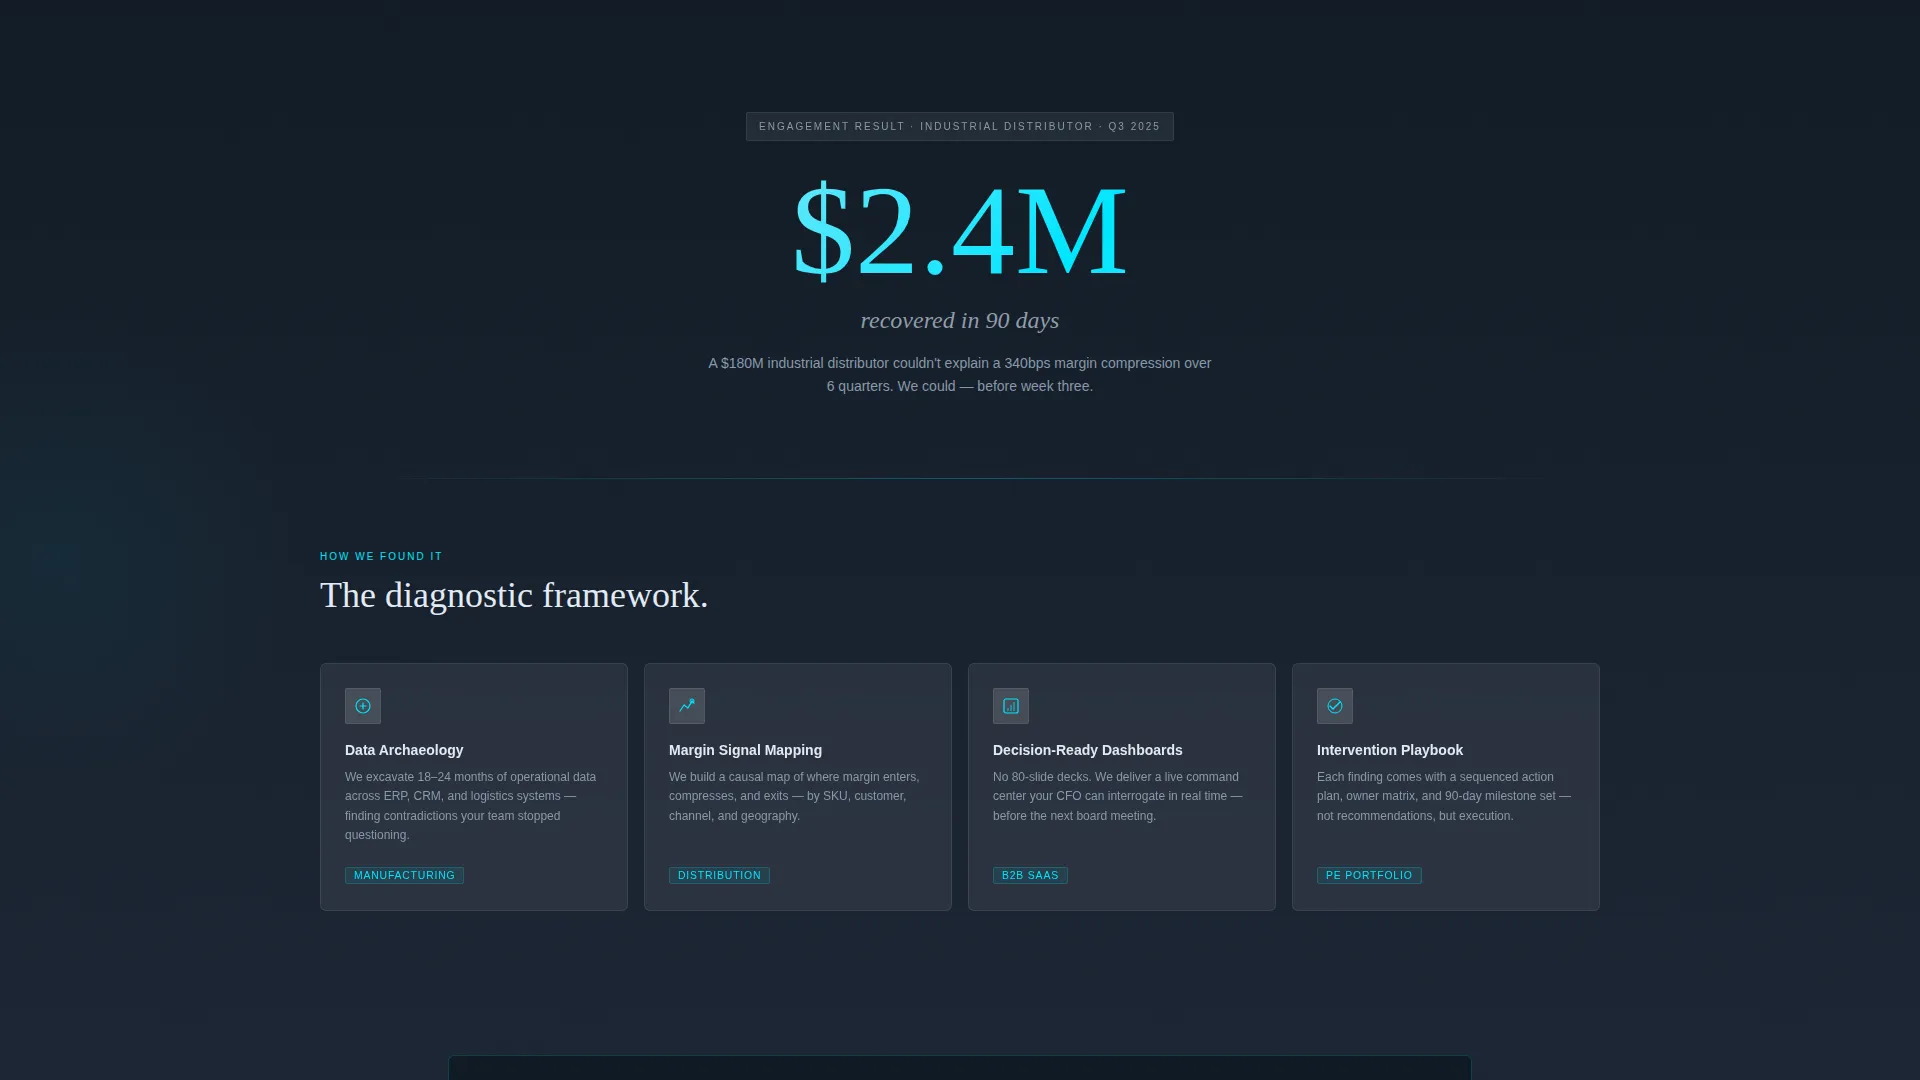
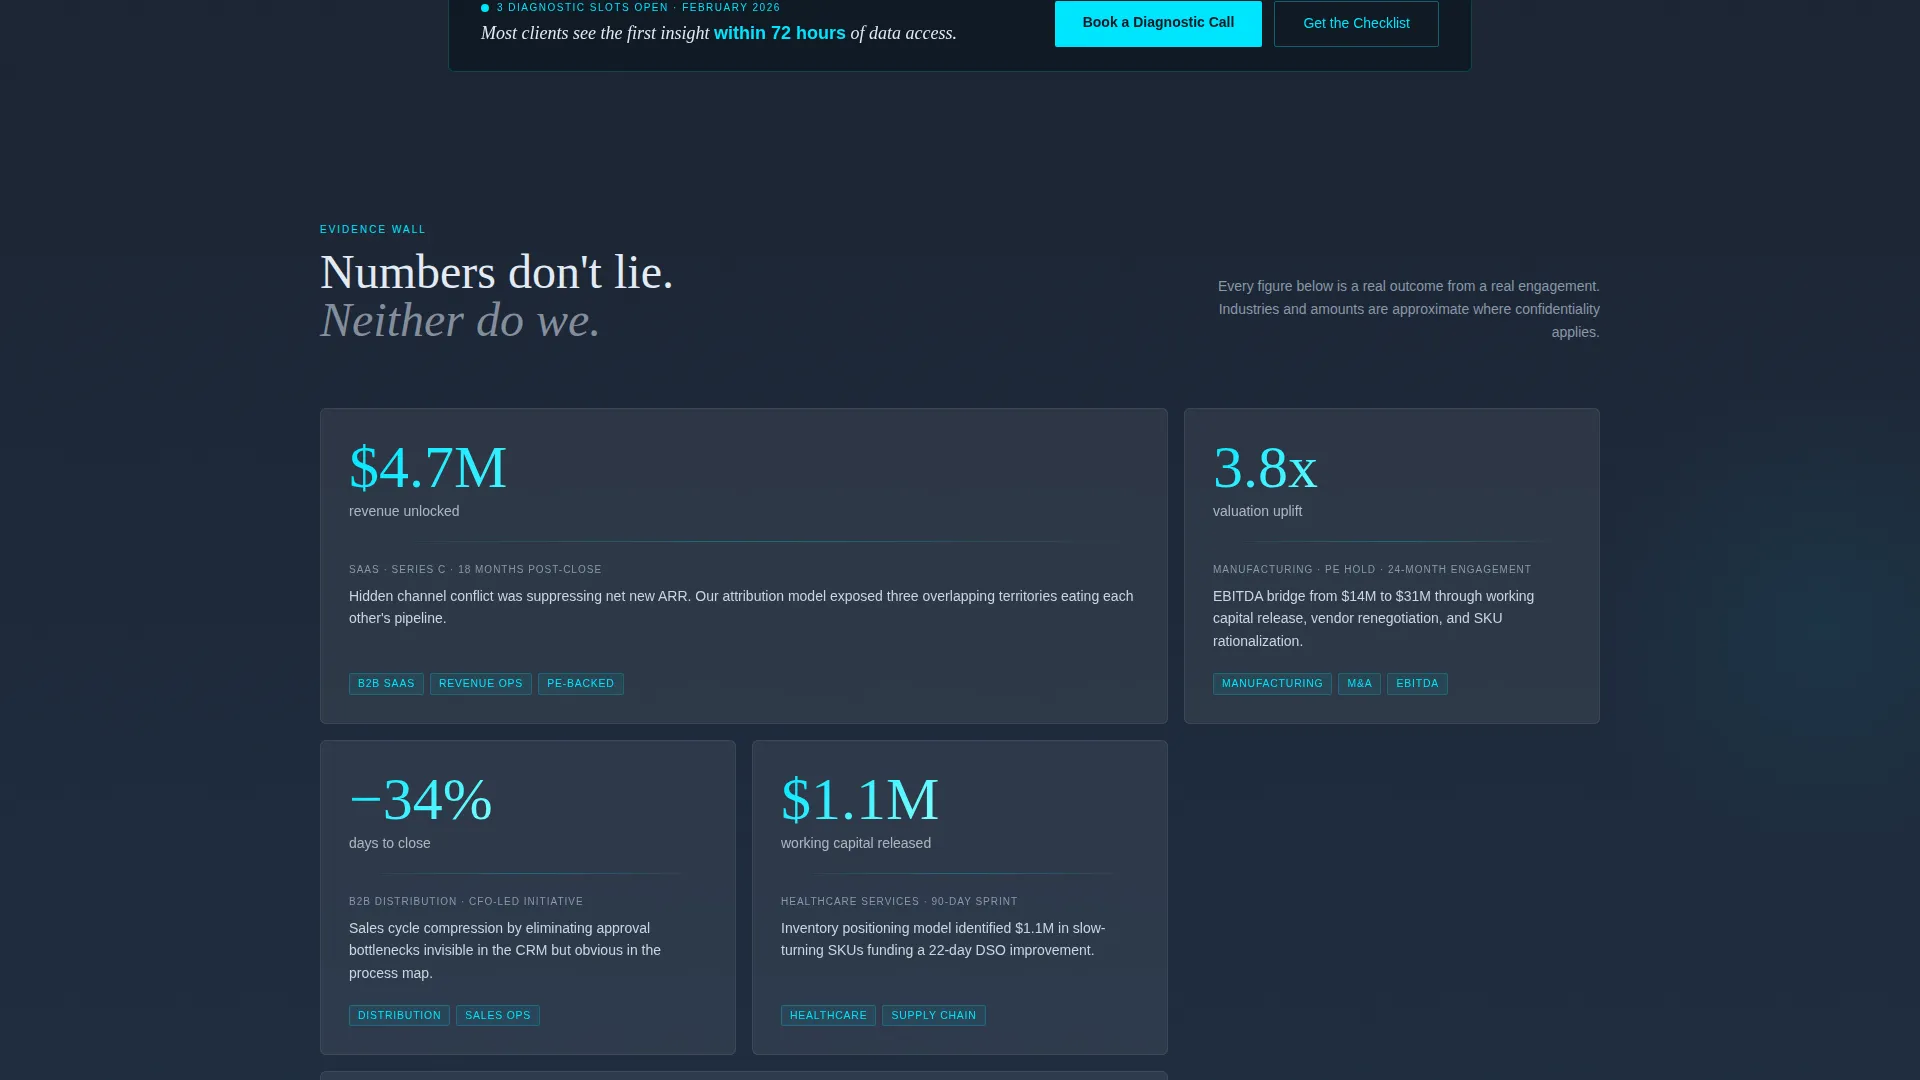
Each scroll transition opens with a single oversized statistic that lands before any explanation. Supporting card grids then tile in around it with methodology context, case details, and industry tags. The sequence escalates from cost savings to revenue unlocked to valuation multiples.
Glassmorphic Card Grid Layout
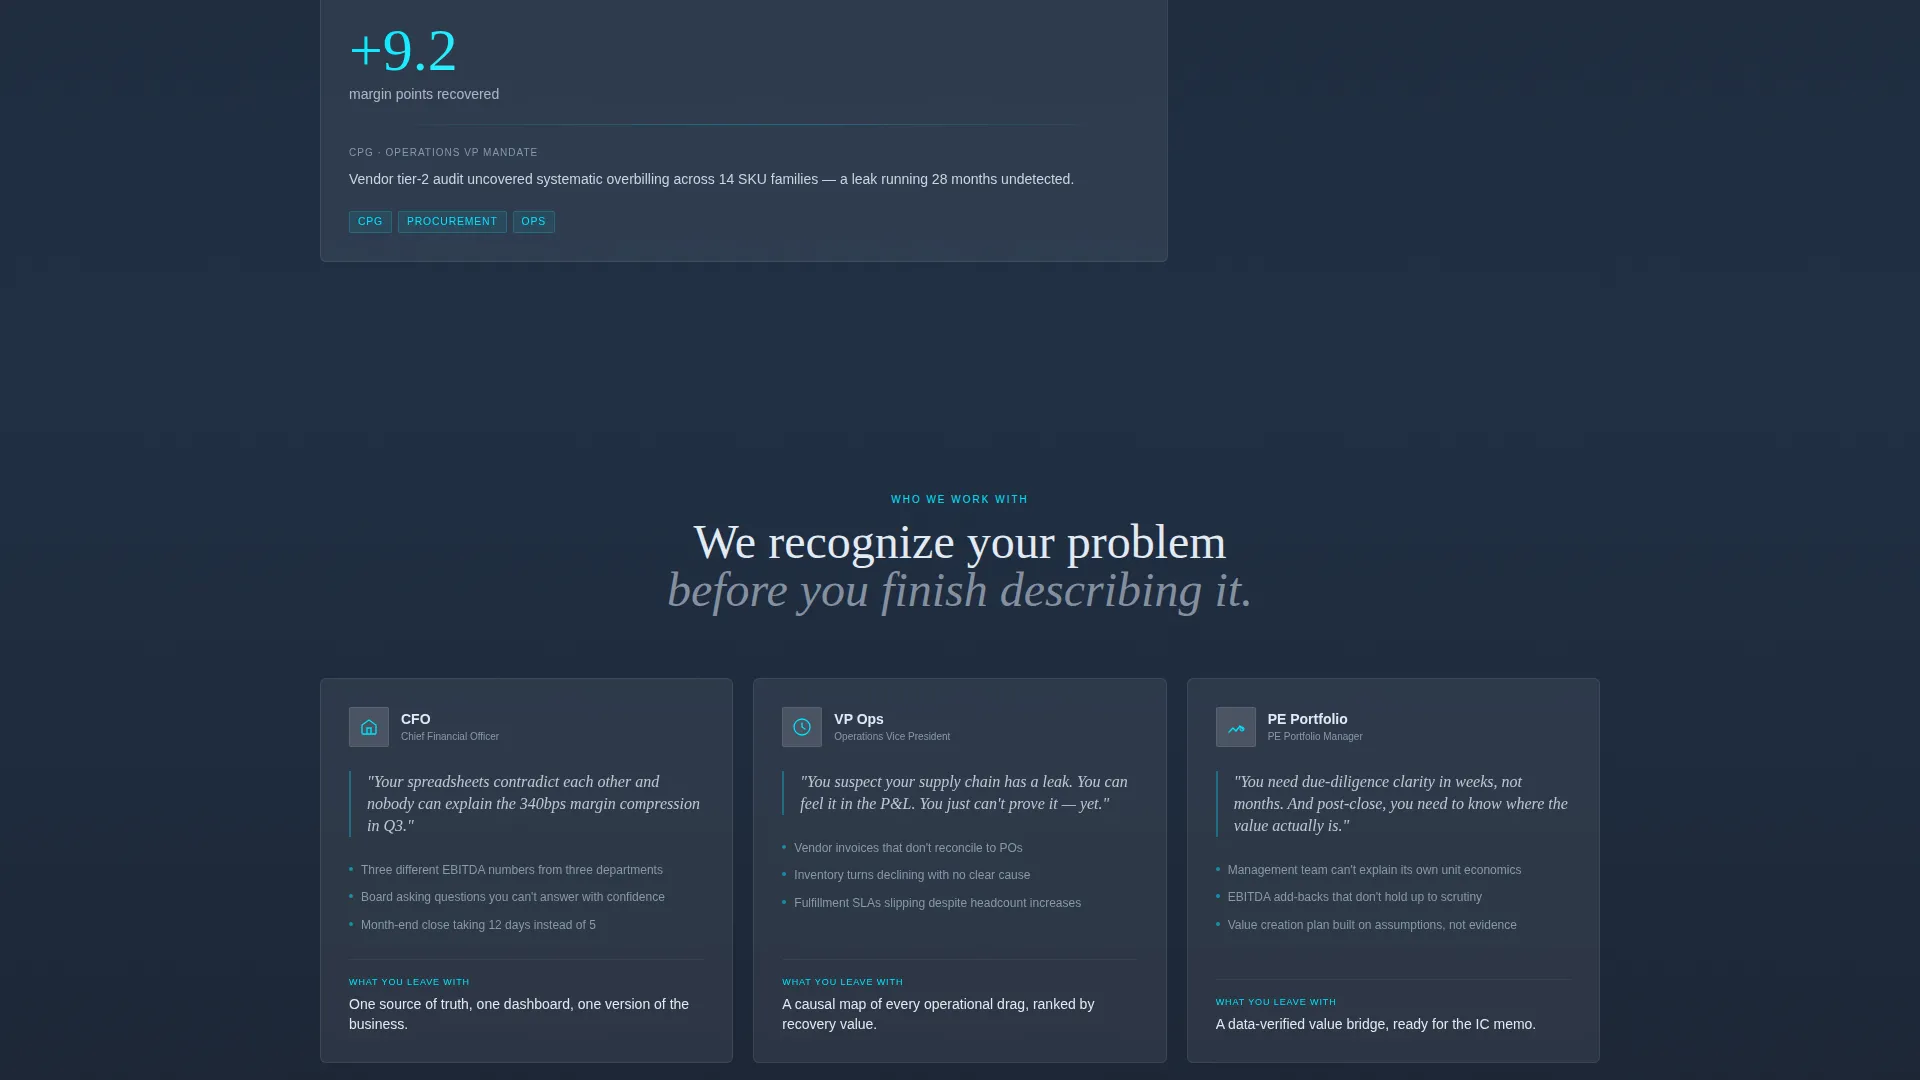
Cards are built on frosted glass panels with subtle backdrop blur. Each card floats with a one-pixel cyan border that activates on hover. The modular grid structure makes it easy to rearrange or extend sections without breaking the visual system.
Floating Lead Capture Bar
After the second section, a frosted floating bar surfaces the primary call to action. It stays contextually placed so visitors encounter it at the moment credibility peaks, not before the case has been made.
Dual Conversion Form System
The final card grid anchors a two-field form with a work email input and an open text field asking "What keeps you up at night?" A secondary path offers the gated checklist download, capturing email and company size from visitors who are not ready for a direct conversation.
Stagger-Animated Card Transitions
Cards animate on scroll in a staggered sequence, each one sliding into place like a new pane of intelligence. The motion reinforces the Data Command theme and keeps the visitor engaged through every section.
Page sections overview
| Section | Purpose |
|---|---|
| Dashboard header | Open with a live analytics interface filling the viewport |
| KPI ticker strip | Scroll real-feel metrics to establish instant numeric credibility |
| First impact stat | Land the opening oversized statistic before any explanation |
| Methodology card grid | Tile in supporting context, process detail, and industry tags |
| Second impact stat | Escalate the evidence wall with a revenue or margin number |
| Case context cards | Provide client scenario detail and compressed timeline proof |
| Third impact stat | Peak the evidence with a valuation multiple or recovered sum |
| Floating call to action bar | Surface the diagnostic call prompt at peak credibility |
| Final card grid | Anchor the two-field booking form inside the modular layout |
| Checklist download | Offer the gated margin leak PDF as a secondary lead path |
Design & branding system
The visual identity is built around a Data Command theme. Deep command-center charcoal forms the base, and frosted glass panels layered with backdrop blur create the sense of depth and layers beneath layers. Electric cyan drives live-data accents and hover states, while muted platinum handles body text for clean readability.
- Core palette: deep charcoal (#0F1923), frosted panel white at 12% opacity, electric cyan (#00E5FF), and muted platinum (#CBD5E1)
- Background progression shifts from near-black at the top to deep slate (#1A2332) as sections descend
- Cards use frosted panels with one-pixel cyan borders on hover, creating a control-tower-at-night atmosphere
Mobile & speed optimization
The modular card grid is structured to reflow cleanly across screen sizes. Frosted glass effects and stagger animations are applied in a way that keeps the layout coherent on smaller viewports without sacrificing the visual system.
- Card grid columns collapse into a single-column stack on mobile without losing the glassmorphic panel identity
- The floating call to action bar repositions to remain visible and tappable on touch devices
- Stagger animations are scoped to scroll events so they trigger correctly on both desktop and mobile viewports
How this template helps you convert
The conversion architecture is deliberate. Every design and content decision is sequenced to reduce hesitation and make the ask feel earned rather than premature.
- The stats-first scroll structure forces visitors to ask "how?" before the methodology cards answer, creating active engagement rather than passive reading.
- The floating lead capture bar appears only after the second section, so the call to action arrives at the moment evidence has already built the case.
- The dual conversion path means qualified visitors who are not ready to book still enter the funnel through the gated checklist, giving the firm two capture opportunities from a single page visit.
Other information about this template
This template is category-tagged under Technology with a subcategory focus on consulting digital presence. It is built specifically for the consulting website template niche, where executive buyers assess credibility quickly and expect the design to reflect the precision of the work.
- Template style: Card Grid (Modular), suited for practices that need flexible section layouts
- Intersection match: the template fully aligns across theme, creative direction, color system, template style, landing page direction, and header concept
- The lead generation direction is reinforced at two separate points in the page, not just at the footer
- This template can support a firm that presents dashboards in place of pitch decks and needs its website to carry the same weight
Theme
Data Command
Creative direction
Stats-First Impact
Color system
Glassmorphic
Style
Card Grid (Modular)
Direction
Lead Generation
Page Sections
Live Dashboard Header with KPI Ticker
Stats-first Scroll Architecture
Glassmorphic Modular Card Grid
Stagger-animated Scroll Transitions
Dual Lead Capture System
Related questions
Who is this landing page template designed for?
Can I use this template if I do not have case study numbers ready?
What are the two lead capture options included in this template?
How does the modular card grid layout work?
Does the template include the animated dashboard header?



