Specialist Micro-SaaS & Developer Tools Pricing & Packages Website Template
The Cron every job every server one screen landing page template is a hub-and-spoke, anchor-nav landing page built for cron job monitoring tools. It combines a full-width dashboard screenshot hero, five spoke sections loaded with stat-first glassmorphic cards, and a Tech Glass visual identity in Void and Violet to drive free-tier signups from DevOps engineers, platform teams, and solo developers.
by Rocket studio
Quick summary
This template gives any cron job monitoring product a conversion-ready landing page with a dark terminal aesthetic. A sticky anchor nav links five spoke sections: Monitor, Alert, Debug, Integrate, and Scale. Each section opens with an oversized stat before explaining the feature beneath it. The result is a page that earns trust through evidence first, then invites the visitor to sign up.
Who this template is for
This template is built for teams and developers who work with scheduled tasks every day. If your product helps people manage, observe, or recover cron jobs at scale, this landing page speaks directly to your audience.
- DevOps engineers managing hundreds of crontabs across a server fleet, often checking status over ssh at 2 a.m.
- Platform teams at SaaS companies who need audit trails when a billing or data job silently fails on a dedicated server.
- Solo developers who want passive confidence that a nightly backup script or php cleanup task actually ran without manual checks.
What problem this template solves
Cron is a time-based job scheduler built into unix like operating systems. It is powerful, but it is also silent. When a scheduled task fails, the cron daemon writes nothing visible unless you have configured output routing. Engineers are left chasing log file entries over ssh, grepping through a crontab file, or waiting for a user complaint to surface a missed job. This template solves the presentation problem: how do you communicate that your product ends all of that, before a visitor even scrolls past the hero?
- Scattered crontab files across multiple servers make it impossible to get a single view of job health without command line inspection.
- Silent failures produce no error messages by default, so a broken backup script or php report job can go undetected for days.
- No clear narrative around monitoring capability means visitors leave before they understand the product value.
What you get with this template
You get a fully structured, single-page layout designed to move a technical visitor from skepticism to signup. Every section is pre-wired for stat-first storytelling, so you drop in your real numbers and the page does the persuasion work.
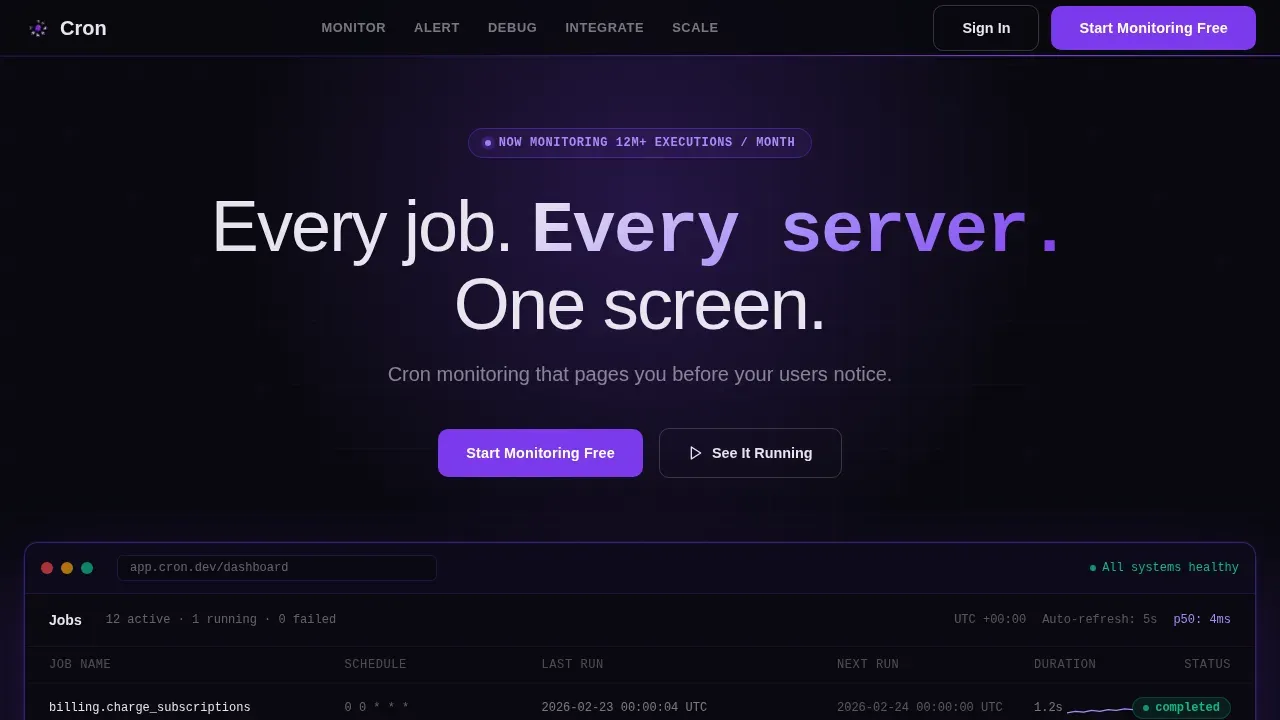
- A hero section with a full-width dashboard screenshot inside a frosted-glass browser chrome frame, a primary headline, and dual calls to action.
- Five spoke sections (Monitor, Alert, Debug, Integrate, Scale), each opening with one oversized metric and supported by glassmorphic feature cards.
- A sticky anchor nav that keeps the primary call to action visible on every scroll position, reducing friction at every line of the page.
Feature list
This template's capabilities come directly from the brief. Every section, component, and interaction below is included in the design and build scope.
Stats-First Spoke Sections
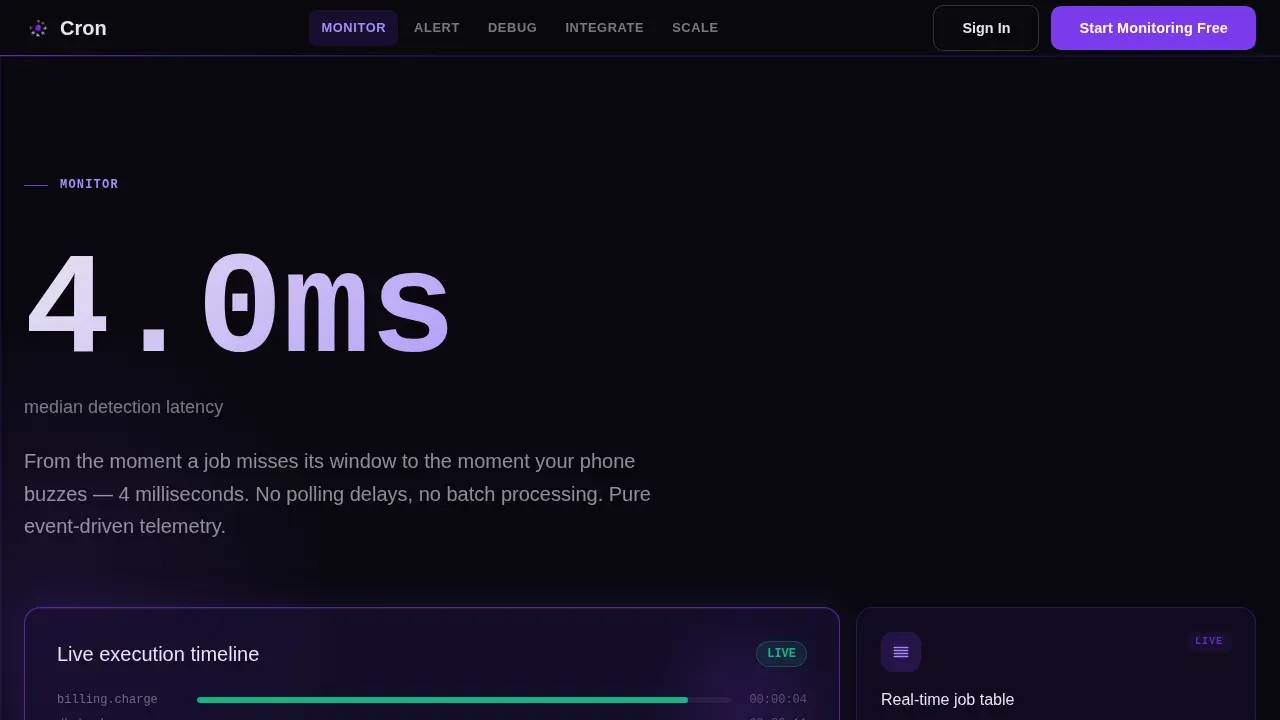
Each of the five anchor sections opens with a single oversized number before any paragraph text. For example, the Monitor spoke leads with "4ms median detection latency," the Scale spoke leads with "99.97% uptime across 12M tracked executions," and the Integrate spoke leads with "380+ integrations via webhook." This structure means the visitor reads evidence before they read explanation, which is the correct order for a technical audience.
Sticky Anchor Navigation with Active Highlighting
The nav pins to the top of the viewport on scroll. It shows five spoke links and keeps the primary "Start Monitoring Free" call to action visible at all times. Active-section highlighting updates as the user scrolls, so they always know where they are in the page without losing the path back to signup.
Glassmorphic Card Components
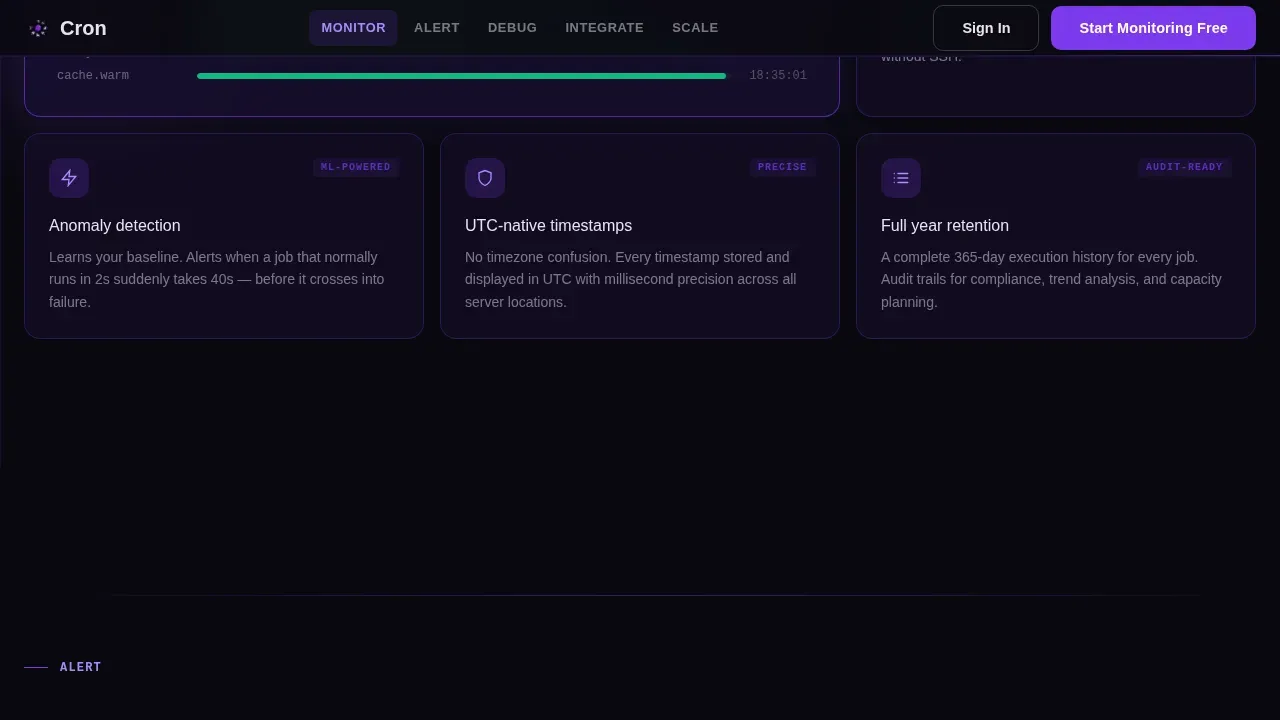
Feature details live inside frosted-glass cards that slide into frame on scroll. Each card uses the Void and Violet color system: void black backgrounds, deep interstellar purple layers, electric violet accents, and frosted white typography. The card system is consistent across all five spokes, so the page feels engineered rather than assembled.
Scroll-Linked Animation System
The template includes scroll-linked stat counters that increment as each spoke section enters the viewport, pulsing status LEDs that mimic a live job table, beam borders on interactive surfaces, and card slide-in transitions. These animations create the terminal-at-night atmosphere described in the brief without requiring the visitor to interact.
Dual Call-to-Action Architecture
The primary call to action, "Start Monitoring Free," appears in electric violet beneath the hero screenshot and again fixed inside the anchor nav. A secondary ghost-button, "See It Running," links to an interactive demo sandbox. No form lives on the landing page itself; both buttons click through to separate destinations, keeping the page clean and fast.
Hero Dashboard Screenshot Block
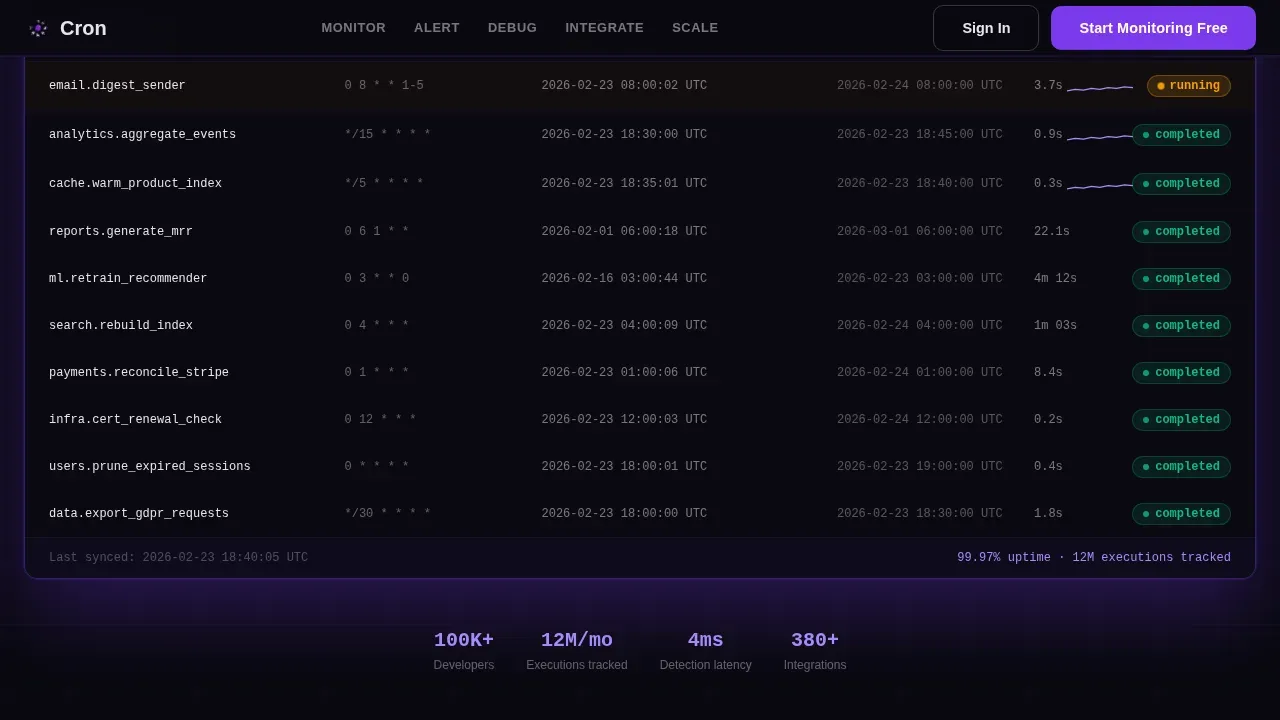
The hero places a pixel-perfect dashboard screenshot inside a frosted-glass browser chrome frame with a violet drop shadow. The screenshot shows twelve cron jobs in a live table: three with green "completed" badges, one pulsing amber "running," UTC timestamps, and a flat latency sparkline. This is the first thing a visitor sees, and it immediately demonstrates that the product is real and working.
Page sections overview
| Section | Purpose |
|---|---|
| Hero with screenshot | Establish product reality with a live dashboard image and dual calls to action |
| Monitor spoke | Lead with 4ms latency stat and show live job table glassmorphic cards |
| Alert spoke | Lead with zero silent failures stat and present multi-channel alert config cards |
| Debug spoke | Lead with p95 runtime baseline stat and show log viewer plus execution timeline |
| Integrate spoke | Lead with 380+ integrations stat and display logo wall with webhook config card |
| Scale spoke | Lead with 99.97% uptime stat and show fleet architecture diagram |
| Footer minimal | Provide developer-minimal footer with nav links and signup entry point |
Design & branding system
The visual identity follows a Tech Glass theme built on the Void and Violet color system. Every color choice and type choice reinforces the terminal-at-night atmosphere. The page feels like staring into a server rack where violet status LEDs reflect off smoked acrylic panels.
- Colors: void black (#09090F) for backgrounds, deep interstellar purple (#1A1035) for layered depth, electric violet (#7C3AED) for every interactive surface and accent pulse, and frosted glass white (#E8E4F0) for typography and card borders.
- Typography: JetBrains Mono for all data, code, and timestamp output across the job table and stat blocks; Manrope for headings and interface labels, keeping the hierarchy clean and readable at any viewport width.
Mobile & speed optimization
The template is designed desktop-first, reflecting the reality that DevOps engineers typically work on large monitors when managing a cron job fleet. However, the layout is responsive and adapts cleanly to smaller viewports so the page remains usable on any device.
- Static sections use Server Components to minimize the initial load, while scroll animations and stat counters use Client Components that activate only when needed.
- The glassmorphic card grid and anchor nav reflow gracefully on tablet and mobile widths, so the page does not break when a user checks the link from a phone.
How this template helps you convert
The page is optimized as a Click-Through landing page with a single conversion goal: free-tier signup. Every structural decision supports that goal.
- Evidence before explanation: every spoke section opens with a hard number (latency, uptime, integrations) before any descriptive paragraph, so a skeptical engineer sees proof at first glance and keeps reading.
- Persistent call to action: the "Start Monitoring Free" button lives in the sticky nav on every scroll position, meaning the visitor never has to hunt for the next step, whether they are reading the Monitor section or the Scale section.
- Zero form friction on the page: the landing page contains no input fields. Both calls to action are click-throughs, so the only friction is the destination signup flow, not the page itself.
Other information about this template
This template is a practical reference for anyone building a landing page for cron job monitoring tools. The sections below provide additional context about how cron jobs work, how monitoring fits into real workflows, and how the template connects to broader ecosystem tools, including several brand-name products referenced in the monitoring space.
- Cron is a time-based job scheduler native to unix based operating systems such as linux and macOS. The cron daemon runs continuously in the background and is responsible for executing any job whose crontab schedule matches the current minute.
- Each user can have their own crontab file. You can open and edit it by running the following command in a terminal:
crontab -e. This launches the run select editor prompt, where you press enter to confirm your editor choice and begin editing. - A crontab entry uses cron syntax with five time fields: minute, hour, day of the month, month, and day of week. Day of week 0 represents Sunday. An asterisk in any field matches all values, so a line reading
* * * * * /usr/bin/php /path/to/script.phpruns that php script every minute using the full path to both the interpreter at /usr/bin and the script file itself. - Cron runs with a minimal environment. Environment variables that are available in an interactive shell may not be present during a cron job run. Always set required environment variables explicitly inside the crontab file or in a shell script that the job calls, and always use the full path to every binary and file.
- Common cron job errors include missing environment variables, incorrect file paths, permission issues on the script, and job overlap when a long-running task is still executing at its next scheduled time. Good error handling means routing output and error messages to a log file rather than relying on the default email behavior.
- By default, cron sends output to the local user via email notifications. You can override this using the MAILTO variable in the crontab to route output to a specific address, or redirect output to a log file using standard shell redirection on the command to execute.
- A backup script is one of the most common cron job use cases: configure cron jobs to run a shell script every hour, at a specific time each night, or at specified times each week to automate repetitive tasks such as database backups, file rotation, and report generation. You can also use the
@rebootdirective to execute a task each time the server starts. - For teams working with PHP applications, cron jobs that call
phpscripts are common for queue processing, cache warming, and report delivery. Referencing a docker image in deployment pipelines can help ensure the environment variables and runtime path available to the cron daemon match the application environment. - Tools like Cronitor, Healthchecks.io, and Cronhub offer centralized dashboards for tracking multiple jobs with logs, status, and alerts. Healthchecks.io provides a live-updating dashboard and color-coded status badges across any number of servers. Cronitor and CronitorCLI allow teams to register existing cron jobs for monitoring from a single location using an api key.
- Dashy and Glance are self-hosted options that use dynamic widgets and a single configuration file to aggregate status from multiple services. TenacitOS includes a dedicated Cron Manager with weekly timeline views and run history for multiple agents. Grafana dashboards built with Prometheus can also visualize cron job status in a unified view, which is a useful reference for teams who want to build a custom monitoring instance rather than use a managed service.
- This template's design references the single-screen philosophy: several landing page templates and tools are designed to monitor cron job status across multiple servers in a centralized view, and the Cron every job every server one screen landing page template specifically exists to help SaaS products in that space communicate their value with clarity and speed.
- The template includes adaptive theme support. Modern cron monitoring interfaces automatically trigger dark or light mode based on the user's operating system theme. The Void and Violet system ships in dark mode by default, matching the terminal aesthetic most DevOps engineers prefer.
- Actionable notification links are a key part of the Alert spoke. When a job fails, the alert card demonstrates how notifications can connect directly to tools like Slack, letting engineers move from a status view to incident resolution in one click without leaving the platform.
- The footer follows a GitHub developer-minimal pattern: clean, low-visual-noise, and focused on links relevant to a developer audience rather than a marketing audience.
Theme
Tech Glass
Creative direction
Stats-First Impact
Color system
Void & Violet
Direction
Click-Through
Page Sections
Stats-first Spoke Layout
Sticky Anchor Navigation
Hero Dashboard Screenshot Block
Glassmorphic Card System
Scroll-linked Animation Engine
Dual Call-to-action Architecture
Related questions
What is a cron job and how does the cron daemon work?
How do I edit my crontab file to add or change a scheduled job?
What are the most common cron job errors I should watch for?
Can this template support a product that monitors cron jobs across multiple servers?
What design system and typography does this template use?



