Kombucha Vertical SaaS Cost Calculator Website Template
Culture is a kombucha analytics landing page template built for fermentation intelligence platforms. It opens with a live Batch Yield Calculator, moves into a structured Feature Matrix data grid, and closes with a sticky call-to-action bar. The bioluminescent dark-lab design uses teal and active-green accents to make every data point feel earned and alive.
by Rocket studio
Quick summary
Culture is a single-page, dashboard-style landing page template for a kombucha fermentation analytics platform. It leads with an interactive Batch Yield Calculator, follows with a Feature Matrix data grid mapping brewery pain points to platform capabilities, and drives visitors toward a personalized onboarding flow. Every section is designed to feel like a live operational dashboard, not a brochure.
Who this template is for
This template is built for fermentation-tech founders, product teams, and go-to-market leads who need to convert technically minded brewery professionals. If you are launching or repositioning a vertical software-as-a-service product in the kombucha or fermentation space, this template gives you the right vocabulary and layout to do it.
- Head brewers scaling operations from ten-gallon pilot batches to thousand-gallon continuous brew systems
- Quality leads at kombucha brands who need consistent carbonation and flavor profiles across retail stock-keeping units
- Contract manufacturers managing multiple client recipes on shared equipment
What problem this template solves
Selling a data-heavy platform to brewers is hard when your landing page looks like every other software homepage. Brewers are hands-on, skeptical of marketing, and need to see their own numbers before they commit. Generic templates fail here because they cannot demonstrate the product's value in the first scroll.
- Visitors leave before understanding what the platform actually measures or why it matters to their operation
- A static feature list does not communicate real-time tracking capabilities the way an interactive calculator does
- Without a live demo path, skeptical buyers have no low-friction way to evaluate the product before clicking a call to action
What you get with this template
You get a complete, conversion-focused landing page layout purpose-built for a kombucha analytics platform. Every section is pre-structured and pre-styled so you can focus on filling in your real data and launching.
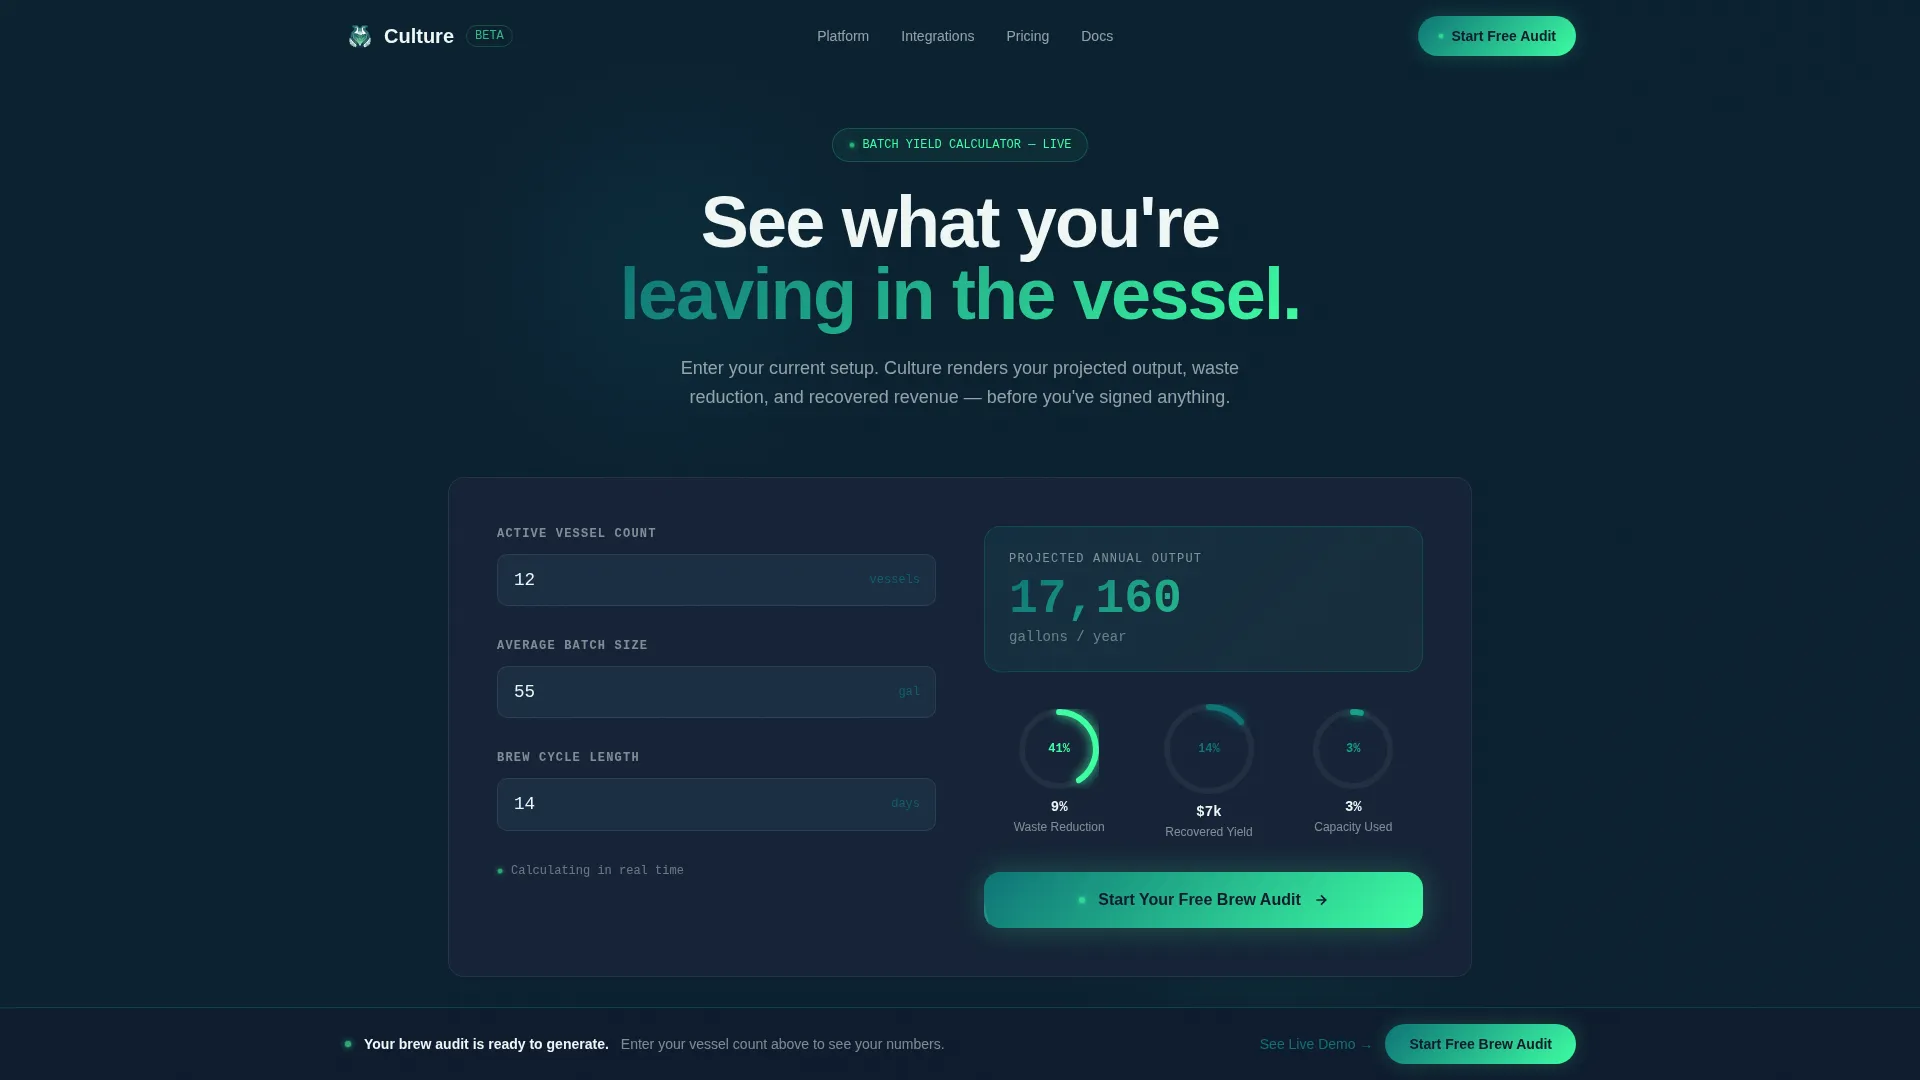
- A hero section with a working Batch Yield Calculator that renders projected annual output, estimated waste reduction, and a recovered-yield dollar figure
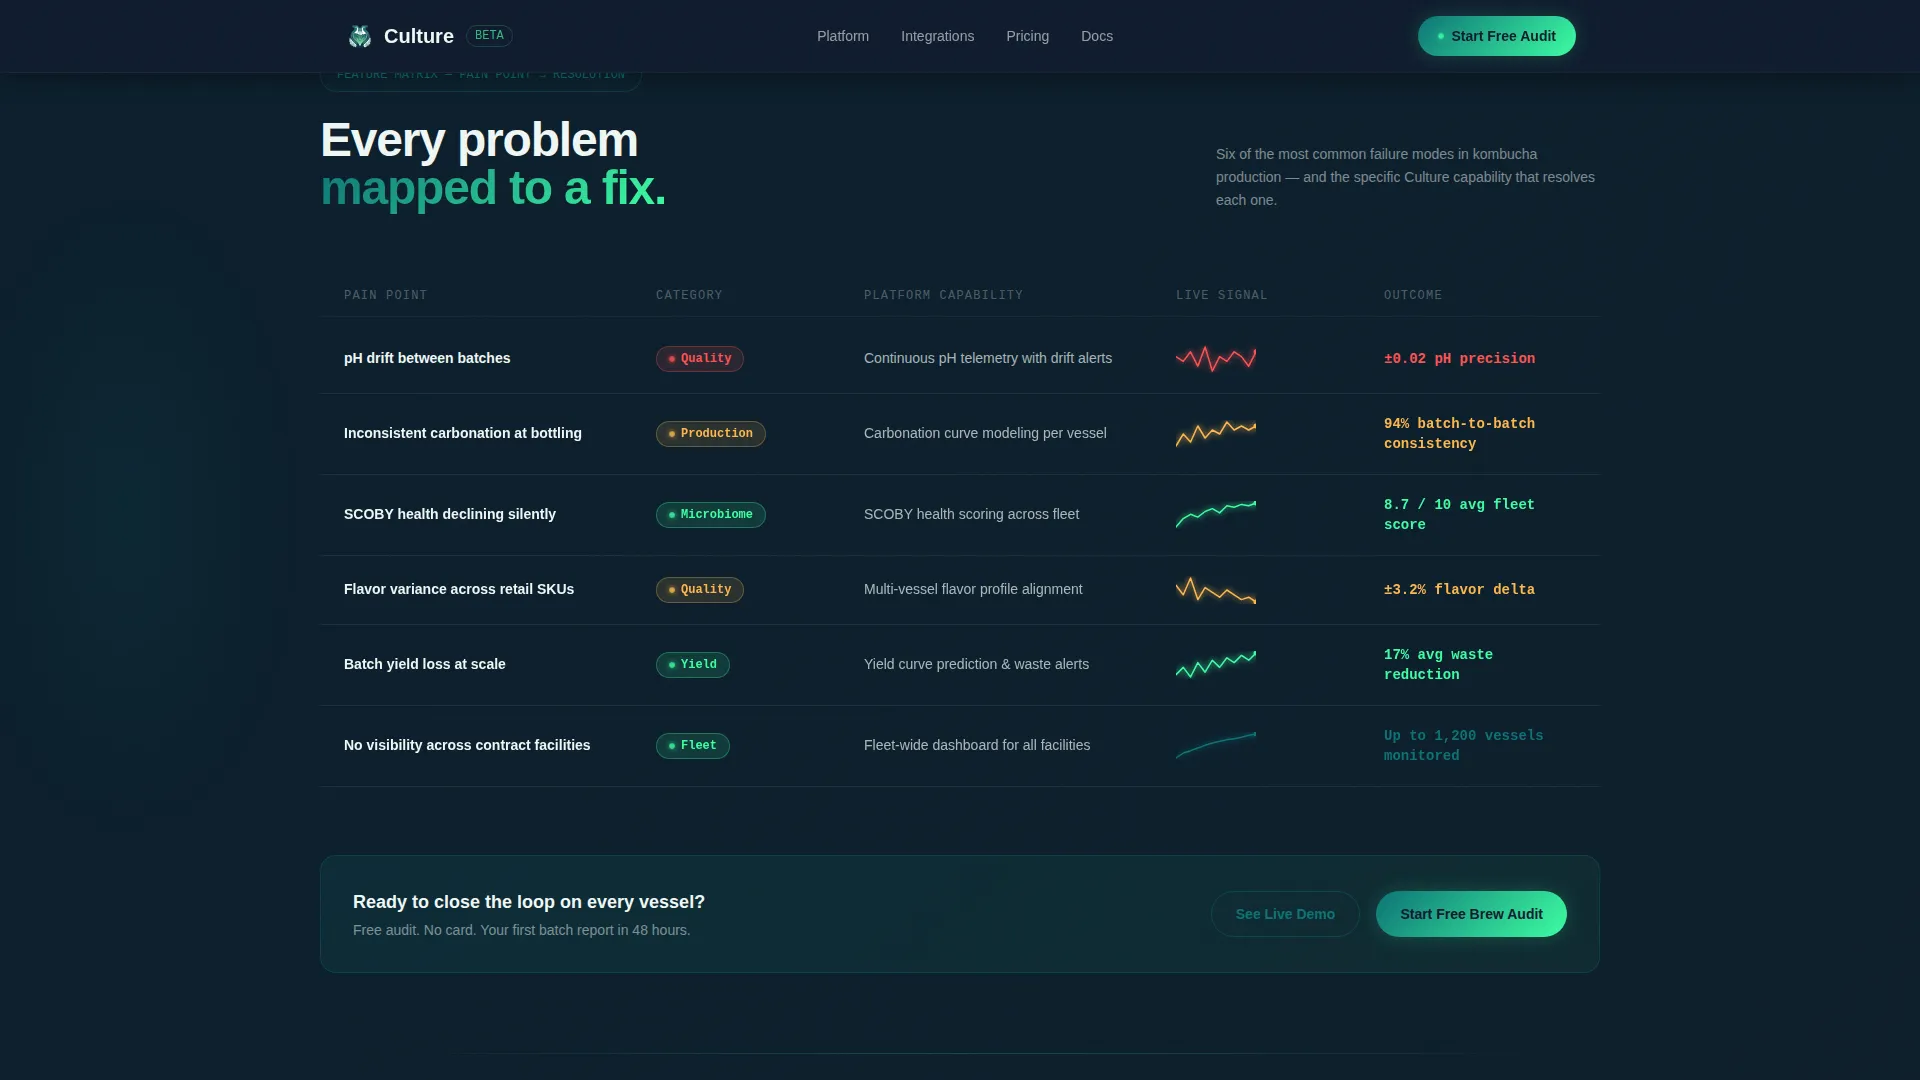
- A Feature Matrix data grid with rows mapped to brewery pain points and columns mapped to platform capabilities, including micro-visualizations like sparkline charts and color-coded status pills
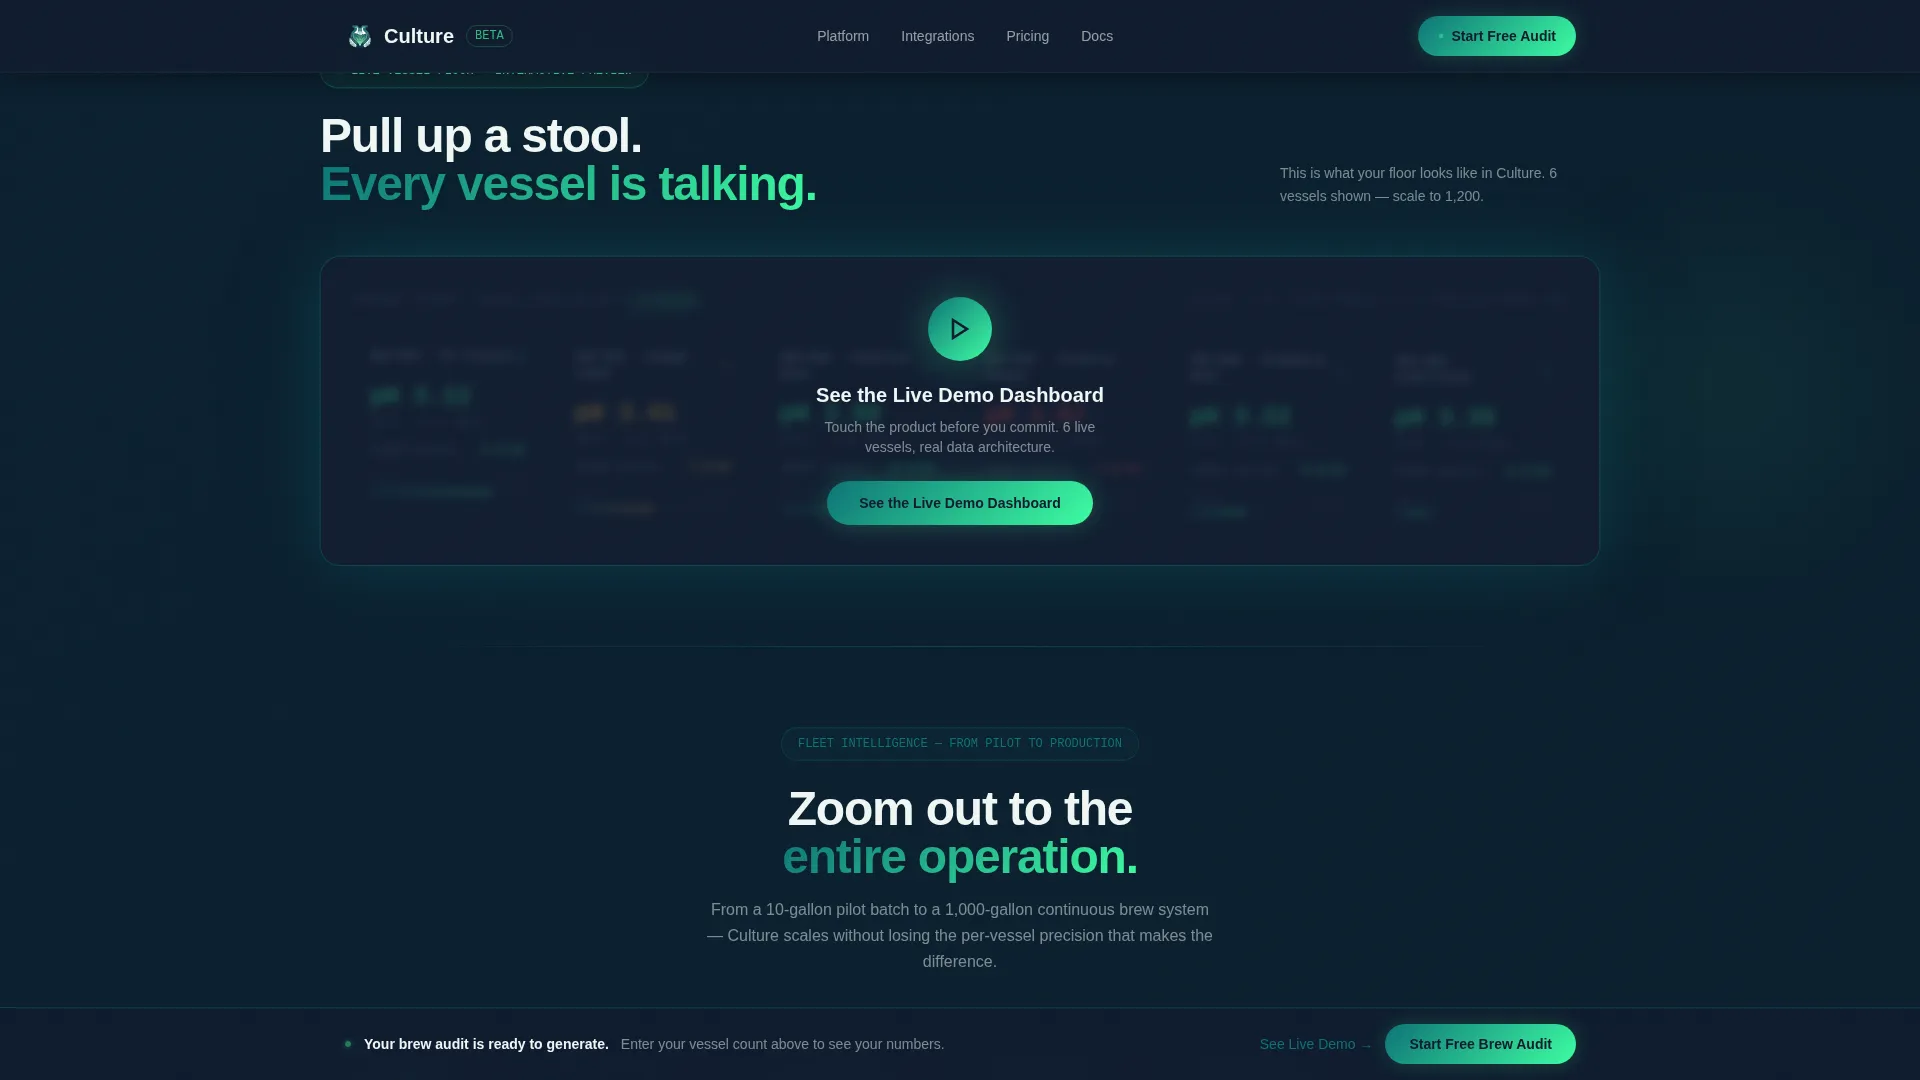
- A sticky call-to-action bar, a mid-page interactive demo embed trigger, and a click-through funnel architecture that carries calculator inputs forward into onboarding
Feature list
This template is built around a specific set of interactive and visual components. Each one is described below.
Batch Yield Calculator Hero
The hero section is a fully interactive estimator. Visitors enter vessel count, average batch size in gallons, and brew cycle length in days. The calculator instantly renders projected annual output, estimated waste reduction percentage, and a dollar figure for recovered yield. Numbers animate upward like a live ticker, and teal-to-green gradient progress rings fill as inputs change.
Feature Matrix Data Grid
Below the fold, a structured data grid maps common brewery pain points to specific platform capabilities. Each row addresses a real operational problem such as inconsistent carbonation, pH drift between batches, or flavor variance across vessels. Each column shows the platform feature that solves it, supported by micro-visualizations including sparkline charts, color-coded status pills, and tooltip previews of actual dashboard screens.
Sticky Call-to-Action Bar
The primary call to action, "Start Your Free Brew Audit," first appears inside the calculator results panel. After the visitor scrolls past the third grid row, a sticky bar locks it to the top of the viewport. The click carries the visitor's calculator inputs forward into a personalized onboarding flow. No form is required on this page.
Live Demo Embed Trigger
A secondary conversion path opens a mid-page interactive dashboard embed for visitors who want to explore the product before committing. This gives skeptical buyers a hands-on preview without leaving the page.
Fleet Analytics Showcase
A dedicated section widens the aperture from individual batch monitoring to multi-facility fleet analytics. The layout expands visually as the visitor scrolls, representing the platform's scale from a single vessel to an entire operation.
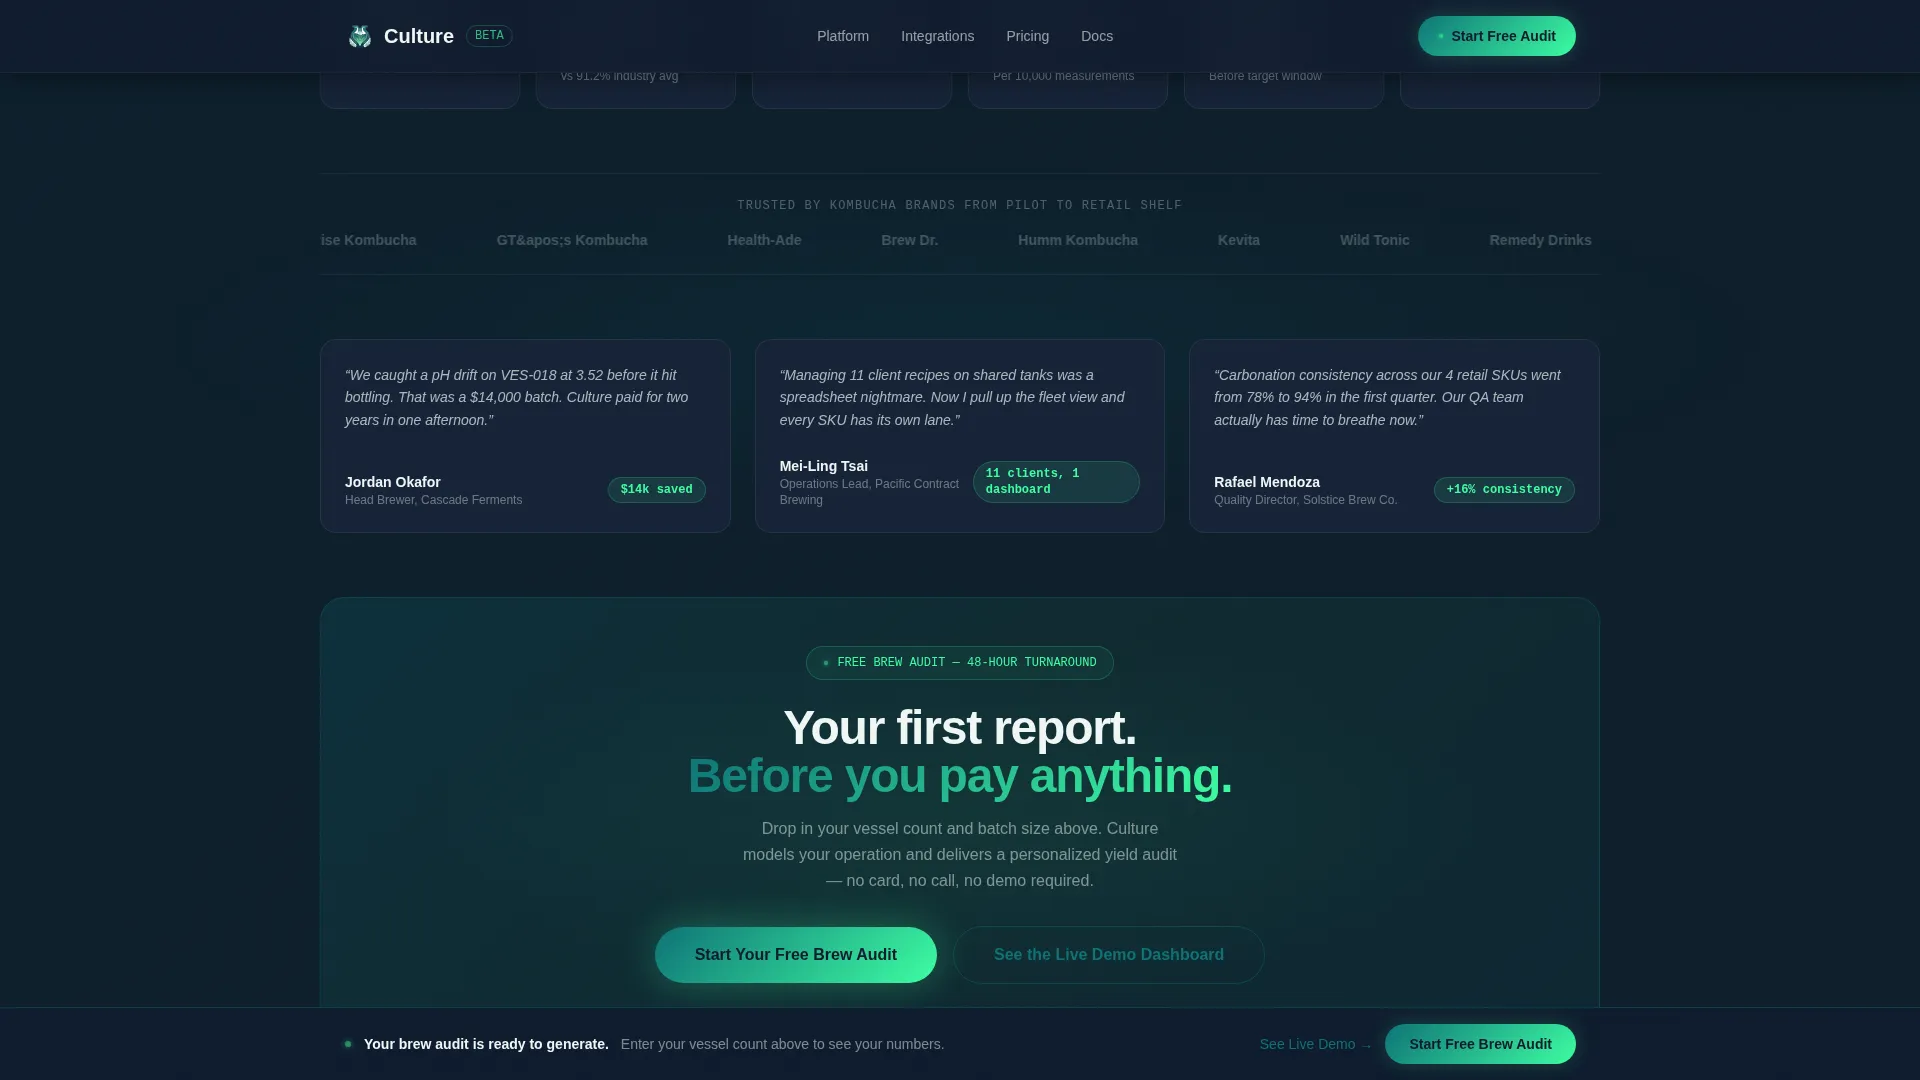
Social Proof and Metrics Section
A social proof strip presents brewery logos alongside concrete outcome numbers and named testimonials. This section anchors the platform's claims with real-world evidence before the final call to action.
Page sections overview
| Section | Purpose |
|---|---|
| Batch Yield Calculator | Interactive hero with animated output ticker and primary call to action |
| Feature Matrix Grid | Data grid mapping pain points to platform capabilities with micro-visualizations |
| Live Demo Embed | Mid-page interactive dashboard preview for hands-on evaluation |
| Fleet Analytics Showcase | Multi-facility scale visualization widening from vessel to operation |
| Social Proof Strip | Brewery logos, outcome numbers, and named testimonials |
| Footer | Linear single-row footer with navigation and secondary links |
Design & branding system
The visual identity channels a bioluminescent dark-lab aesthetic. Quiet, dark surfaces come alive with teal and green signal at every meaningful data point. The palette is disciplined: each color has a specific role and does not bleed into the wrong context.
- Midnight vessel (#0F1B2D) sets the dashboard background, deep fermentation teal (#0D7377) anchors primary brand elements, active culture green (#3DFFA2) sparks across live data points and progress indicators, and pale jun (#F0F7F4) breathes through cards and white space
- Typography uses DM Sans for body copy and user interface text, paired with JetBrains Mono for all data readouts and number displays
- Animation is intentionally high: number ticker effects, sparkline SVGs, pulse glow indicators, and scroll-reveal transitions all reinforce the sense that data is live and moving
Mobile & speed optimization
This template is designed desktop-first, reflecting the reality that dashboard and data-grid products are primarily used on larger screens by professionals at a workstation. The layout prioritizes density and readability at desktop widths.
- Static sections use server-rendered components for faster initial load, while the calculator and animations run as isolated client components
- The sticky call-to-action bar and demo embed trigger are designed to remain functional and unobtrusive across viewport sizes
- High-animation elements such as number tickers and sparkline SVGs are scoped to client components to avoid blocking the initial page render
How this template helps you convert
The conversion architecture is built around the calculator. By the time a visitor has entered their own numbers and seen a dollar figure rendered back to them, the call to action feels like a natural next step rather than a sales push.
- The Batch Yield Calculator creates personal investment early: visitors see their own projected output and recovered yield before reading a single feature description, making the platform's value immediately concrete.
- The Feature Matrix tightens the case row by row, addressing specific pain points that head brewers and quality leads recognize from their daily work, so objections are resolved inside the scroll rather than after the click.
- The sticky call-to-action bar and the secondary demo embed path serve two distinct buyer types simultaneously: those ready to start and those who need one more look at the product before committing.
Other information about this template
This template is categorized under Technology, with a subcategory focus on kombucha vertical software-as-a-service and a niche alignment to kombucha analytics dashboards. It was designed using the Startup Velocity theme and the Teal Catalyst color system. The creative direction follows a Feature Matrix layout pattern, the header concept is a Calculator or Estimator, and the landing page funnel direction is Click-Through.
- Built for B2B software-as-a-service products in food and beverage technology, specifically fermentation analytics
- Localized for English language, United States dollar currency, and United States date format
- Designed as a desktop-first experience suited to data professionals who work primarily at a workstation
Theme
Startup Velocity
Creative direction
Feature Matrix
Color system
Teal Catalyst
Style
Dashboard/Data Grid
Direction
Click-Through
Page Sections
Interactive Batch Yield Calculator
Feature Matrix Data Grid
Sticky Call-to-action Bar
Live Demo Embed Trigger
Fleet Analytics Showcase
Social Proof and Metrics Strip
Related questions
Can I use this template for a fermentation platform outside kombucha?
Does the Batch Yield Calculator submit data on this page?
What is included in the Feature Matrix section?
Is this template set up for a free-trial or demo-request funnel?
How does the color system work and can it be changed?



