Specialist Retail Software Cost Estimator Website Template
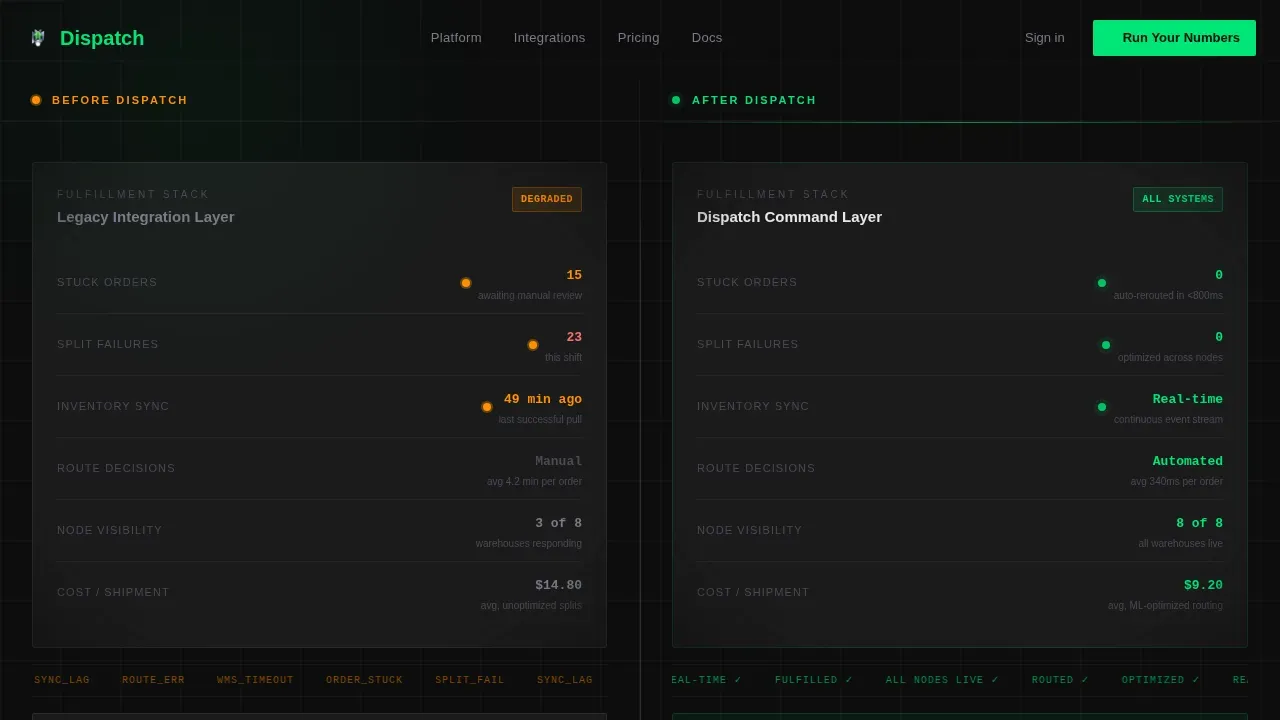
The Dispatch precision order routing platform landing page template is a dark-glass, split-screen layout built for B2B retail operations teams. It visualizes Before versus After fulfillment data side by side, runs scroll-triggered stat duels, and includes an inline ROI calculator. Operations directors and e-commerce leaders can prove the cost of their legacy stack before ever typing a name.
by Rocket studio
Quick summary
This dispatch precision order routing platform landing page template is engineered for mid-market retailers and omnichannel brands. It pairs a Tech Glass visual identity with a Stats-First Impact creative direction. The result is a single-page experience that scorecards legacy operations against automated dispatch in real time, then converts visitors through an inline ROI calculator.
Who this template is for
This template is built for operations and e-commerce leaders who manage high-volume order fulfillment. It speaks directly to the people responsible for keeping delivery routes running without failures.
- Operations directors managing oversold inventory across multiple fulfillment centers
- VP of e-commerce at omnichannel brands manually stitching together feed connections
- Fulfillment managers who need real time visibility into warehouse status at any hour
What problem this template solves
Manual route planning slows every order. Communication breakdowns between warehouses, stores, and third-party logistics providers create delivery errors that erode customer satisfaction. Companies that cling to manual processes risk inefficiency, error-prone dispatches, and dissatisfied customers. This template gives you the layout to present automated dispatch as the clear solution.
- Stuck orders and split-shipment failures visible only after the damage is done
- Inventory sync lag that leaves customer service teams reacting instead of preventing
- No centralized platform to compare legacy costs against optimized dispatch operations
What you get with this template
You get a fully structured landing page built around competitive data storytelling. Every section is designed to deliver real time tracking context, route optimization proof, and a clear financial argument. Efficient dispatch operations significantly enhance customer satisfaction by ensuring timely deliveries and accurate order fulfillment.
- A 50/50 split-screen hero with "Before Dispatch" and "After Dispatch" glass panels
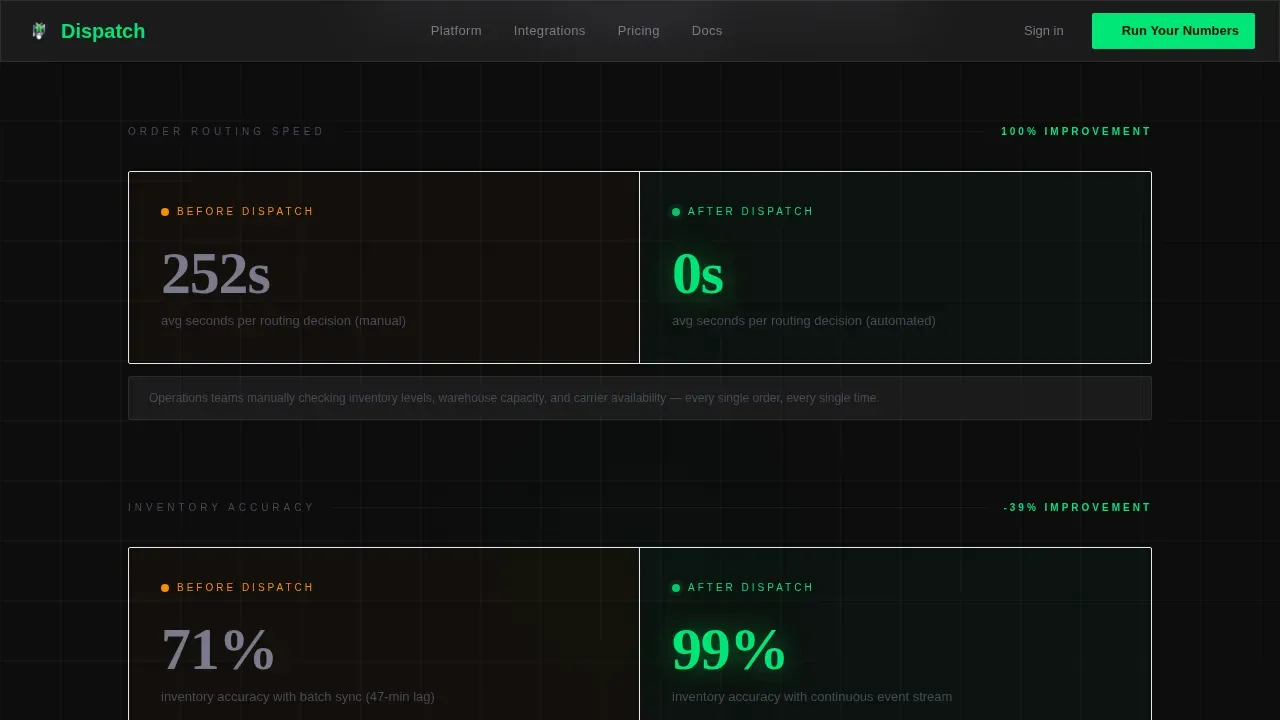
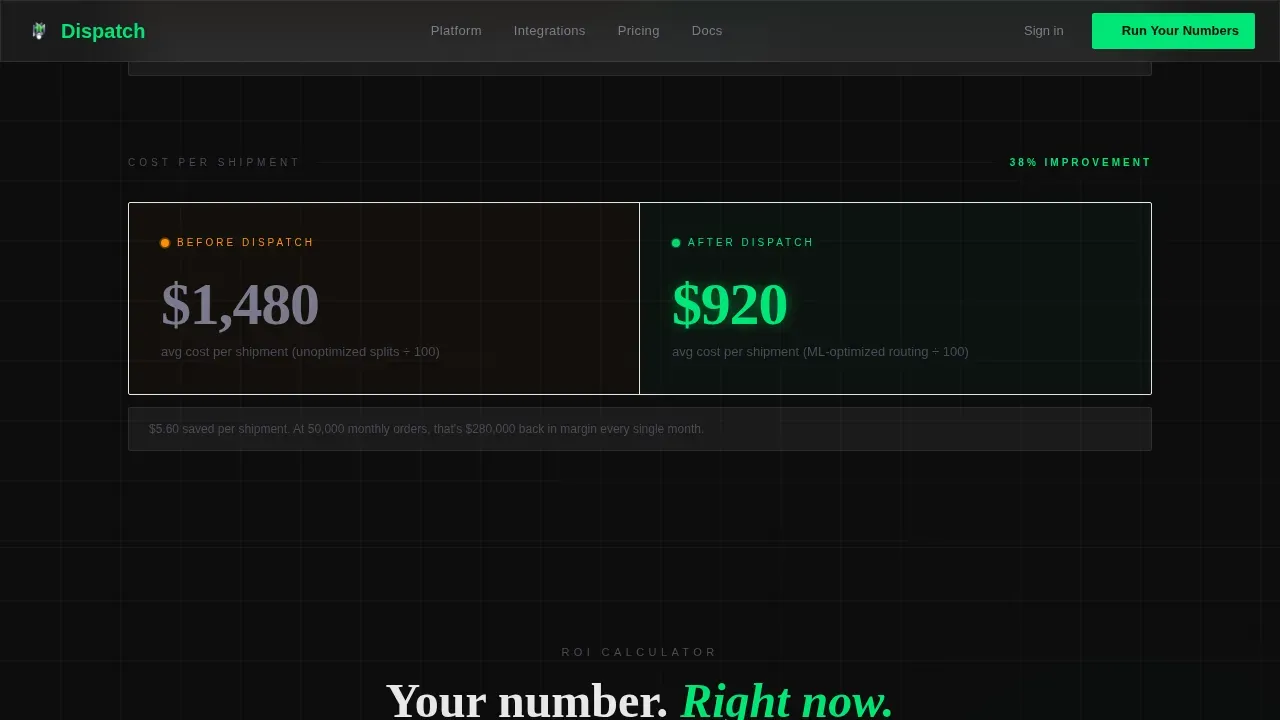
- Three scroll-triggered stat duel sections comparing delivery routes, inventory accuracy, and cost-per-shipment
- An inline ROI calculator and a gated PDF download as dual conversion paths
Feature list
This template includes a focused set of components, each mapped directly to a buyer objection or decision moment.
Split-Screen Hero with Live Data Theater
Two frosted-glass panels float side by side against a carbon black background. The left panel shows painful legacy metrics: stuck orders, split-shipment failures, and an inventory sync timestamp reading 47 minutes ago. The right panel resolves every figure in signal green. Proactive communication, live order tracking, and precise delivery times are visualized without a single photograph.
Scroll-Triggered Stat Duel Sections
Each scroll reveal animates count-up numbers from zero. Delivery routes, inventory accuracy percentage, and cost-per-shipment all appear as head-to-head comparisons. The left side lands on a muted gray pain figure while the right side hits its number with a green micro-pulse. Route optimization technologies are shown in action, not described in paragraphs.
Inline ROI Calculator
Visitors enter their monthly order volume, number of fulfillment nodes, and current split-shipment rate. Advanced algorithms instantly render a projected savings figure on the right glass panel. An interactive ROI calculator helps potential clients see projected savings based on their delivery capacity before they share contact details.
Cumulative Savings Viewport
The final data section totals the cumulative difference in a single dollar figure sized to fill the screen. Predictive analytics-style presentation makes the financial gap undeniable. This is where real time data lands hardest, turning a browsing session into a buying decision.
Dual Conversion Path Footer
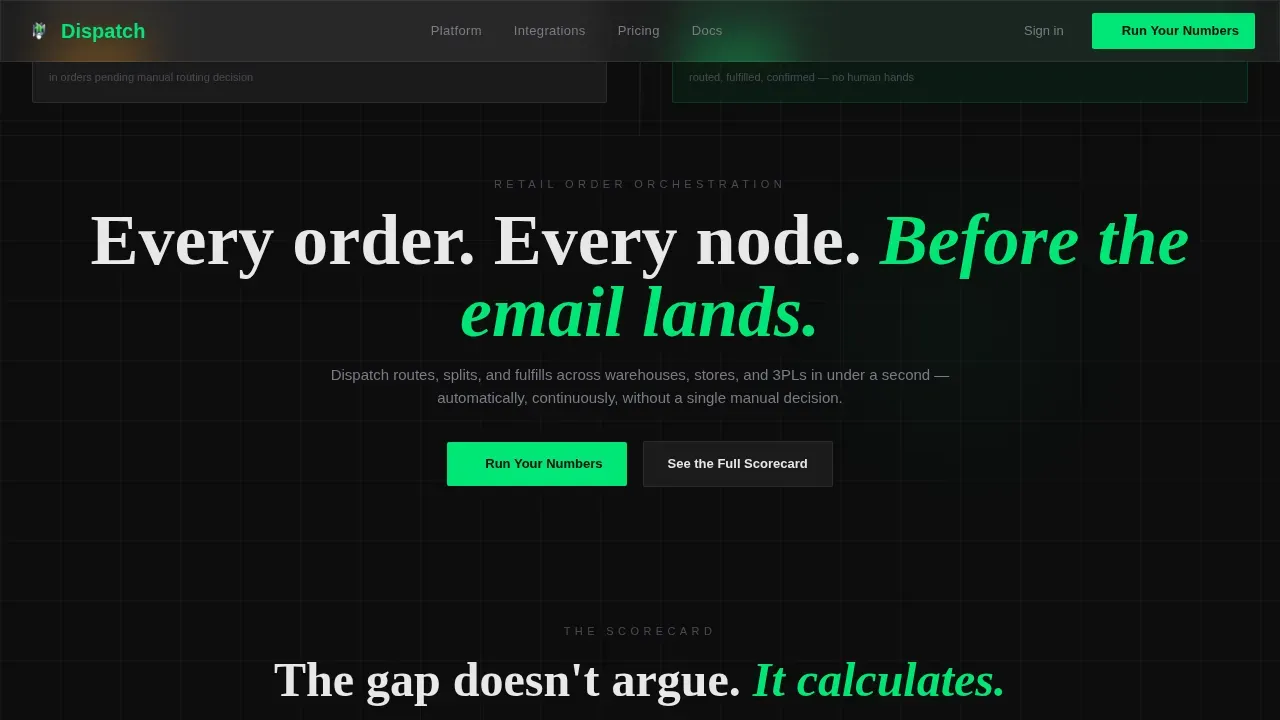
A primary call-to-action labeled "Run Your Numbers" anchors the inline calculator. A secondary path offers "See the Full Scorecard" gated by work email only. Persistent and contrasting call-to-action buttons maintain visibility during scrolling, giving both high-intent and research-stage visitors a clear next step.
Carbon Fiber Design System
DM Sans handles all user-interface and data labels. Fraunces carries the editorial headlines. Signal green (#00E676) is reserved exclusively for live data points and call-to-action states. The palette behaves like the interior of a luxury vehicle dashboard at night: dark surfaces that disappear so the information on them feels self-illuminated.
Page sections overview
| Section | Purpose |
|---|---|
| Hero Split Screen | Side-by-side before/after glass panels visualize stuck versus. resolved orders |
| Stat Duel One | Head-to-head order routing speed with count-up animation |
| Stat Duel Two | Inventory accuracy and cost-per-shipment comparison |
| ROI Calculator | Inline tool renders projected savings from fulfillment inputs |
| Cumulative Savings | Full-viewport dollar figure summarizes total cost gap |
| Footer | Linear single-row dual call-to-action with gated PDF path |
Design & branding system
The visual identity follows a Tech Glass theme over a Carbon Fiber color system. Every design decision reinforces urgency, precision, and operational control.
- Colors: deep carbon black (#0D0D0D), woven graphite (#1A1A2E), translucent panel glass (rgba 255,255,255 at 6% opacity), and signal green (#00E676) for live data and call-to-action states
- Typography: DM Sans for interface and data labels, Fraunces for editorial headlines
- Animation: high-intensity count-up numbers, pulsing green dots on live metrics, scroll-triggered stat duels, and glass panel depth-of-field blur at panel edges
Mobile & speed optimization
The layout is desktop-first, reflecting how operations directors and fulfillment managers work at dashboards during active logistics cycles. The template structure also supports responsive rendering for field service managers who check routes and drivers from mobile devices.
- Sections use server components for static content and client components for the calculator and animations, keeping planning time low for the developer
- The landing page is structured to load critical above-the-fold content first, reducing time to first meaningful data display
- Mobile layout preserves the split-screen hierarchy so tracking and route management data remain readable on smaller viewports
How this template helps you convert
A landing page for a precision order routing platform must highlight efficiency, visibility, and automation to drive conversions. This template earns the click by proving the cost gap with real math before asking for any contact information.
- The hero immediately states how the platform reduces operational costs, increases routing speed, and improves customer satisfaction, satisfying the primary buyer question above the fold.
- Each stat duel section deepens the argument with head-to-head metrics, so visitors gain real time visibility into what dispatch management improvement actually looks like in numbers.
- The ROI calculator lets visitors self-qualify by entering their own data, making the conversation about their projected savings figure rather than a generic sales pitch.
Other information about this template
This template is designed for businesses in retail logistics, e-commerce fulfillment, and field service operations. It covers a range of topics discussed in modern dispatch management, from last mile delivery efficiency to fleet performance and fuel costs.
- Optimizing delivery routes with advanced algorithms can reduce fuel consumption and lower operational costs, which the stat duel sections illustrate directly
- Data analytics and predictive analytics sections show how automated dispatch improves delivery management across peak seasons and beyond
- End-to-end visibility provides a single source of truth for drivers, dispatchers, and customers, and the template's centralized platform layout reflects that principle
- Digital proof of delivery (ePOD), which includes capturing signatures, photos, and notes to eliminate delivery disputes, can be featured as a key component in the feature or stat sections
- The template supports thought leadership positioning by framing real time traffic adaptation and last mile route management as measurable operational advantages
- Companies building a powerpoint presentation or internal business case for an order routing platform can repurpose the stat duel structure as a visual argument framework
- Large enterprises and growing mid-market businesses alike will find the template's scalable section structure relevant to their dispatch operations
- Businesses should monitor order processing time, dispatch accuracy rates, and inventory turnover to assess dispatch efficiency, and this template gives them the layout to present those improvements publicly
- The driver app and vehicle locations tracking story can be told within the stat duel or feature blocks without requiring additional custom sections
- Offering real time updates to customers during the delivery process builds customer loyalty, reduces inbound calls to customer service teams, and contributes to enhanced customer satisfaction over time
Theme
Tech Glass
Creative direction
Stats-First Impact
Color system
Carbon Fiber
Style
Split Screen (50/50)
Direction
Comparison/Versus
Page Sections
Split-screen Before Versus. After Hero
Scroll-triggered Stat Duel Sections
Inline ROI Calculator with Live Output
Cumulative Savings Full-viewport Close
Carbon Fiber Tech Glass Design System
Dual Conversion Path with Gated PDF
Related questions
What type of businesses is this template best suited for?
Can I adapt the stat duel sections to fit my own metrics?
How does the ROI calculator section work?
Is the template optimized for desktop use?
Can the gated PDF download section be customized?



