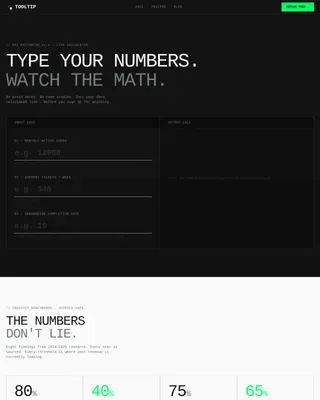
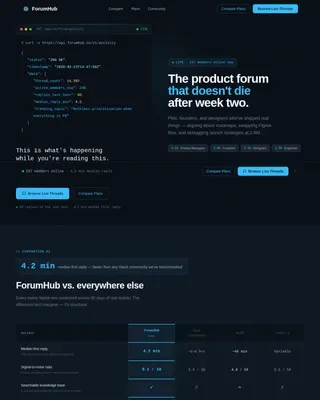
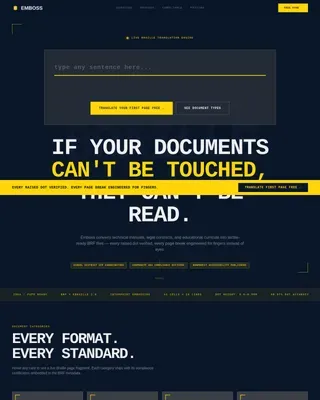
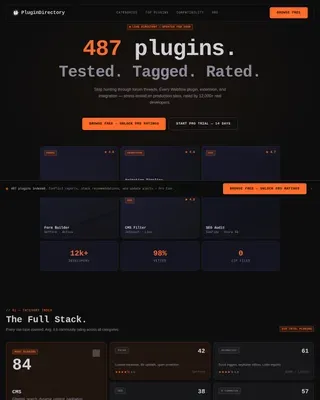
Discover — Actionable Research Insights Landing Page Template
The Benchmark landing page template turns raw survey data into a high-converting intelligence report experience. Built for VP-level SaaS operators, HR directors, and strategy consultants, it combines a bento grid layout, animated dashboard mockup, and a progressive lead-capture form to gate premium competitive intelligence behind a single, frictionless email exchange.
by Rocket studio
Quick summary
This template is a benchmark unlock sharp survey intelligence landing page template built for B2B data businesses that need to turn thousands of survey responses into qualified leads. It uses a bento grid layout, an animated dashboard header, and a two-step gated form to create a compelling exchange: visitors see enough real data to trust the report, then unlock the full picture by submitting their work email.
Who this template is for
This template is built for a precise, demanding target audience. These are not generalist marketers. They are operators who live inside data every day and will immediately recognize whether a report is credible or padded.
- VP-level operators at SaaS companies who need verified compensation benchmarks to set defensible pay bands
- HR directors who must identify gaps between internal pay structures and real market rates before the next planning cycle
- Strategy consultants who anchor $200K-plus recommendation decks on third-party survey data and need a credible report to cite
What problem this template solves
Many organizations that own valuable survey data struggle to present it in a way that feels authoritative rather than academic. The raw information exists. The insights are buried inside it. But without the right structure, the report page fails to convert visitors into leads. Teams end up flying blind on positioning, unsure why their report generates traffic but not form submissions.
- Visitors cannot see enough data to trust the report, so they leave without converting
- The lead-capture form asks for too much too soon, creating friction that kills conversions before they start
- The page has no visual proof of depth, so competitors with better-looking reports win the click even when your data is stronger
What you get with this template
You get a complete, ready-to-deploy landing page designed around a single job: turn survey data into captured leads. Every section is purposeful. Every visual element is chosen to build trust and move the visitor toward the form.
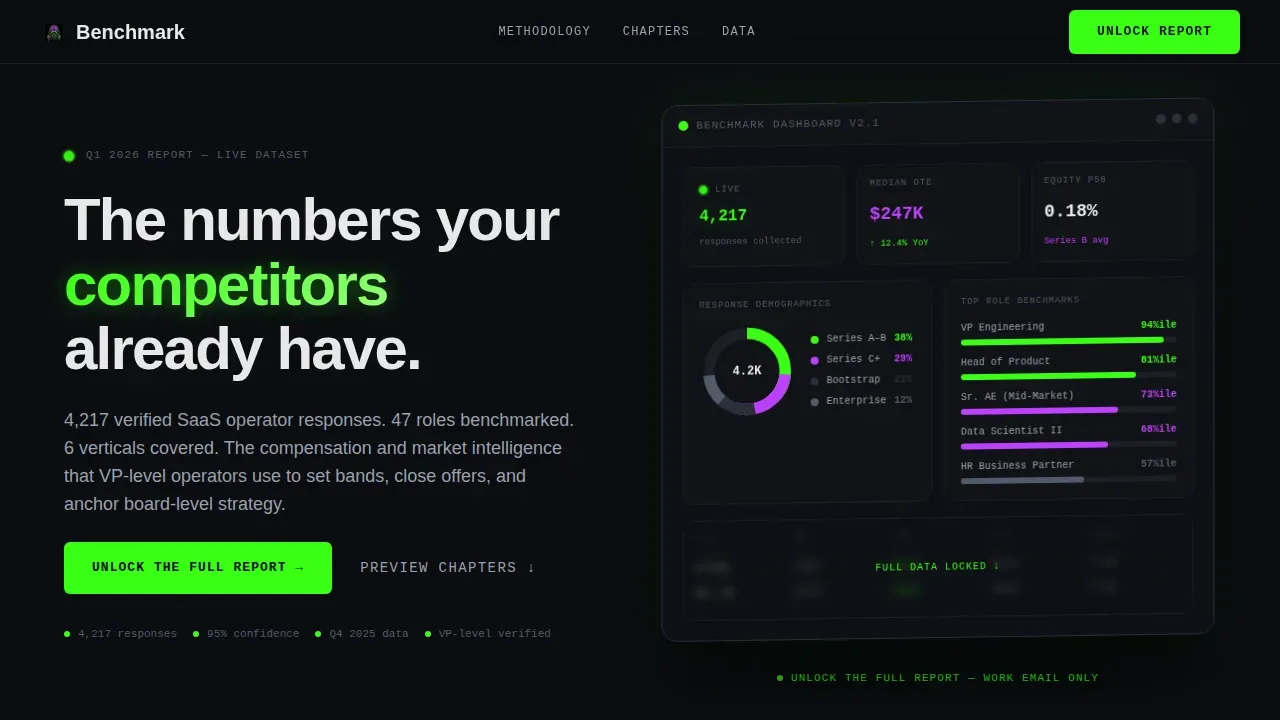
- An animated dashboard header mockup showing live-ticking data, a donut chart, a bar ranking, and a KPI card reading "4,217 responses collected"
- A bento grid of report preview tiles, each blurred just enough to prove the data is real without giving it away freely
- A progressive two-step lead generation form that starts with just a work email field and expands to collect company size, job title, and chapter preference
Feature list
This template includes a focused set of built-in components, each designed to support the report-gating process from the first impression through the final form submission.
Animated Dashboard Header
The header is a pixel-perfect isometric dashboard mockup floating against a void black background. Data values tick upward in real time using a setInterval animation. Visible components include a donut chart for response demographics, a horizontal bar ranking top benchmarks, and a KPI card with a green pulse dot. This above-the-fold treatment is the most critical real estate for conversion, and it is built to prove competence before the visitor reads a single word.
Problem Arc Bento Tiles
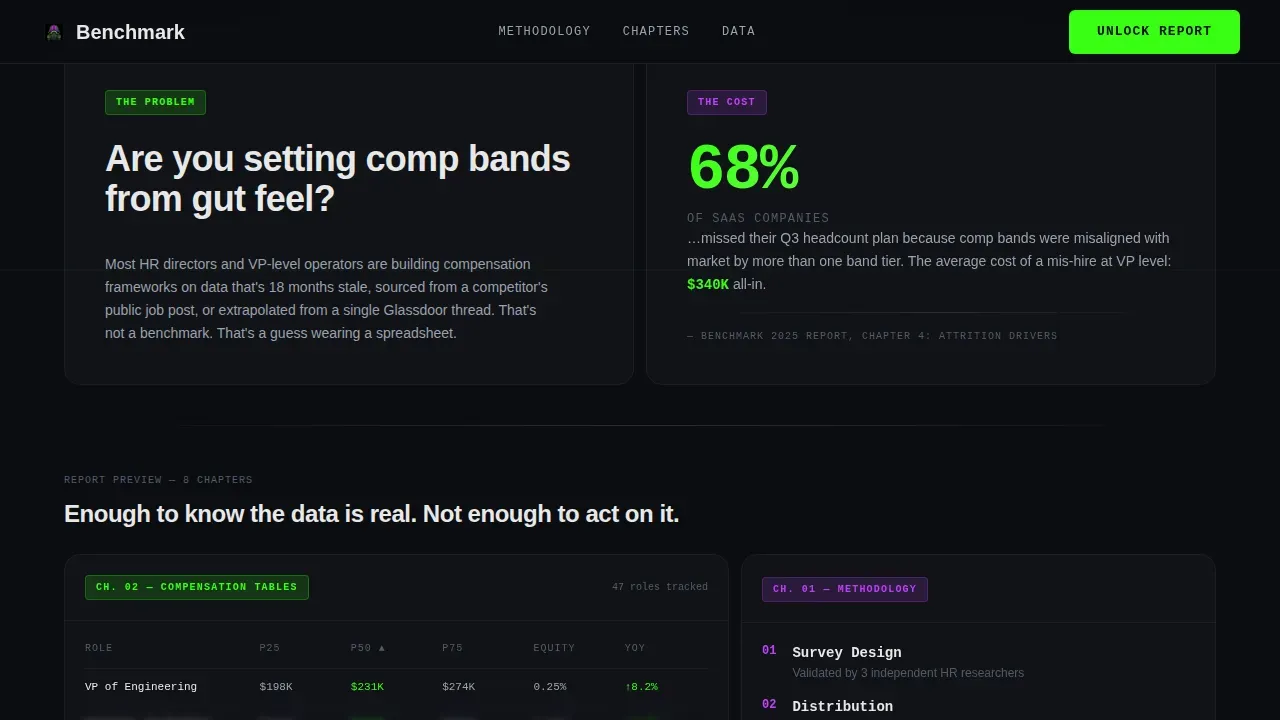
The first two bento tiles below the header follow a deliberate Problem to Solution structure. The opening tile poses a blunt, uncomfortable question aimed directly at the target audience. The second tile answers with a quantified cost-of-ignorance stat drawn from the report itself. This two-tile asymmetric layout creates tension that pulls the visitor into the rest of the page.
Blurred Report Preview Grid
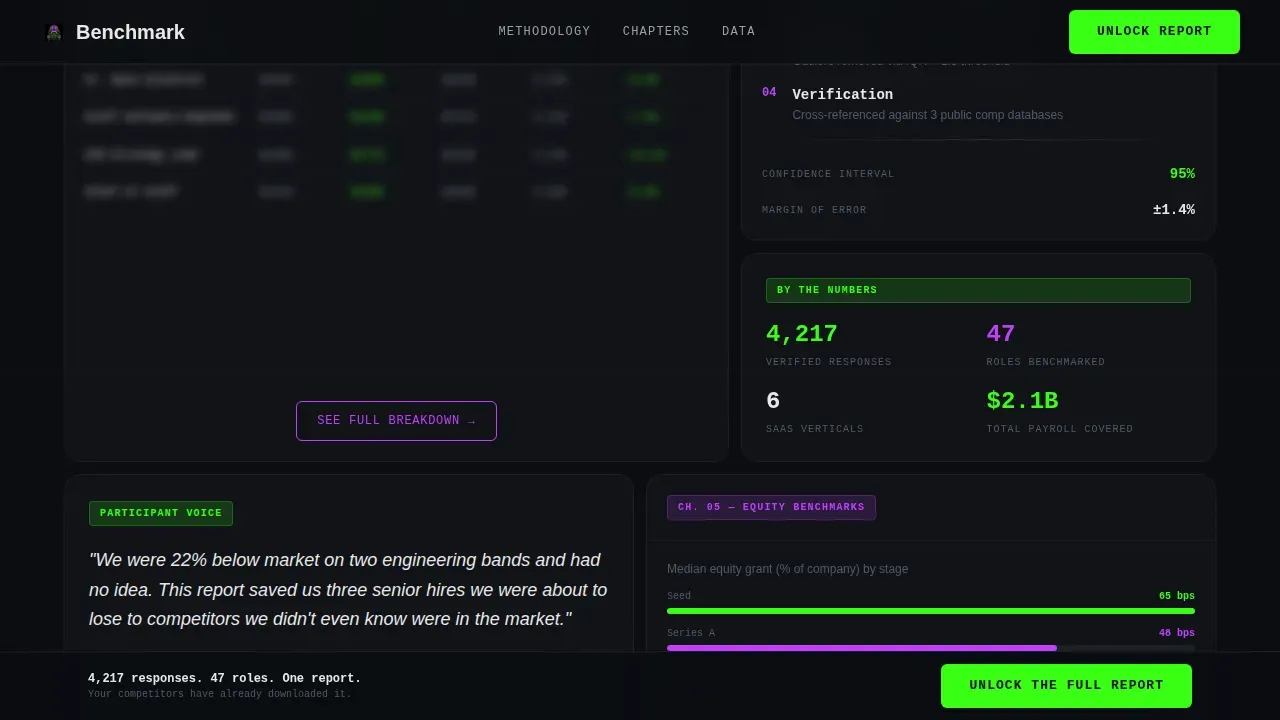
The core bento mosaic contains four distinct preview tiles. One shows a methodology snapshot to signal survey design rigor. Another displays a sample data table with rows blurred beyond the preview threshold. A third features a quote from a participating executive. A fourth shows a bar chart preview. Each tile carries its own contextual call to action, "See the full breakdown," funneling clicks to the same gated form. The blur is the conversion mechanic: visitors can see enough to know the data is real but not enough to act on it.
Progressive Two-Step Lead Form
The lead generation form is a two-step progressive experience. Step one shows only a single work email field with one button, minimizing form fields to reduce friction. After submission, an expanding panel requests company size, job title, and the specific benchmark chapter the visitor cares about most. This approach balances lead quality with conversion volume by asking for context only after the first commitment is made. Conversion forms that require only essential information enhance lead capture efficiency, and this template applies that principle at the structural level.
Sticky Call-to-Action Bar
After the visitor scrolls 40 percent of the page, a sticky bar appears at the top of the viewport with the primary call to action: "Unlock the Full Report." Spring physics govern the entrance animation, making the bar feel responsive rather than jarring. This persistent prompt keeps the conversion opportunity visible throughout the entire scroll journey without interrupting the reading experience.
Credibility Strip
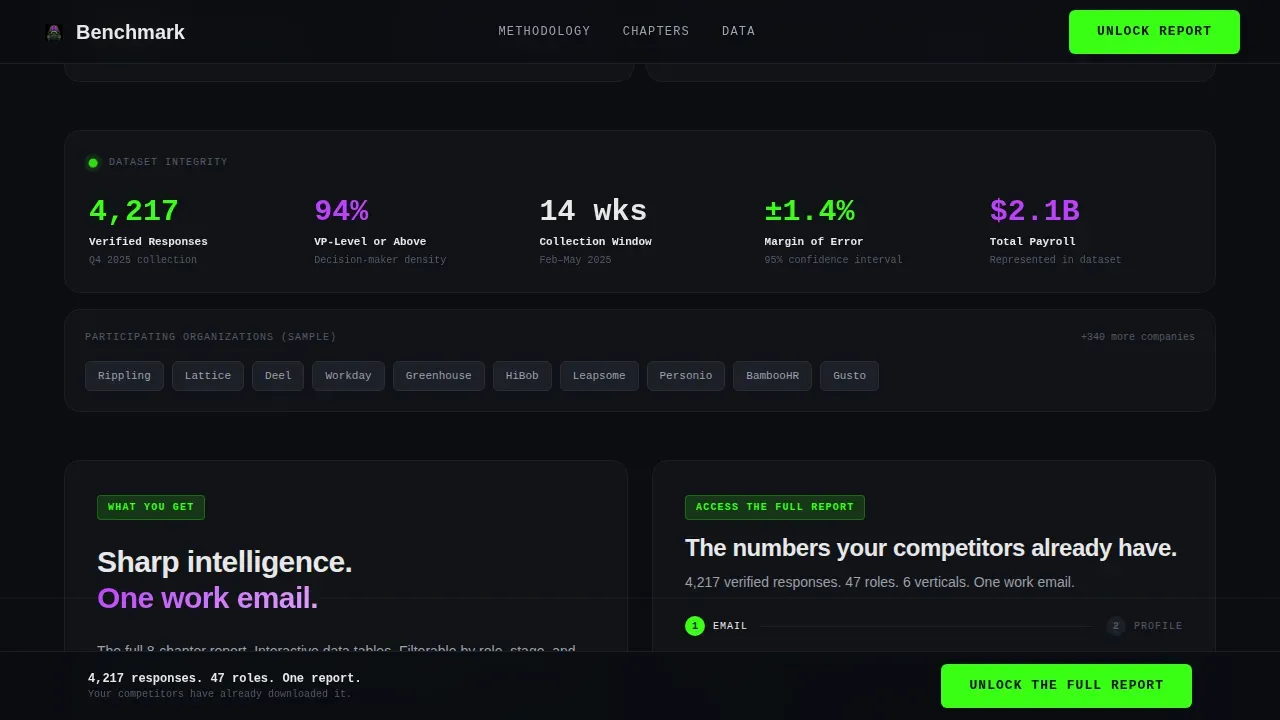
A dedicated credibility section displays response demographics, participation stats, and a company-size breakdown donut. Social proof elements like these build trust with a skeptical, senior-level audience. The credibility strip surfaces the metrics that matter most to a VP or director evaluating whether the data is worth their work email: how many people responded, who they were, and what size companies they represent.
Page sections overview
| Section | Purpose |
|---|---|
| Hero Dashboard Mockup | Prove data depth above the fold with animated live metrics |
| Problem Arc Tiles | Create tension with a blunt question and a cost-of-ignorance stat |
| Bento Report Preview | Show blurred chapter tiles that prove the report is real and specific |
| Credibility Strip | Surface response count, demographics, and company-size breakdown |
| Lead Generation Form | Capture work email first, then expand to collect profile context |
| Footer Flow | Close the page with a clean horizontal navigation pattern |
Design & branding system
The visual identity uses the Acid Digital color system layered over a Dashboard Pro theme. The result feels like a Bloomberg terminal redesigned by a Berlin techno poster artist: clinical precision soaked in synthetic glow. Every color choice serves a functional role in the conversion process.
- Void black (#0B0D11) dominates every background tile, creating the dark-mode immersion that makes data visualizations pop
- Terminal green (#39FF14) marks live data points, progress bars, the pulse dot animation, and every primary call-to-action button
- Electric violet (#BF40FF) highlights secondary callouts, hover states, and chart accents, while phosphor white (#E8E8E8) keeps long-form body text readable without breaking the dark aesthetic
- JetBrains Mono is used for all data labels and metrics; Plus Jakarta Sans handles headlines and body copy for contrast and hierarchy
Mobile & speed optimization
The template is built desktop-first, prioritizing the experience of a VP-level operator reviewing data at a workstation early in the morning. However, the layout is fully responsive and scales down to 375 pixels wide without losing structural integrity. Mobile-first design is essential as a significant portion of traffic comes from mobile devices, and the template accounts for this with fluid bento grid reflow.
- Scroll-triggered bento tile reveals use IntersectionObserver for smooth, dependency-free entrance animations that do not block the main thread
- Server Components handle all static sections, reserving Client Components only for animations and the progressive form, keeping the interactive payload lean
- The sticky call-to-action bar uses spring physics for entrance timing, ensuring the prompt feels smooth rather than abrupt on both desktop and mobile viewports
How this template helps you convert
A landing page should have one job. This template's job is to exchange a full report for a work email. Every design decision supports that single outcome, from the blurred data tiles to the progressive form structure.
- The animated dashboard header proves the data is real before the visitor reads the headline, so the above-the-fold impression earns trust immediately and keeps the visitor reading rather than bouncing
- The blur-to-call-to-action mechanic on each bento tile creates a repeating micro-conversion moment throughout the scroll, making every preview tile a funnel entry point rather than just a visual element
- The two-step progressive form removes the friction of a long form at first contact, then captures richer profile data after the visitor has already committed, which improves both conversion rate and lead quality simultaneously
Other information about this template
This template is specifically categorized under White Paper and Research within the Documentation and Support category, with a niche focus on Benchmark and Survey Report use cases. It is an ideal foundation for any business that has gathered survey responses at scale and needs a structured process to convert that data into leads.
- The template supports use cases where sales teams need third-party data to anchor outreach conversations, where marketing teams need a content asset that drives inbound leads through gated report distribution, and where an organization needs to identify trends in compensation, satisfaction, or market positioning across a defined respondent pool
- Competitive intelligence is a primary driver of demand for this type of report. A competitive intelligence report is most valuable when every insight leads to a specific, actionable recommendation tied to business impact. This template is built to present that kind of structured competitive intelligence in a format that decision-makers trust on first impression
- The template's survey design philosophy reflects best practices for high-quality data collection. Attribution surveys should be designed with intention to capture high-quality insights. Asking attribution survey questions immediately after a transaction captures decision-making while it's still fresh, reducing recency bias that can skew survey data. The methodology tile in the bento grid surfaces this rigor visually, giving visitors confidence in the data before they commit their email
- AI tools can process thousands of survey responses in minutes, identifying key themes and sentiment patterns. This template is built to present the output of that kind of analysis in a scannable, trustworthy format. AI can generate reports with key findings and recommendations based on survey data analysis, and this template gives those findings a presentation layer that converts
- The quality of a competitive intelligence report depends on the quality of the information gathered. Effective survey design includes minimizing bias and ensuring survey questions are clear and relevant to the respondent's experience. The methodology snapshot tile in the bento grid communicates this quality signal directly to the reader
- AI-powered analytics can help sales teams identify areas where they can add value and improve their strategies. Digital account management powered by artificial intelligence can create personalized marketing and sales campaigns for specific accounts. This template supports those workflows by capturing structured lead data, including job title, company size, and chapter preference, through the progressive form
- Employee relations teams that track key performance indicators (KPIs) aligned with business objectives can use benchmark reports like this one to identify areas where their organization's performance metrics diverge from market norms. Organizations that leverage data for predictive analytics can identify early warning signs and mitigate risks before they escalate. This template is equally suited to HR-focused benchmark reports as it is to compensation or competitive intelligence reports
- Social listening and social media signals can surface early signals of emerging trends among competitors. Many organizations that gather insights from social media and other channels will find that this template's structure helps them present those findings alongside survey data for a more complete competitive intelligence package
- The template supports A/B testing on key elements such as the headline, the call-to-action button copy, and the progressive form expansion trigger. Regularly performing A/B testing on different elements helps optimize landing page performance over time. The modular bento grid makes it straightforward to swap tiles, reorder sections, or test new chapter previews without restructuring the entire page
- Using measurable metrics, such as "4,217 responses collected," enhances credibility. Social proof elements like executive participation quotes and recognizable company-size breakdowns build trust with a skeptical audience. Trust badges addressing privacy concerns can further alleviate fears for users who are cautious about submitting their work email
Theme
Dashboard Pro
Creative direction
Problem→Solution Arc
Color system
Acid Digital
Style
Bento Grid
Direction
Lead Generation
Page Sections
Animated Isometric Dashboard Header
Blur-gated Bento Report Preview
Progressive Two-step Lead Capture Form
Scroll-triggered Sticky Call to Action Bar
Credibility and Response Metrics Strip
Problem Arc Tension Tiles
Related questions
Who is this template designed for?
Can I use this template for a compensation benchmark report?
How does the two-step lead generation form work?
Does the template include the animated dashboard header?
Can this template support multiple types of benchmark reports?