AI Fleet Management Landing Page Template
Dispatch is an AI-powered transportation management landing page template built for fleet operators and logistics leaders. It combines a live-metrics header, a before-and-after comparison table, and an ROI calculator form into one persuasive, data-command layout. The dark iridescent design signals operational intelligence from the first scroll.
by Rocket studio
Quick summary
Dispatch is a single-page, lead generation template designed for AI-powered transportation management systems. It opens with a real-time stats dashboard, walks prospects through a sharp problem-to-solution arc, and closes with a personalized ROI calculator. Every section is built to convert mid-market fleet operators and supply chain leaders into qualified demo requests.
Who this template is for
This template is built for logistics technology companies that sell AI-driven fleet and freight software to mid-market operators. If your buyers make decisions based on hard numbers, this layout speaks their language.
- Mid-market fleet operators running 200 to 2,000 trucks who want to cut manual load matching
- VP-level supply chain leaders at third-party logistics providers losing margin to deadhead miles
- Operations managers still reconciling carrier invoices manually who need a faster, smarter alternative
What problem this template solves
Most transportation management software pages bury their value under generic feature lists. Prospects arrive skeptical, skim past vague claims, and leave without acting. This template solves that by making the cost of inaction impossible to ignore.
- Manual load matching, carrier rate opacity, and invoice disputes are named and visualized as real loss events
- The comparison table shows exact before-and-after numbers so buyers calculate their own exposure
- The ROI calculator form converts visitors into leads by returning a personalized savings projection instantly
What you get with this template
You get a fully structured, single-page layout that follows a tight problem-to-solution narrative arc. Every section earns the next click and moves the prospect closer to a demo or savings estimate.
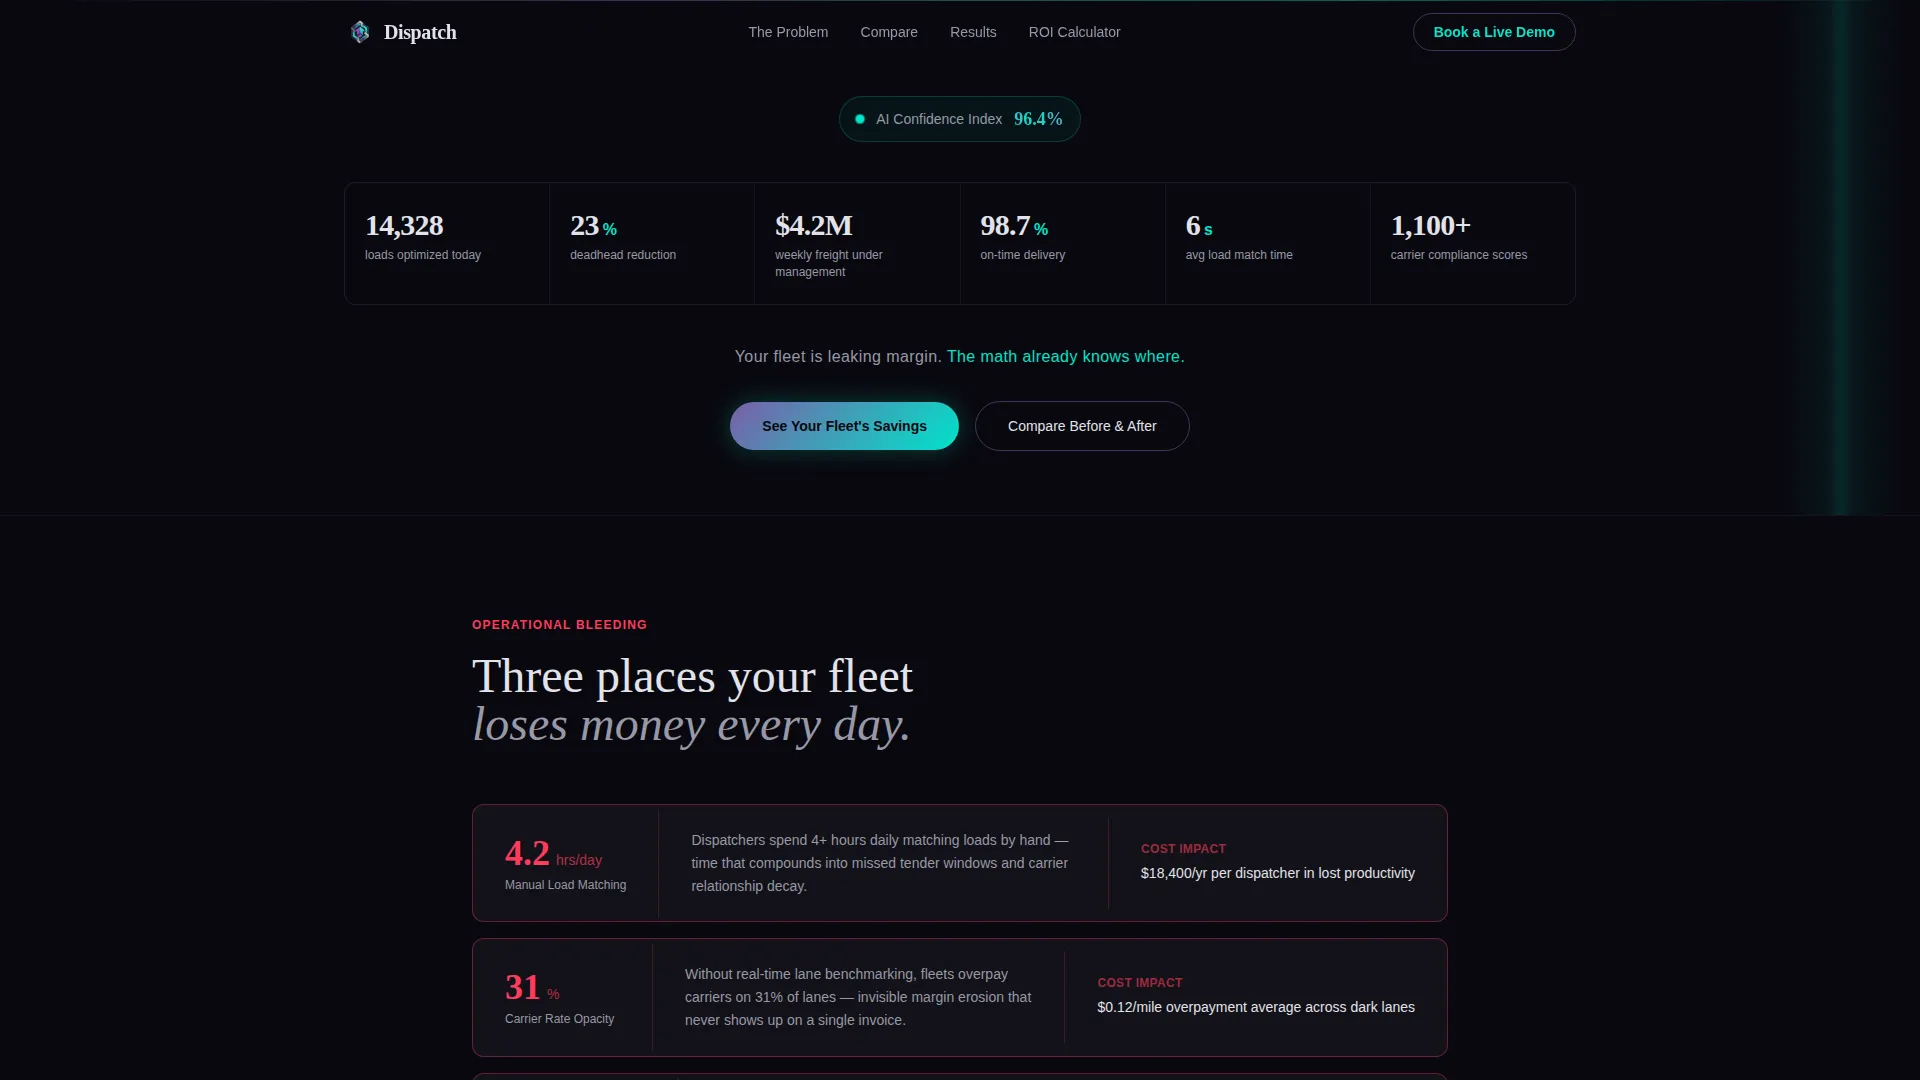
- A full-width live stats header displaying seven operational metrics with pulsing iridescent visual treatment
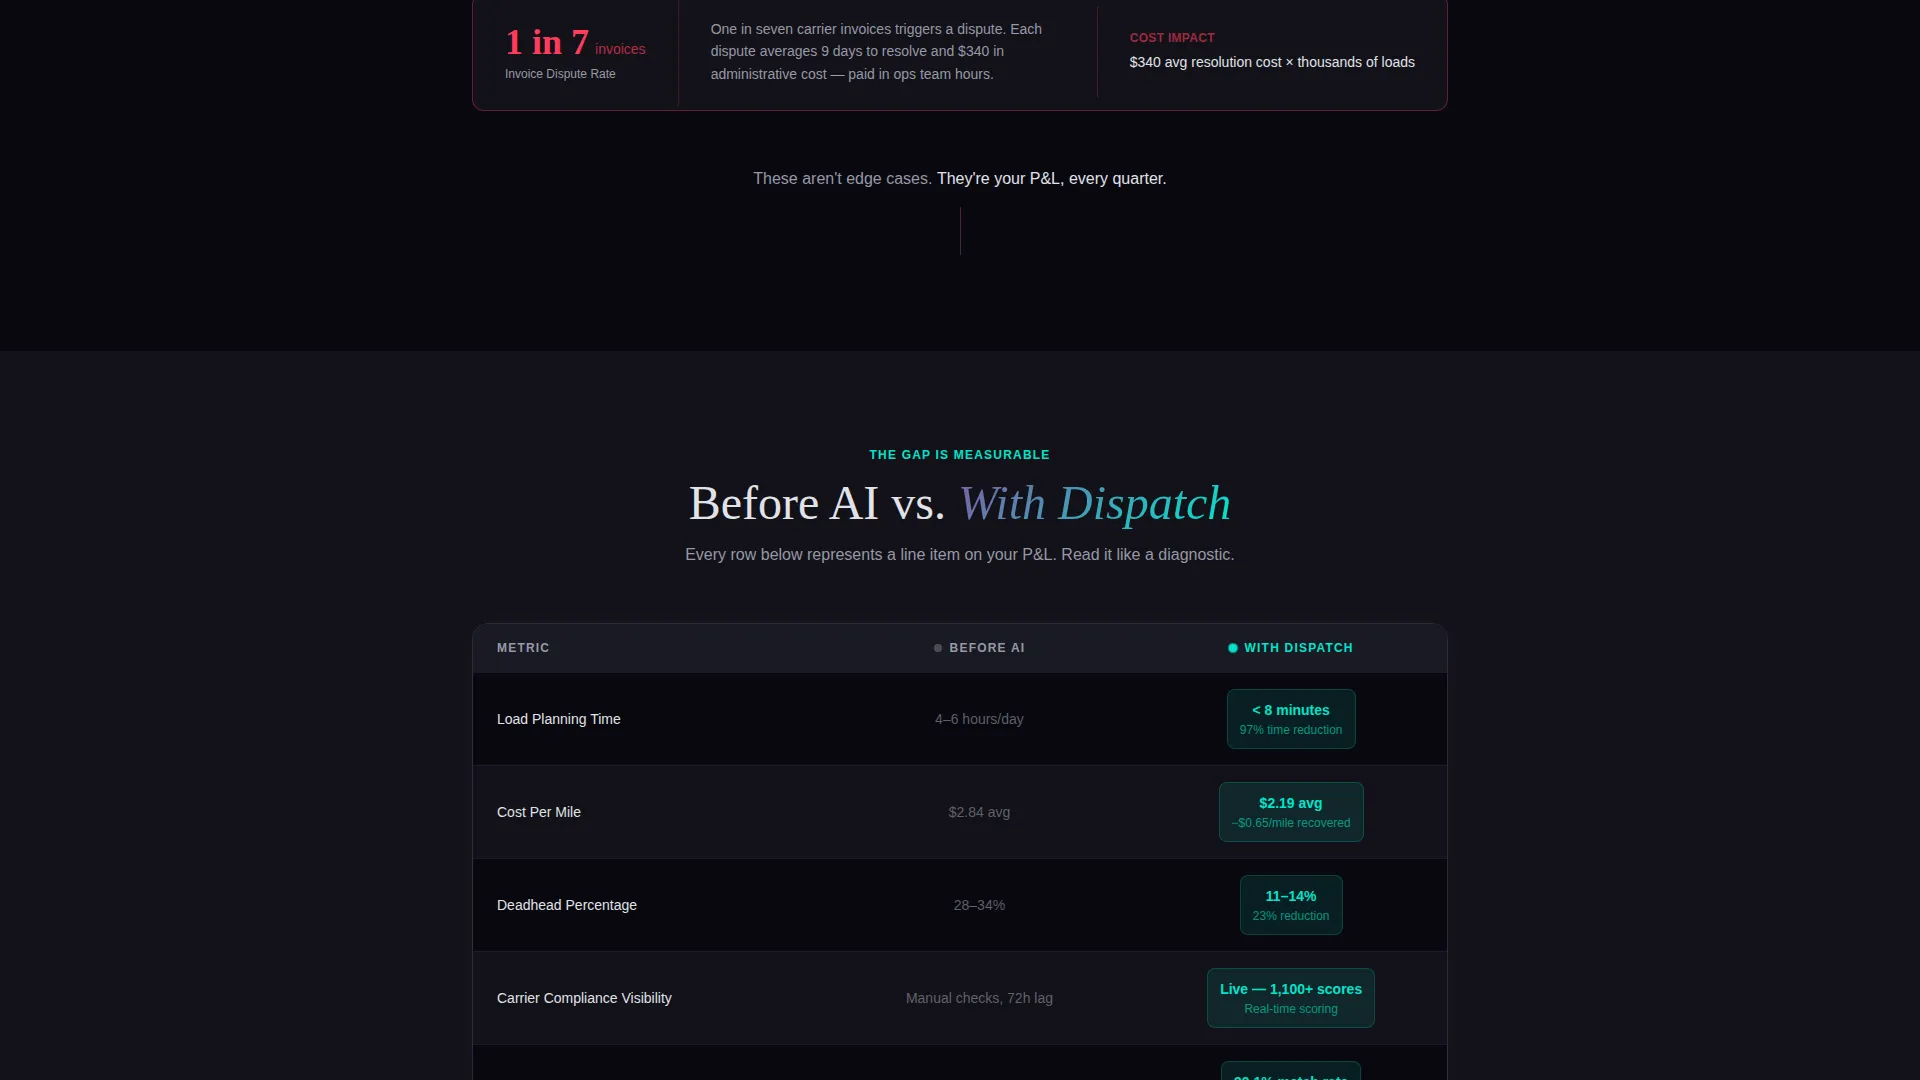
- A before-and-after comparison table with muted gray "Before AI" cells and electric cyan "With Dispatch" cells
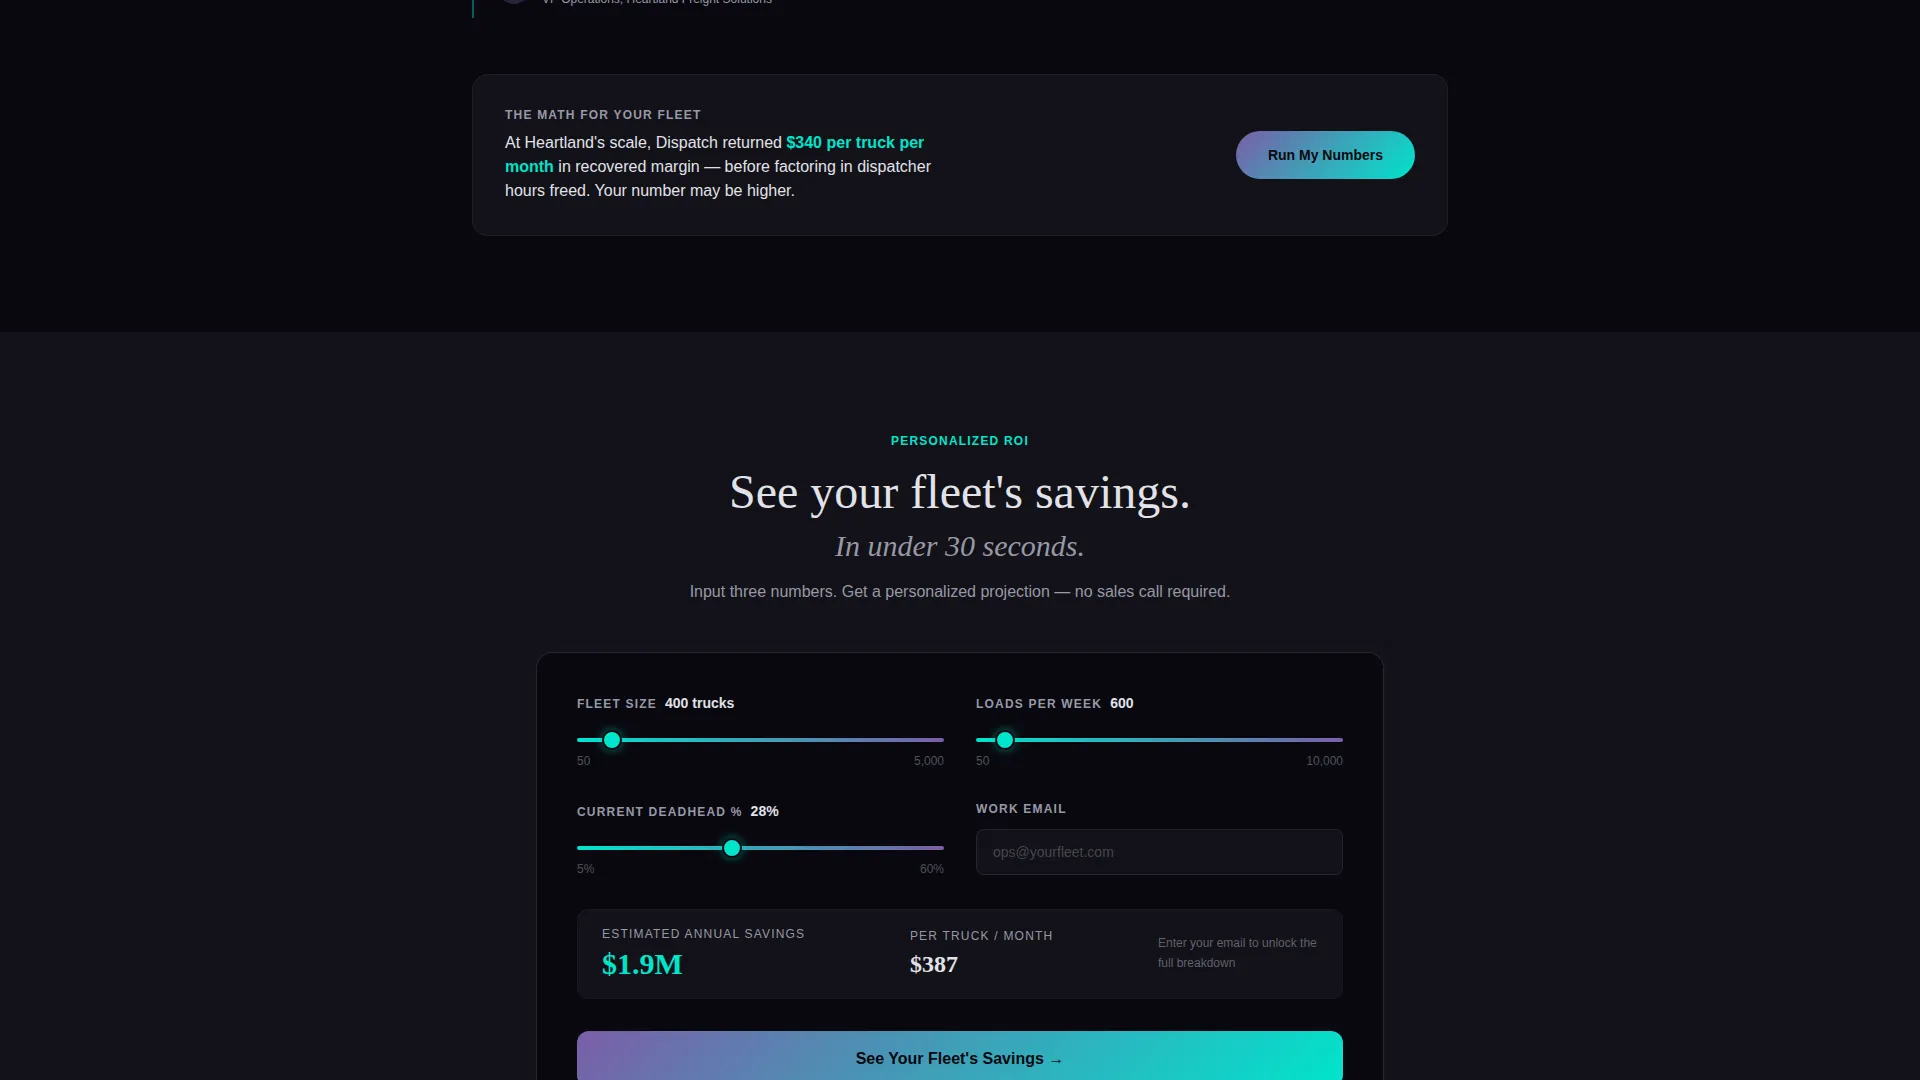
- A compact ROI calculator form with fleet size slider, loads per week input, deadhead percentage estimate, and work email field
Feature list
This template ships with purpose-built sections and visual components derived directly from the brief. Each one is designed to hold a specific role in the conversion arc.
Live Metrics Dashboard Header
The header displays seven real operational numbers in a full-width dark panel. Figures like load match time, deadhead reduction, and on-time delivery rate are rendered in oversized platinum text with cyan unit labels. A slow iridescent glow sweeps left to right, making the data feel live and credible.
Problem Visualization Band
Three operational pain points sit below the header, each shown as a red-flagged metric row. Manual load matching, carrier rate opacity, and invoice disputes are named directly. This section creates the emotional case before the data case begins.
Before and After Comparison Table
The comparison table occupies the middle third of the page. Columns are labeled "Before AI" and "With Dispatch." Rows cover load planning time, cost per mile, deadhead percentage, carrier compliance visibility, and invoice accuracy. Every improved metric pulses in electric cyan, making the gap between old and new methods tangible.
Case Study Band
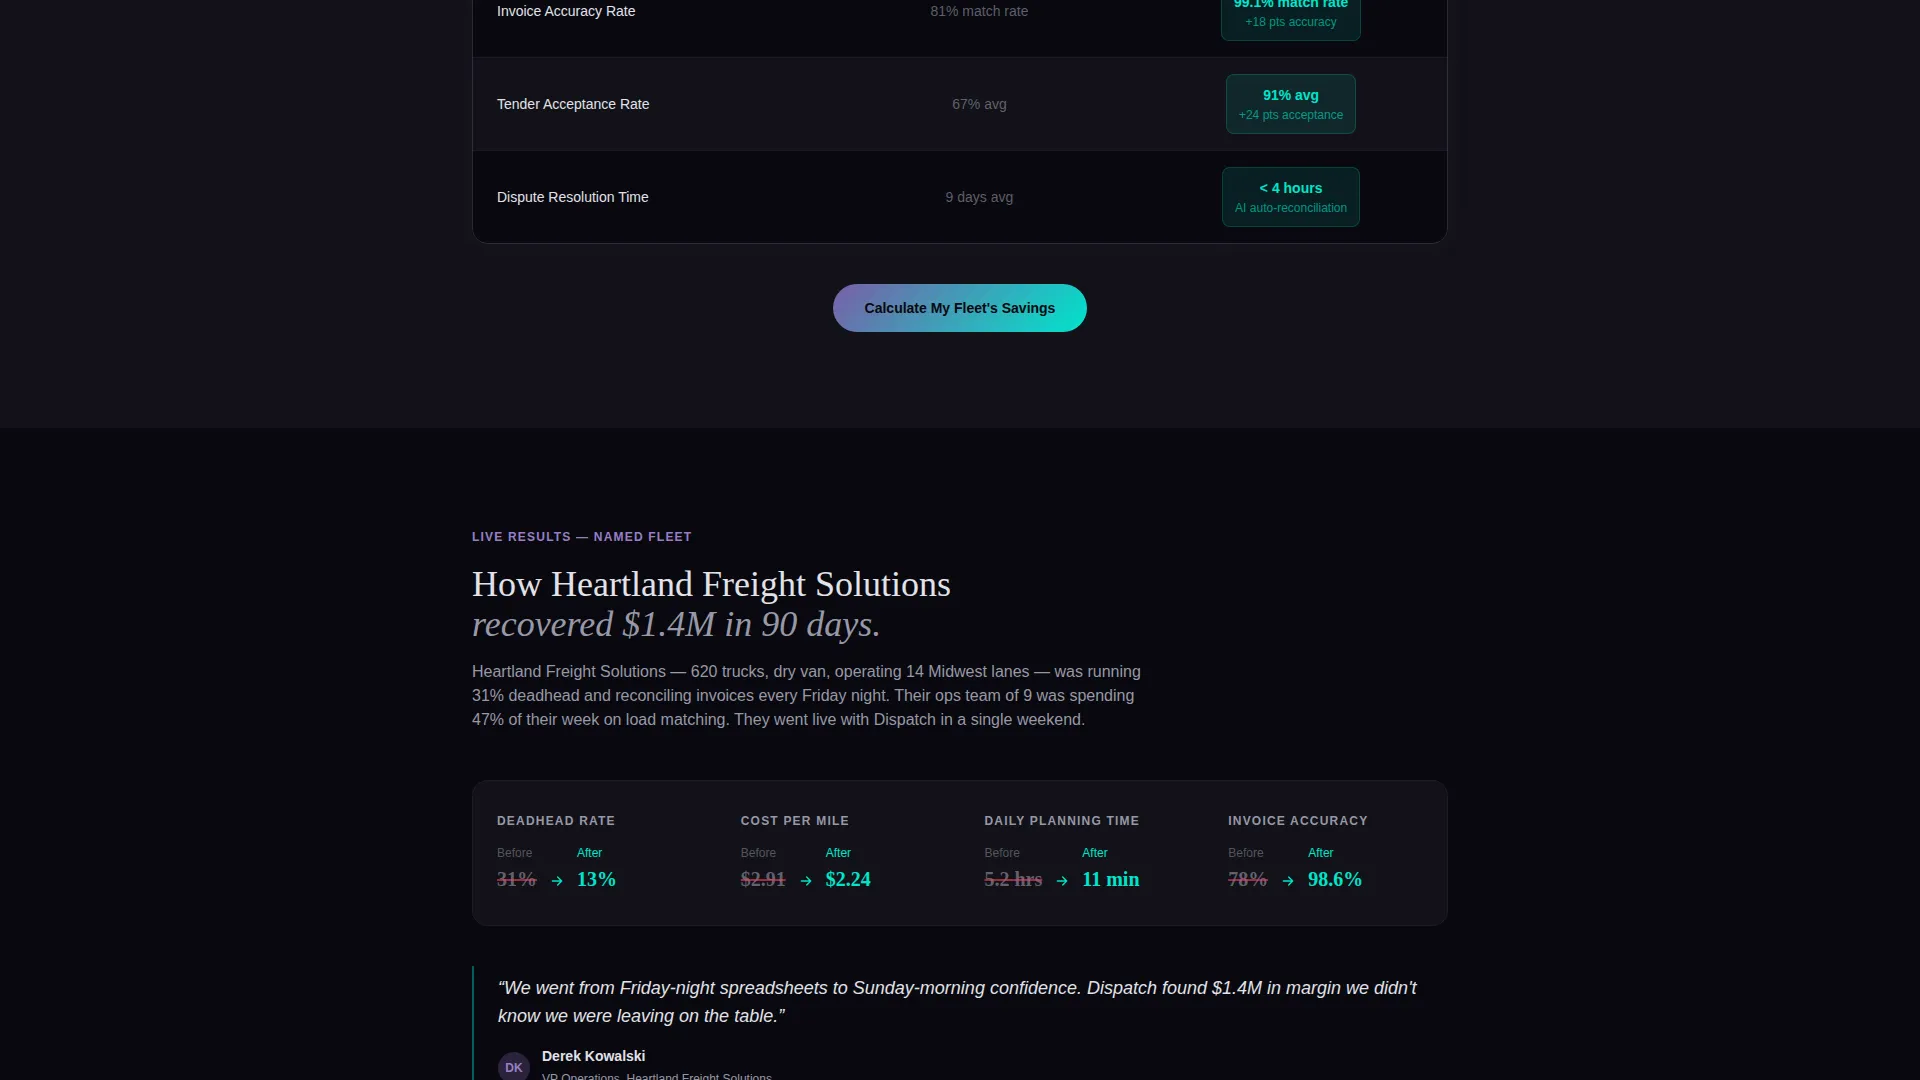
A short case study section features one named mid-market fleet with before-and-after numbers. It anchors the comparison table claims in a real operational context and reinforces trust before the final conversion section.
ROI Calculator Form
The closing section contains a compact lead capture form. Visitors adjust a fleet size slider from 50 to 5,000 trucks, enter average weekly loads and current deadhead percentage, and provide a work email. On submission, the page returns a personalized savings projection, delivering value while capturing the lead.
Sticky Secondary Call to Action
A persistent "Book a Live Demo" button lives in the navigation bar throughout the entire scroll. It catches high-intent visitors who prefer human contact over the self-serve calculator flow.
Page sections overview
| Section | Purpose |
|---|---|
| Stats metrics header | Opens with seven live operational numbers to establish immediate data credibility |
| Pain point band | Names three specific loss events to frame the cost of the status quo |
| Comparison table | Shows before-and-after metrics across five operational dimensions |
| Case study band | Grounds the data claims in a named fleet's real before-and-after results |
| ROI calculator form | Captures leads by returning a personalized savings projection on submission |
| Sticky nav call to action | Keeps a "Book a Live Demo" option visible throughout the full scroll |
Design & branding system
The visual identity follows a Data Command theme using an AI Iridescent color system. The palette feels like a semiconductor under magnification: a deep matte substrate shot through with prismatic light that shifts as you scroll.
- Core colors are void black (#09090F) for backgrounds, holographic violet (#7B5EA7) for AI-driven highlights, electric cyan (#00E5CC) for live-data accents, and soft platinum (#E2E2EA) for body text and table dividers
- Table rows alternate between void black and a near-invisible charcoal (#121218) so the eye tracks horizontally without fatigue
- Interactive elements use subtle violet-to-cyan gradients; no stock photography or illustration appears anywhere on the page
Mobile & speed optimization
The layout is built to remain readable and functional on smaller screens without sacrificing the command-center feel. Heavy visual elements are structured to scale down cleanly.
- The oversized metrics header and comparison table reflow for vertical scrolling on mobile viewports
- The ROI calculator form uses a slider and minimal input fields, keeping the mobile interaction simple and low-friction
- Dark backgrounds and minimal image use keep the visual weight lean across all device sizes
How this template helps you convert
The page is engineered around a single conversion goal: turn a skeptical fleet operator into a qualified lead. Every design and copy decision supports that outcome.
- The stats header opens with numbers so specific they feel audited, building instant trust before a single feature is mentioned
- The comparison table makes the financial gap between old methods and AI-assisted operations quantifiable, so the prospect closes the deal with themselves
- The ROI calculator converts passive interest into an active data exchange, giving visitors a personalized reason to submit their work email
Other information about this template
This template is categorized under Technology, specifically within the AI-powered enterprise software space and the AI-powered transportation management system niche. It is designed as a standalone landing page, not a multi-page site.
- The template style is a comparison table layout paired with a problem-to-solution creative arc
- The header concept is a stats and metrics dashboard, and the lead generation direction is built around the ROI calculator form
- The color system is labeled AI Iridescent and the theme is Data Command, making it well-suited for enterprise software brands that want to signal analytical authority
Theme
Data Command
Creative direction
Problem→Solution Arc
Color system
AI Iridescent
Style
Comparison Table
Direction
Lead Generation
Page Sections
Live Metrics Dashboard Header
Problem Visualization Band
Before and After Comparison Table
Named Fleet Case Study Band
ROI Calculator Lead Form
Sticky Demo Booking Call to Action
Related questions
Who is this landing page template designed for?
Can I customize the comparison table rows and metrics?
How does the ROI calculator form work in this template?
Does this template include actual AI or live calculation logic?
Is this template focused on a single product offer?



