Last-Mile Delivery Landing Page Template
Dispatch is a hub-and-spoke anchor-nav landing page template built for last-mile delivery services. It leads with animated performance data, a city-grid header visualization, and a Stats-First layout that guides logistics decision-makers from headline metrics to a gated benchmark report download. The dark Navy Authority palette and data-command design make every number feel urgent and credible.
by Rocket studio
Quick summary
Dispatch is a single-page, anchor-nav landing page template designed for last-mile delivery operations. It opens with an animated infographic header, then flows through four spoke sections tied to Speed, Accuracy, Coverage, and Cost. Every section leads with an oversized metric before unpacking methodology and benchmarks. The primary conversion goal is a gated benchmark report download.
Who this template is for
This template is built for businesses that move parcels and need to prove their performance to potential clients. It speaks directly to operations-focused buyers who evaluate vendors on data, not promises.
- E-commerce operations managers dealing with high rates of failed first-attempt deliveries
- Logistics directors at regional retailers tracking customer satisfaction tied to delivery outcomes
- Fulfillment leads at direct-to-consumer brands who treat the last mile as a loyalty driver
What problem this template solves
Last-mile delivery services often lose deals because their marketing pages feel generic. Potential clients want proof, not pitch decks. This template solves the credibility gap by letting data lead every section.
- Visitors arrive skeptical and leave with benchmarks that justify a conversation
- Failed-delivery costs are invisible until quantified; the embedded ROI calculator makes the financial case visible
- Most delivery service pages bury their best numbers; this template puts them front and center from the first viewport
What you get with this template
You get a complete, ready-to-customize landing page that functions as both a marketing asset and a lead-generation tool. The layout is structured to build trust progressively before asking for anything in return.
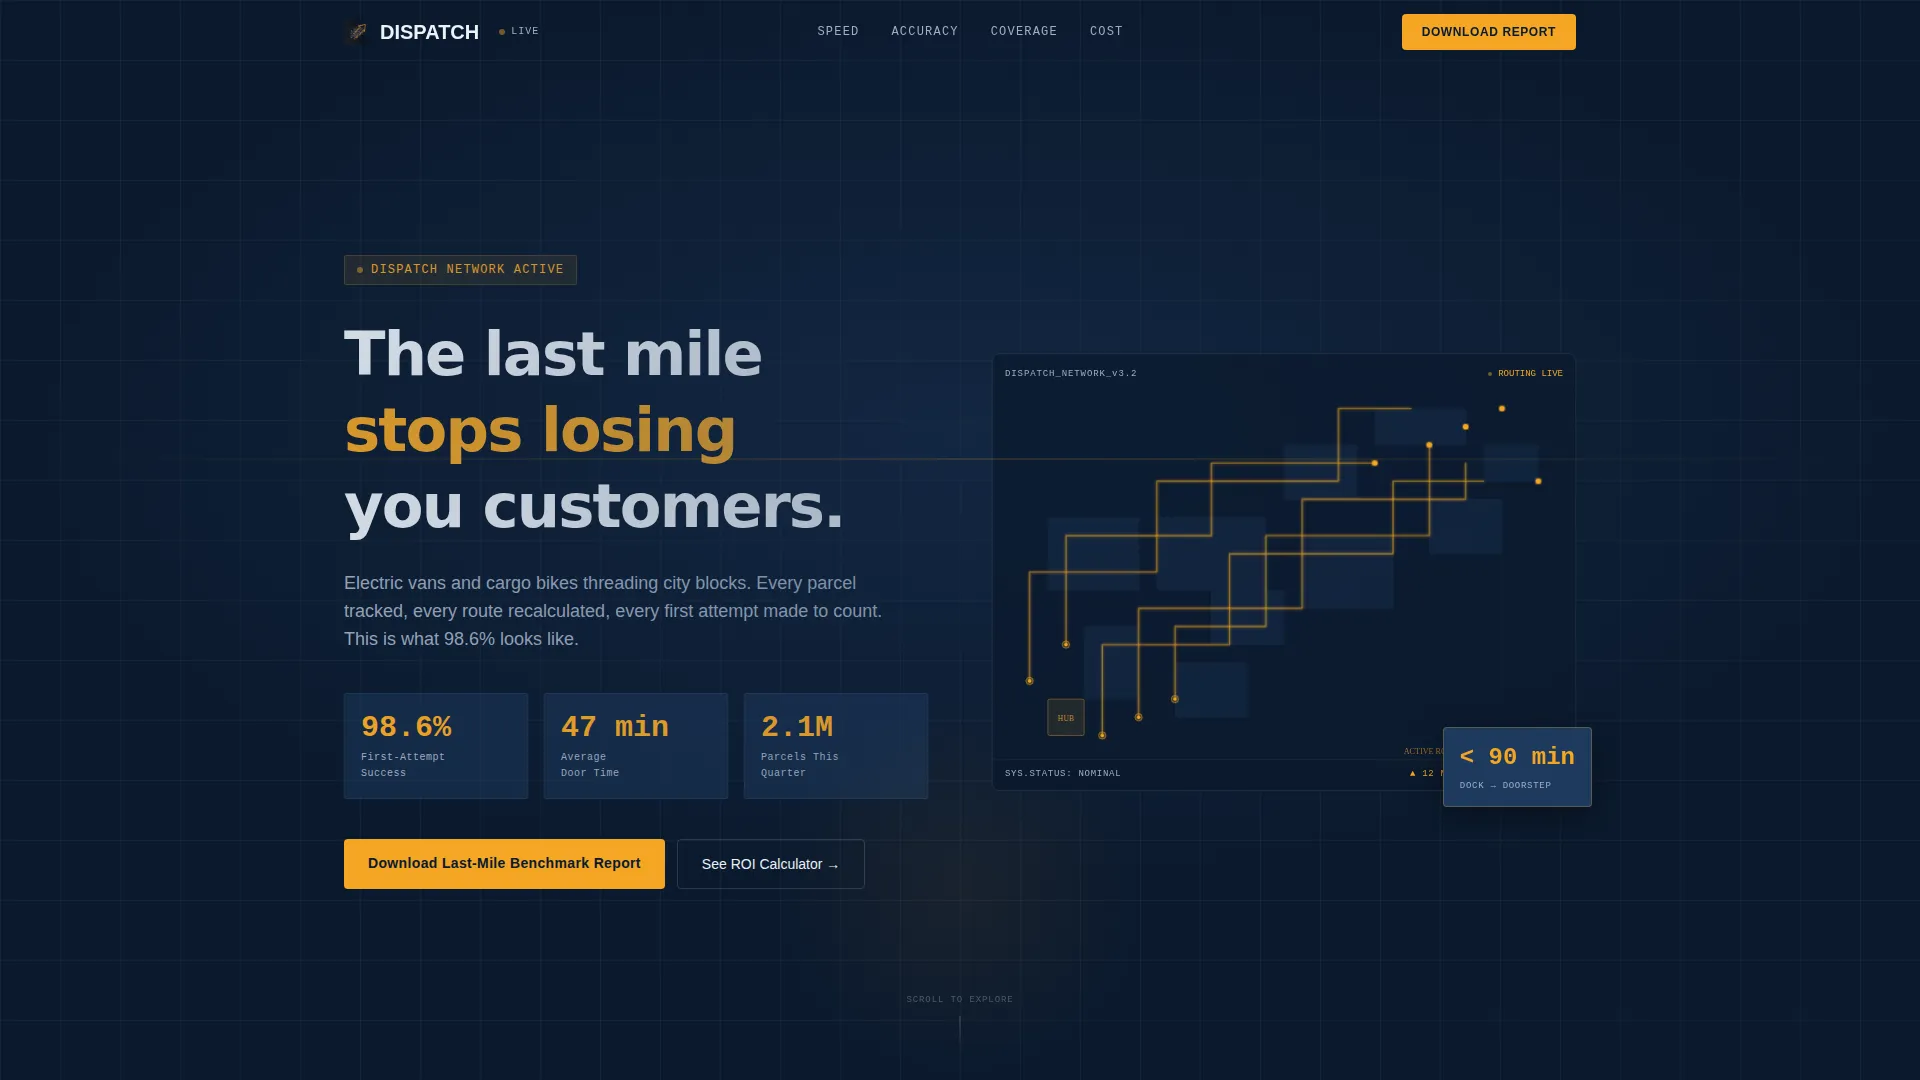
- Animated infographic header showing a live city-grid delivery visualization with key stats that count up from zero on load
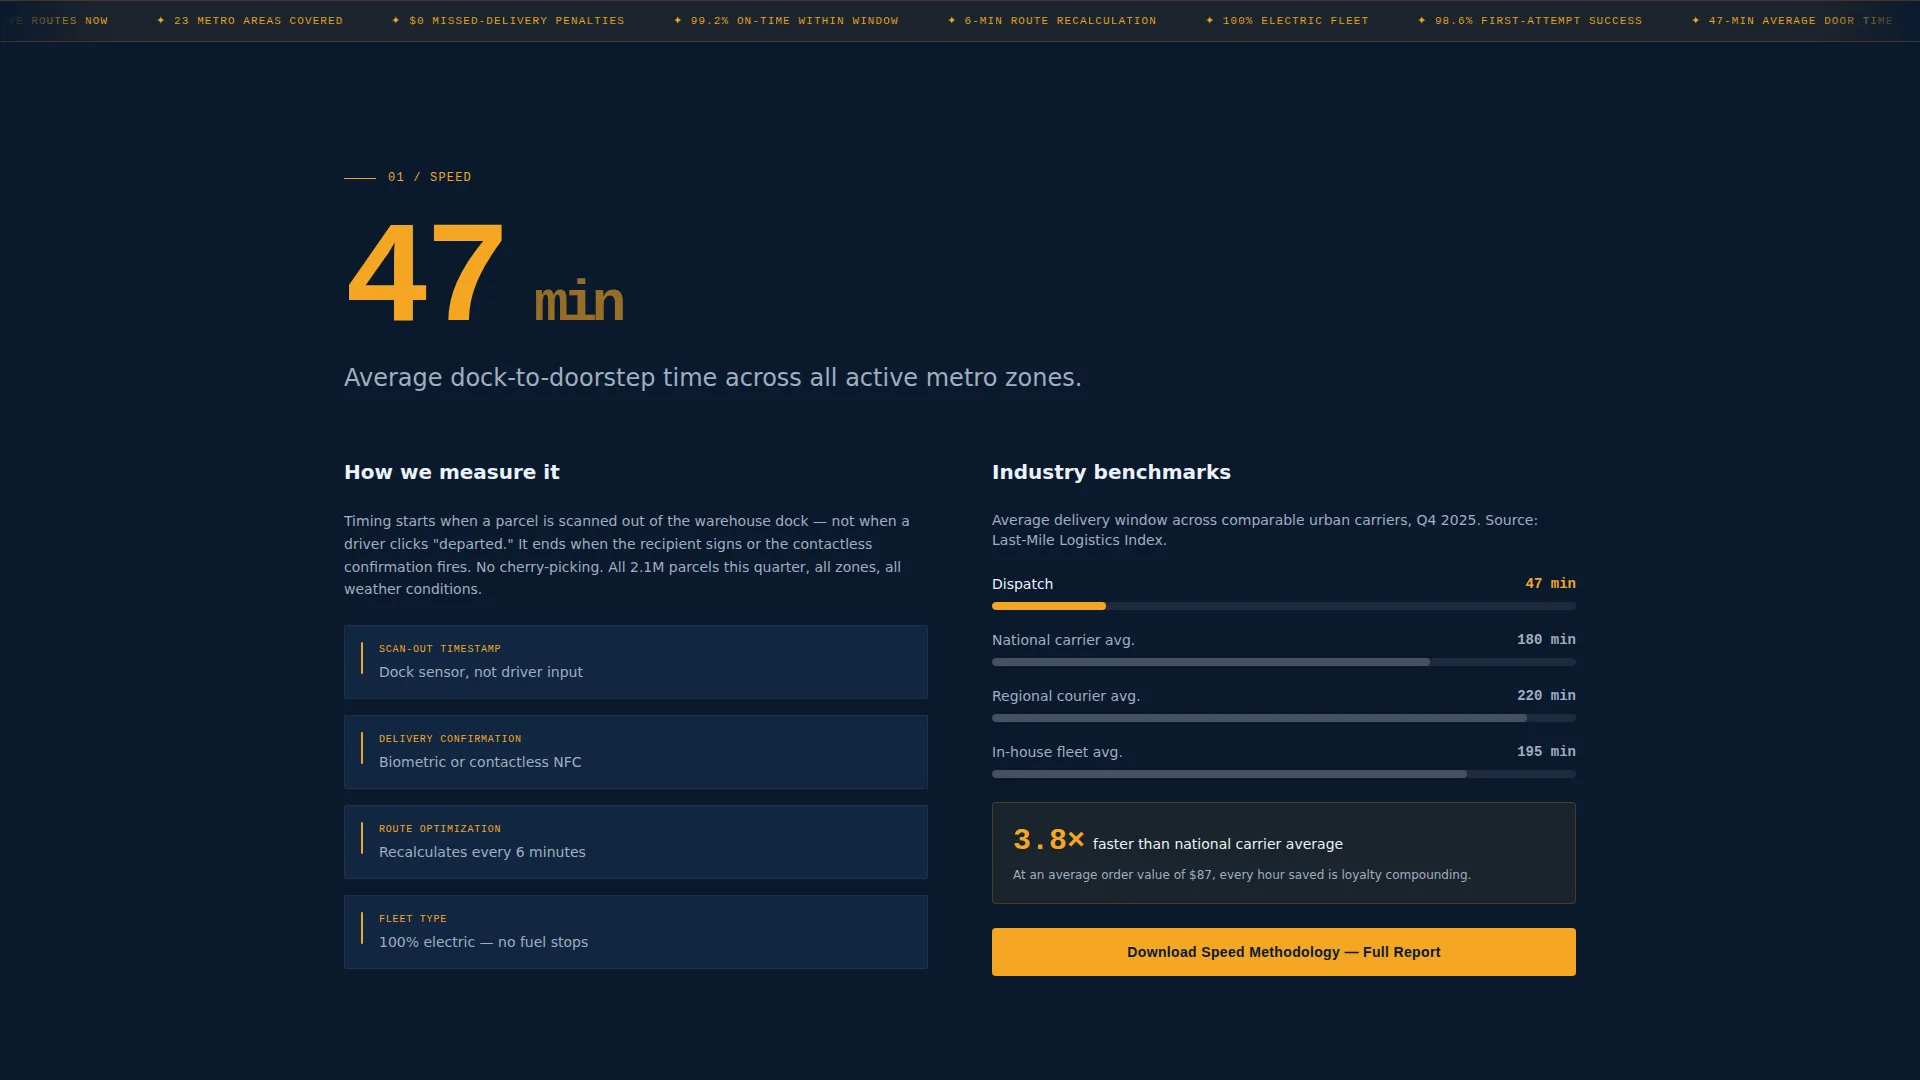
- Four anchor-nav spoke sections, each opening with a single oversized metric followed by methodology notes and industry comparison benchmarks
- A dual conversion path: a gated benchmark report download form and an embedded ROI calculator, both using the same email capture
Feature list
The template delivers a focused set of components, each chosen to serve the data-first narrative of a high-performance last-mile operation.
Animated Infographic Header
The full-viewport header renders a stylized city grid where delivery routes draw themselves in real time. Parcels pulse at origin points and completion percentages climb visually. Three headline stats are typeset large and staggered across the composition, animating from zero on load to give every visitor an immediate sense of operational scale.
Hub-and-Spoke Anchor Navigation
A sticky navigation bar pins to the top of the page with four labeled anchors: Speed, Accuracy, Coverage, and Cost. Each anchor scrolls directly to its spoke section. This structure lets visitors jump to the metric category most relevant to their pain point without losing context from the hub.
Stats-First Spoke Sections
Each of the four spoke sections opens with one oversized, attention-commanding metric. The stat is followed by a brief methodology explanation and a comparison benchmark against published industry averages. This pattern repeats consistently, so visitors always know what to expect and how to interpret the numbers.
Gated Benchmark Report Form
At the hub center and at the close of each spoke section, a "Download the Last-Mile Benchmark Report" call-to-action appears. The form captures company email address, monthly parcel volume via a tiered dropdown (under 5,000 / 5,000 to 50,000 / 50,000 and above), and current delivery partner name. The short form reduces friction while still providing useful segmentation data.
Embedded ROI Calculator
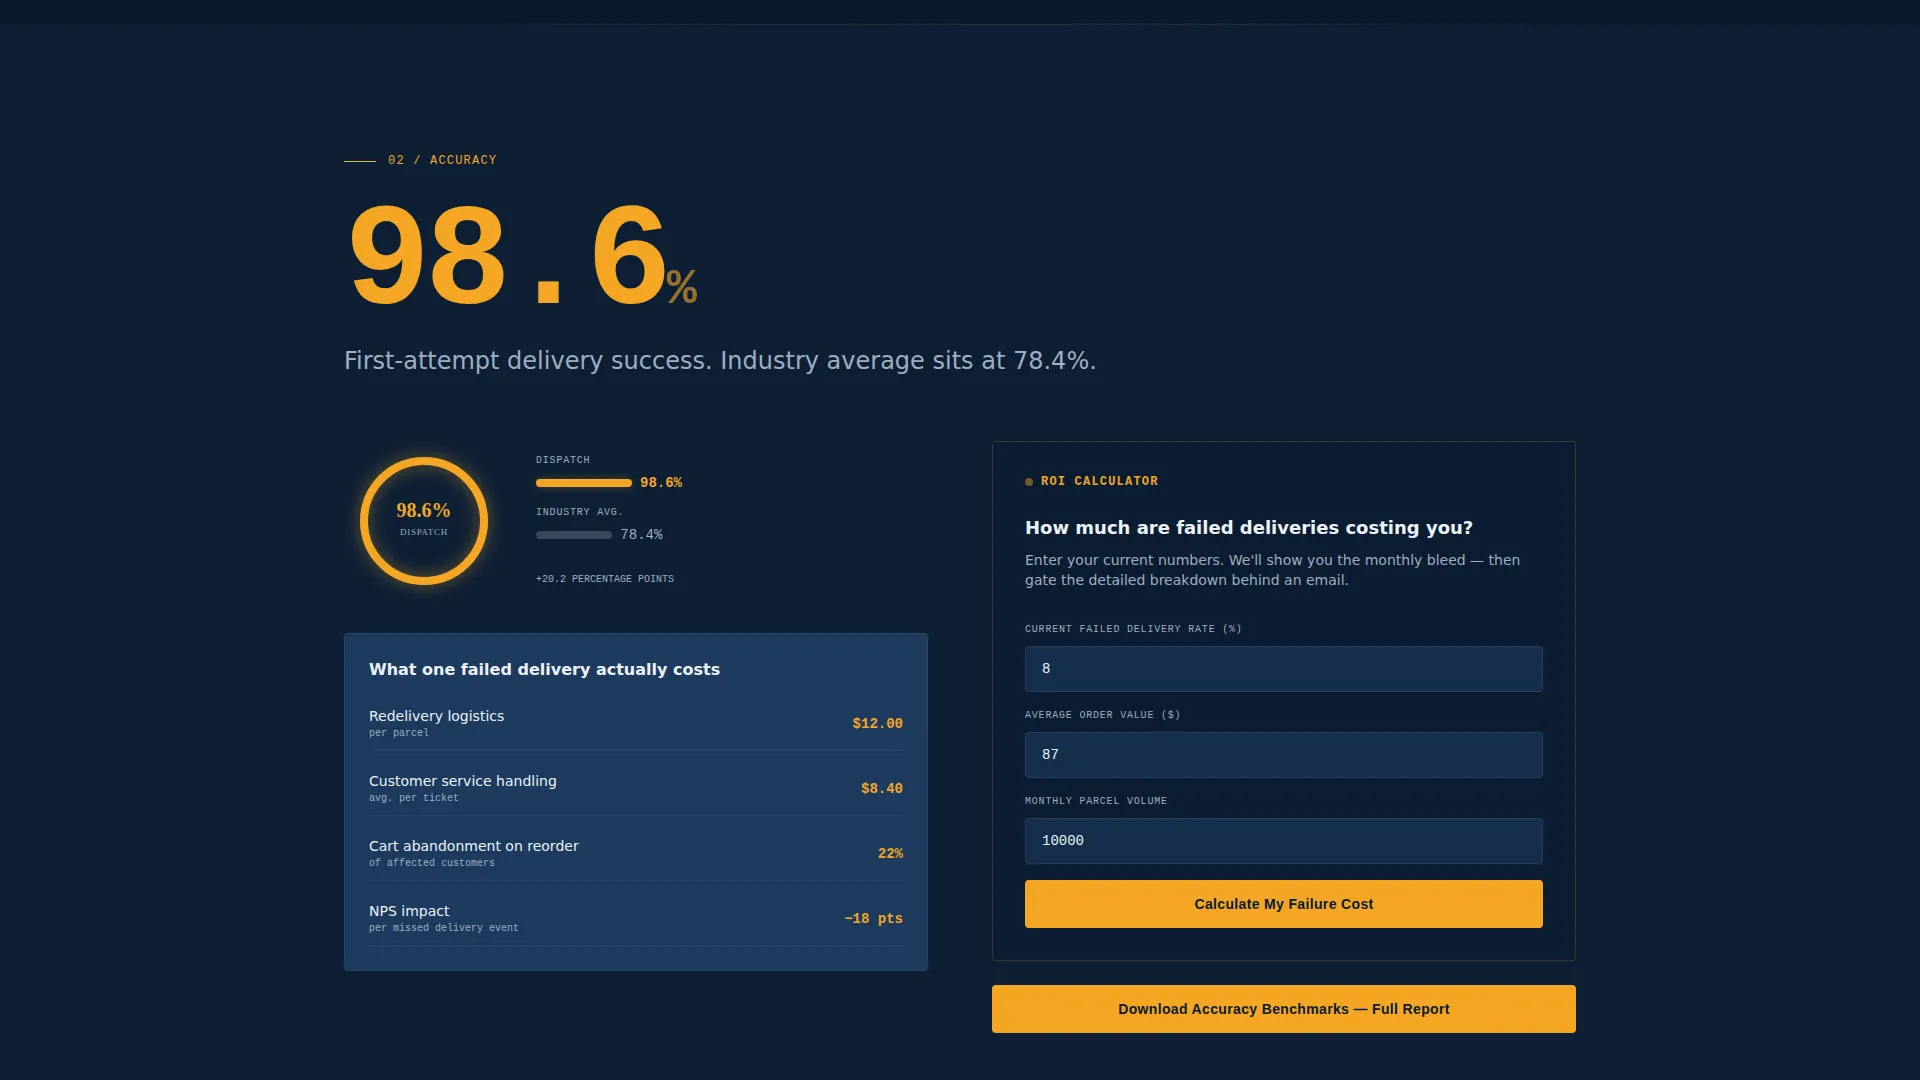
A secondary conversion path lets visitors input their failed-delivery rate and average order value. The calculator returns a projected savings figure. Results are gated behind the same email capture as the benchmark report, giving a second entry point for visitors who prefer self-service over downloads.
Data Command Visual System
The Navy Authority color palette uses deep operations navy as the dominant background, tactical slate for card surfaces, signal white for body text and data labels, and alert amber exclusively for live metrics, calls-to-action, and hover states. The result is a dashboard-style visual language where every bright element signals importance.
Page sections overview
| Section | Purpose |
|---|---|
| Animated Header Hub | Opens with city-grid delivery visualization and three animated headline stats |
| Anchor Nav Bar | Pins to top; links to Speed, Accuracy, Coverage, and Cost spokes |
| Speed Spoke | Leads with delivery time metric; unpacks methodology and benchmark comparison |
| Accuracy Spoke | Leads with first-attempt success rate; supports benchmark and downloadable report call to action |
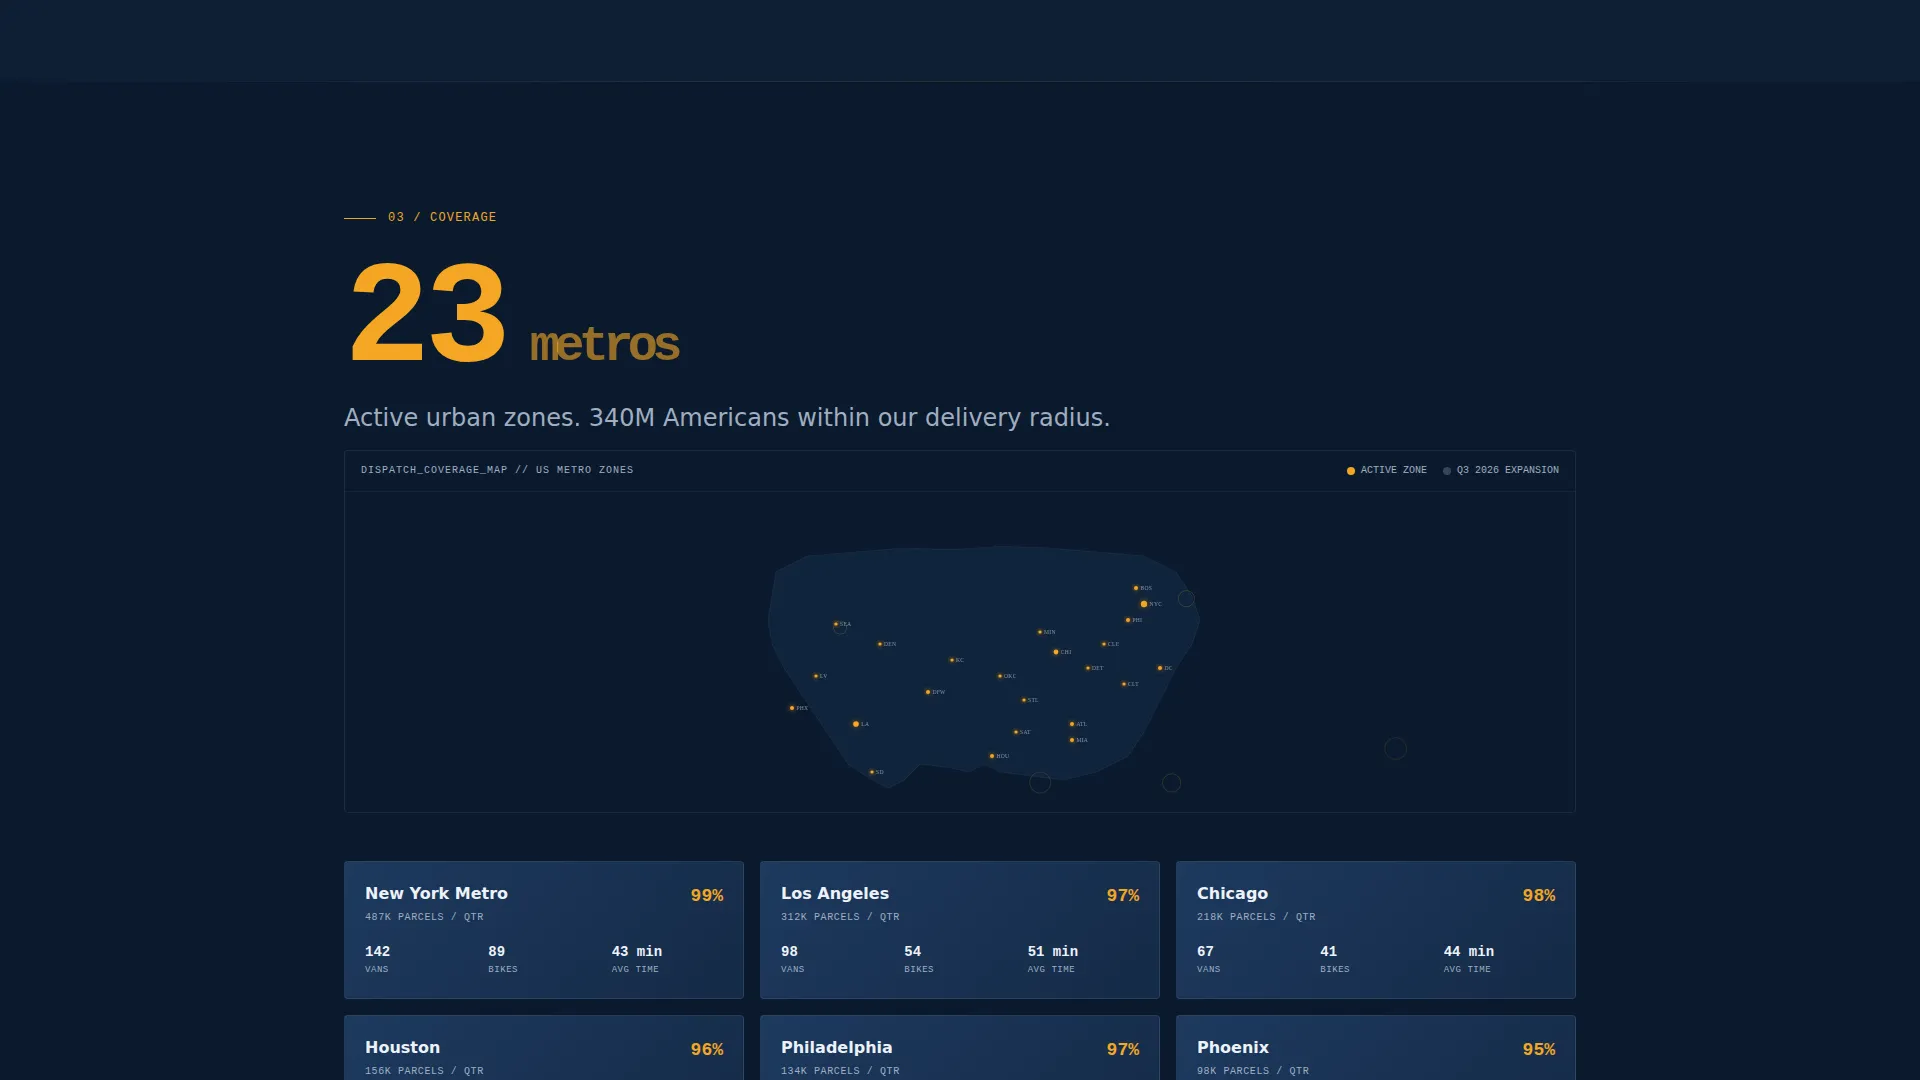
| Coverage Spoke | Presents network-wide coverage map context and supporting data |
| Cost Spoke | Builds total cost-of-failure argument with industry cost comparisons |
| ROI Calculator | Lets visitors calculate projected savings from reduced failed deliveries |
| Report Download Form | Captures email, parcel volume tier, and current delivery partner for gated content |
Design & branding system
The visual identity follows a Data Command theme built entirely around dark, authoritative surfaces. The palette is not decorative; every color has a defined functional role within the layout.
- Deep operations navy (#0B1A2E) as the dominant page background, tactical slate (#1E3A5F) for card surfaces and section dividers, signal white (#EDF2F7) for all body text and data labels
- Alert amber (#F5A623) is reserved exclusively for live metrics, calls-to-action, and hover states, so warm color always signals an action or a key number
- No stock photography and no lifestyle imagery; the visual language is entirely data-driven, using animated routes, pulsing parcel markers, and typographic stat compositions
Mobile & speed optimization
The template is designed with a layout that supports responsive viewing across device sizes, keeping the data-heavy design legible at every breakpoint.
- Anchor navigation collapses cleanly on smaller screens so spoke sections remain easy to reach without horizontal scrolling
- Stat animations and city-grid visualizations are scoped to perform without adding excessive load weight, keeping the first contentful paint fast for mobile visitors
- Form fields and the ROI calculator inputs are sized and spaced for comfortable touch interaction on phone and tablet screens
How this template helps you convert
The entire page is engineered around a progressive trust sequence. Visitors are given valuable data before they are asked to share anything in return.
- The animated header delivers three headline performance stats on arrival, establishing credibility before a single word of pitch copy appears, so the visitor's first impression is data fluency rather than sales pressure.
- Each spoke section closes with the benchmark report call-to-action after delivering free intelligence, making the download feel like the natural next step rather than an interruption to the reading experience.
- The embedded ROI calculator offers a second conversion path for visitors who want to quantify their own situation first, capturing the same lead via self-directed engagement rather than a direct download prompt.
Other information about this template
This template is part of a broader set of logistics and supply chain landing page templates designed for high-stakes B2B service categories. A few practical notes for teams evaluating it:
- The template is categorized under Logistics and Supply Chain, specifically within the Last-Mile and Delivery subcategory, making it a focused fit for courier services, urban delivery networks, and parcel logistics operations
- The hub-and-spoke anchor-nav structure can support additional spoke sections if your service covers more performance dimensions beyond the four included by default
- The Stats-First creative direction works best when you have real, verifiable performance data to populate the stat slots; placeholder numbers should be replaced before launch
- The Content and Resource landing page direction means the primary goal is lead capture via gated content, not a direct service sign-up; teams should have a benchmark report or equivalent asset ready to gate
Theme
Data Command
Creative direction
Stats-First Impact
Color system
Navy Authority
Style
Hub & Spoke (Anchor Nav)
Direction
Content/Resource
Page Sections
Animated City-grid Infographic Header
Sticky Hub-and-spoke Anchor Nav
Stats-first Spoke Section Layout
Gated Benchmark Report Download
Embedded ROI Calculator
Navy Authority Color System
Related questions
What kind of business is this template designed for?
Do I need a finished benchmark report before using this template?
Can I change the four anchor-nav spoke sections?
How does the ROI calculator work within the template?
Is this template suitable for a team without a developer?