Nuclear Vertical SaaS Booking Website Template
Fission is a nuclear analytics dashboard landing page template built for B2B enterprise software teams. It opens with a live Fleet Performance Estimator, walks visitors through an industry-report card grid, and closes with a detailed comparison table. The dark Data Command visual system and progressive three-step form sequence are designed to convert shift supervisors and compliance analysts into booked demos.
by Rocket studio
Quick summary
Fission is a single-page landing page template for a nuclear analytics platform. It leads with an interactive Fleet Performance Estimator, builds credibility through cited industry benchmarks, showcases six feature modules in a card grid, and drives conversion with a full-width comparison table and a progressive three-step call-to-action form.
Who this template is for
This template is built for B2B software companies selling into the nuclear power industry. It speaks directly to technically minded buyers who need hard evidence before requesting a demo.
- Shift supervisors and fleet performance engineers who make real-time operational decisions
- Nuclear Regulatory Commission (NRC) compliance analysts managing event reporting under federal requirements
- Product and marketing teams launching a nuclear vertical software-as-a-service product
What problem this template solves
Nuclear operations teams work with fragmented data. Reactor telemetry, fuel-cycle records, and regulatory dosimetry often live in separate systems, forcing engineers to cross-reference manually under time pressure. This template gives a software vendor the right structure to communicate why that fragmentation is costly and how their platform solves it.
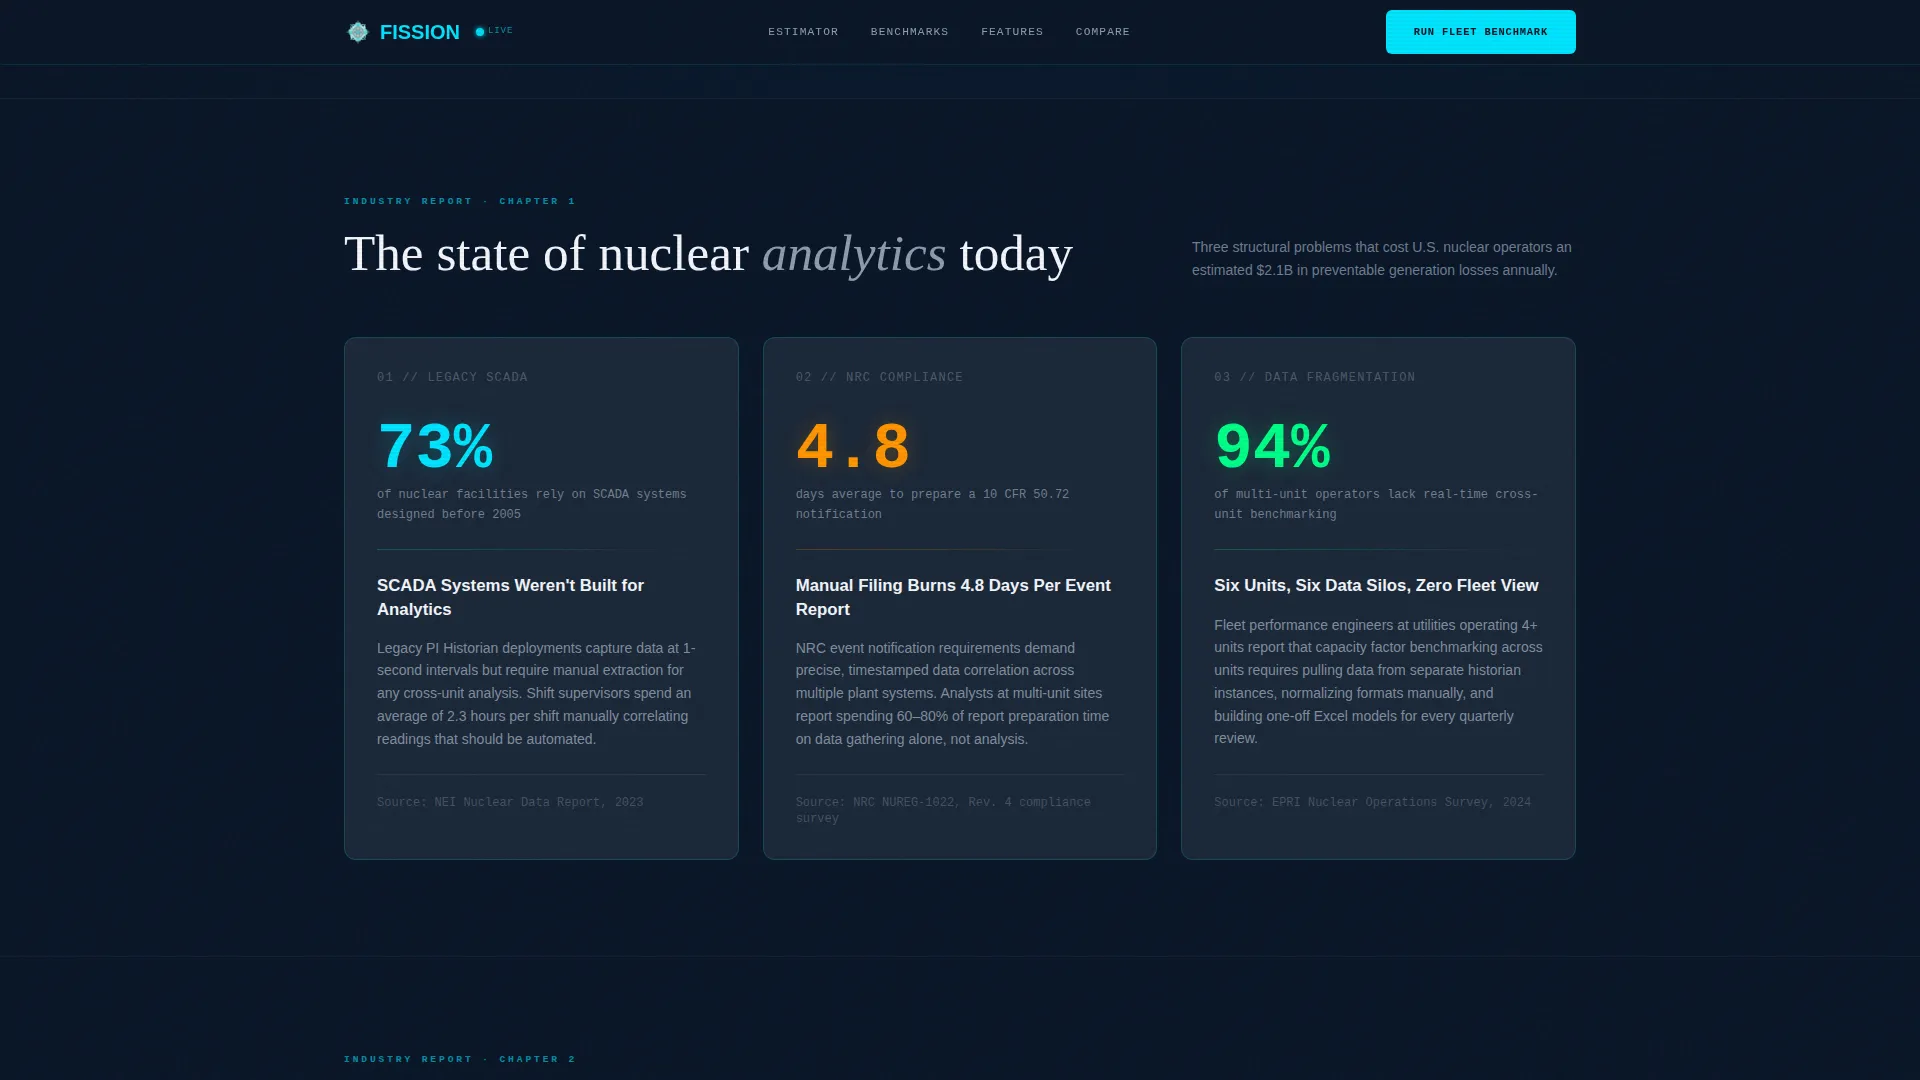
- Legacy supervisory control and data acquisition (SCADA) systems limit real-time visibility across multi-unit fleets
- Manual NRC filing processes consume days of analyst time per reporting cycle
- Fleet-wide data fragmentation prevents consistent capacity factor benchmarking across reactor units
What you get with this template
You get a fully structured, conversion-focused landing page built around an industry-report content flow. Every section earns reader attention before asking for a commitment.
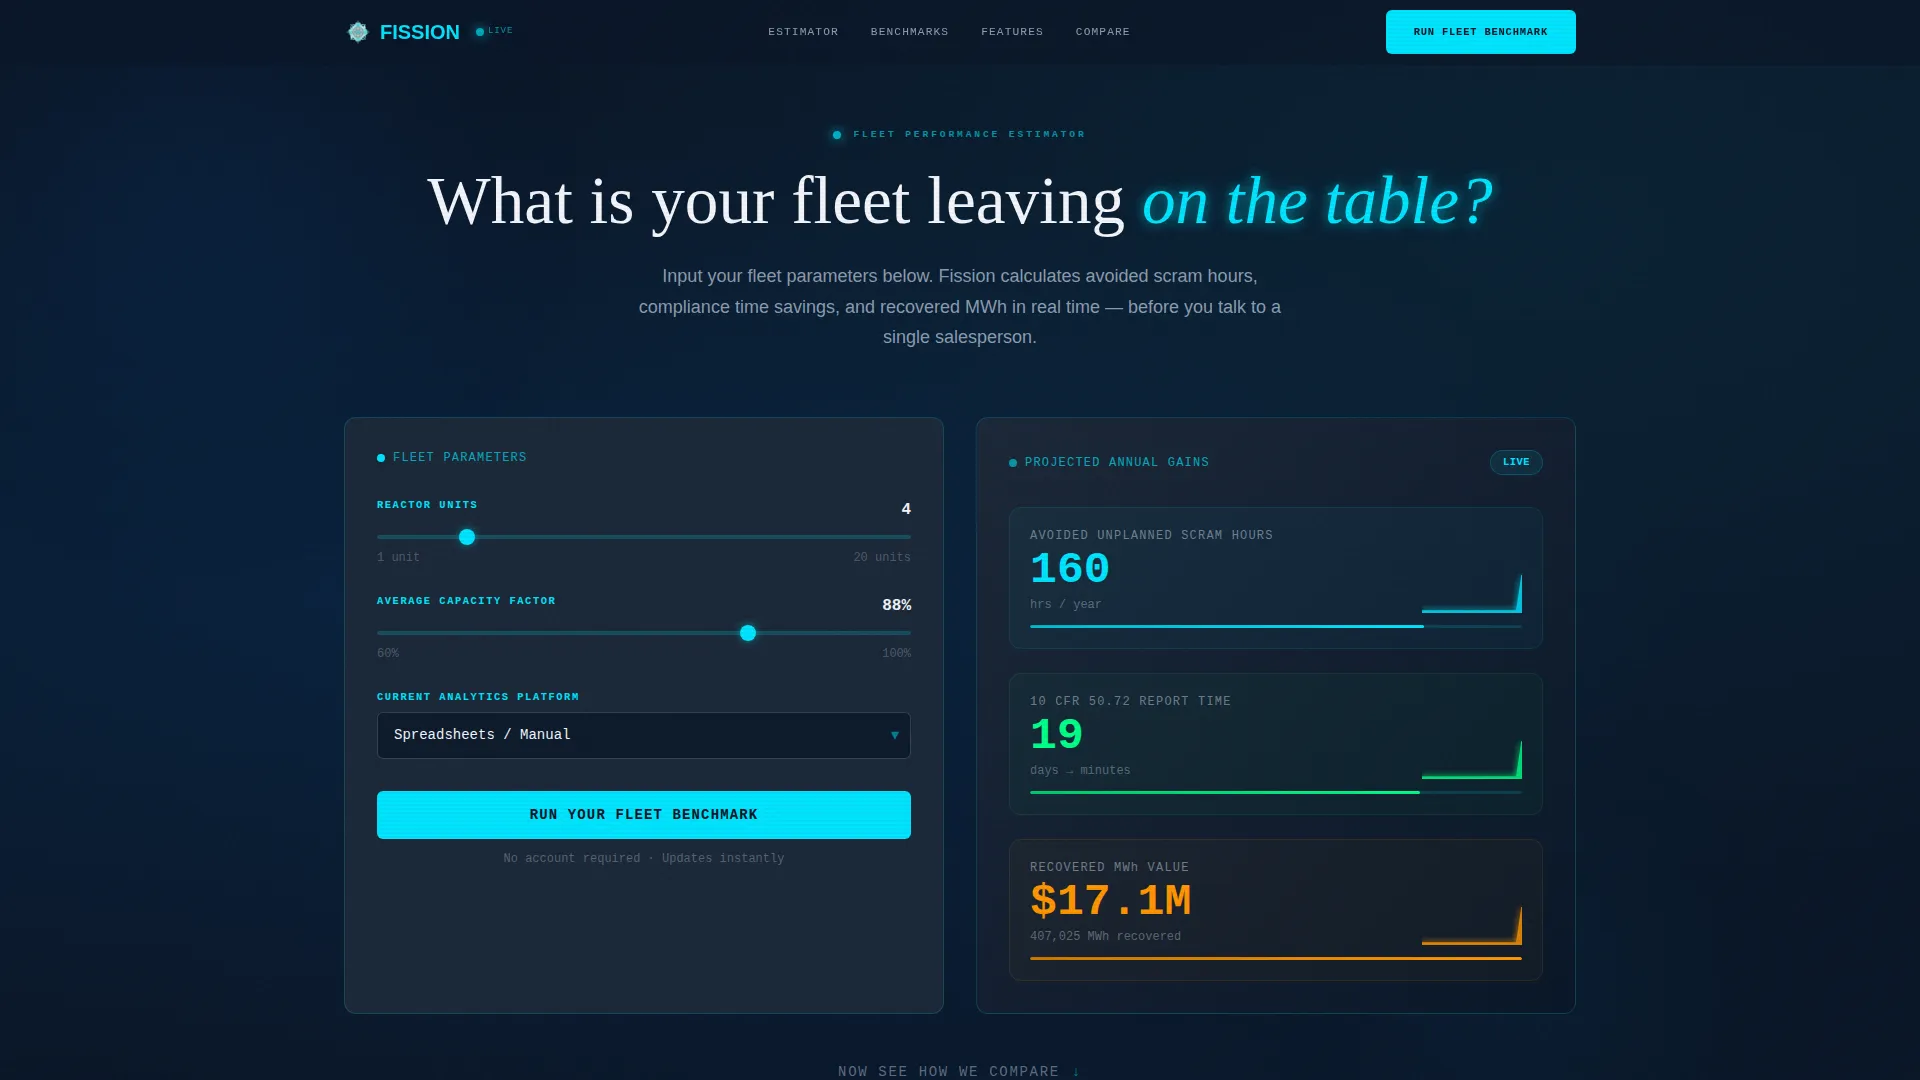
- A functional Fleet Performance Estimator in the header with split-panel layout and animated result outputs
- A six-card feature module grid, a twelve-dimension comparison table, and a three-step progressive form sequence
- A secondary conversion path that gates a PDF industry report behind email-only capture
Feature list
This template ships with six purpose-built sections, each carrying its own interactive or visual component. Together they form a complete conversion funnel for a high-trust, high-scrutiny enterprise audience.
Fleet Performance Estimator
The header houses a live calculator where visitors enter their number of reactor units, average capacity factor, and current analytics tooling. The right panel instantly renders projected gains: avoided unplanned scram hours, compliance-report time savings, and a recovered megawatt-hour dollar figure. Spark-line charts draw themselves as values populate.
Industry Benchmark Card Chapter
Three cards present the nuclear analytics market problem using cited statistics and source attributions. Each card addresses one pressure point: legacy SCADA limitations, NRC filing burden, and fleet-wide data fragmentation. The chapter sets up the product narrative before any feature is shown.
Six-Card Feature Module Grid
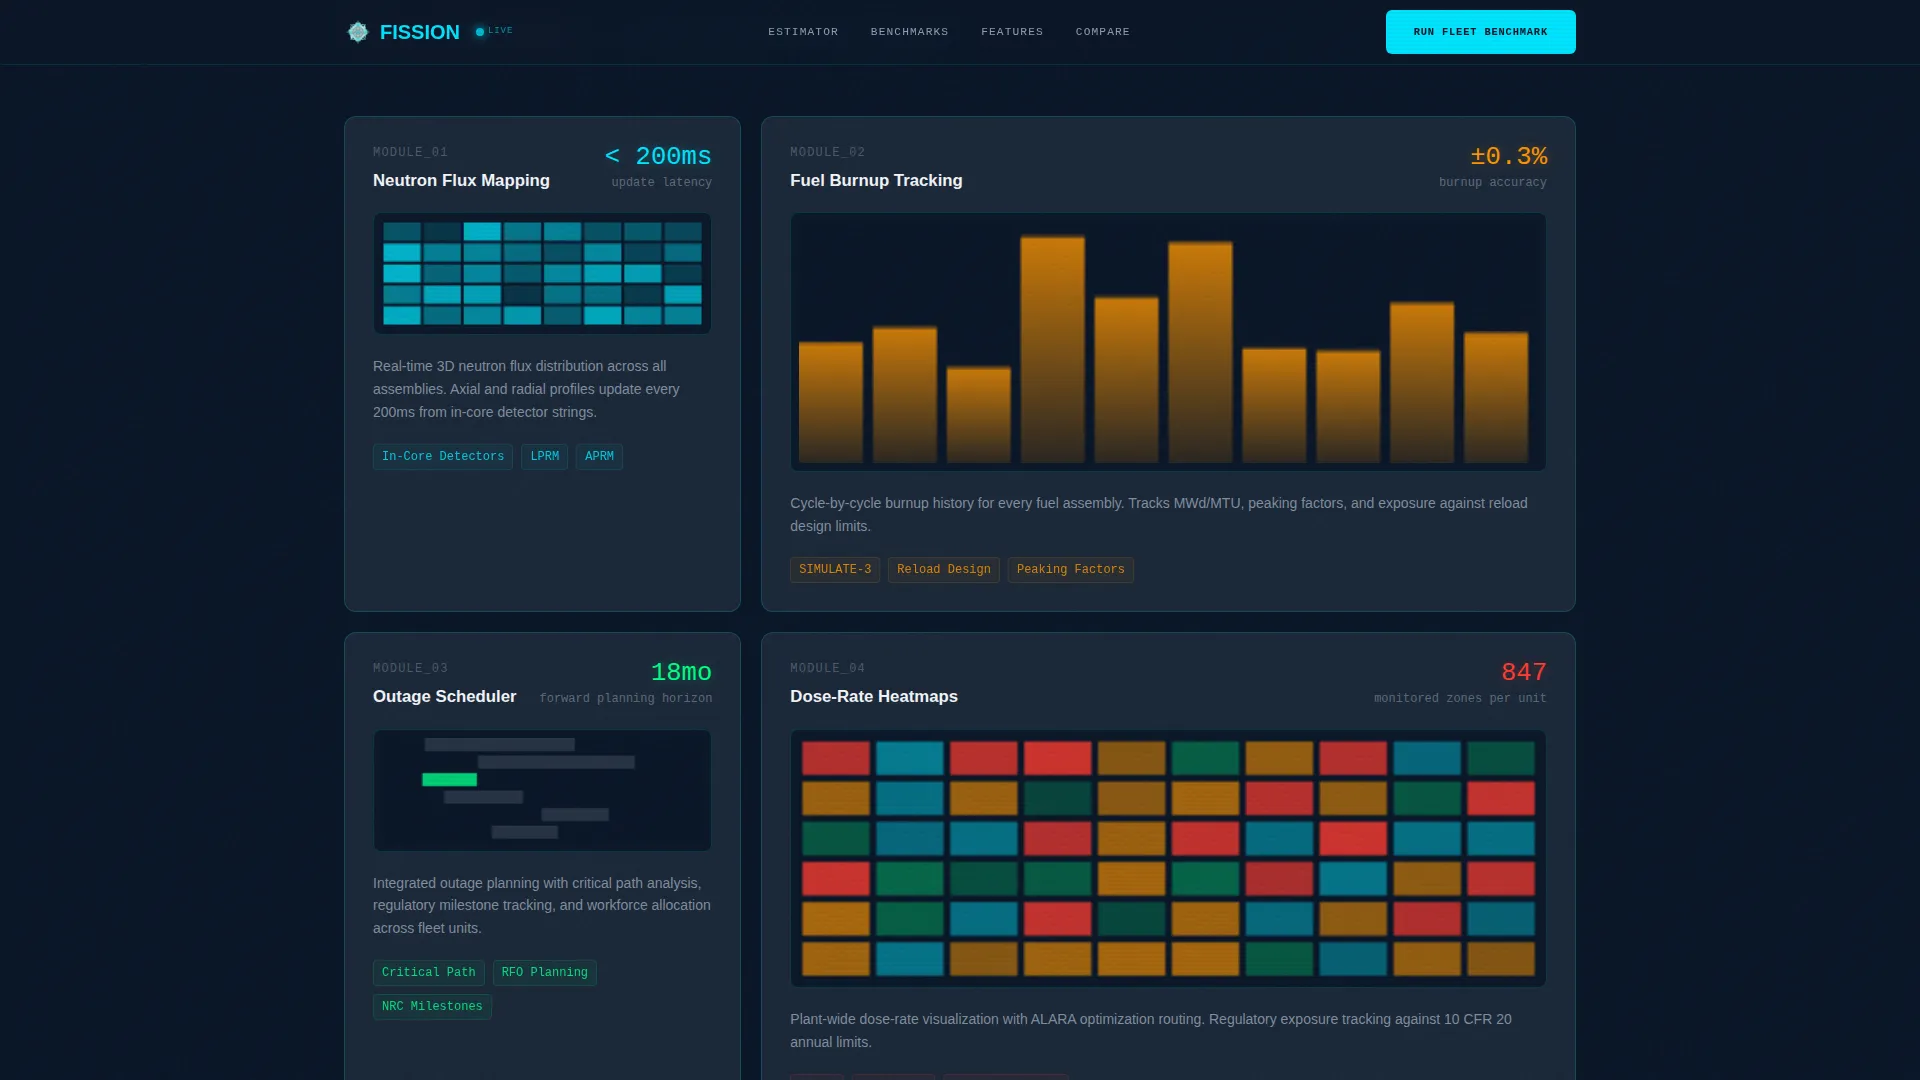
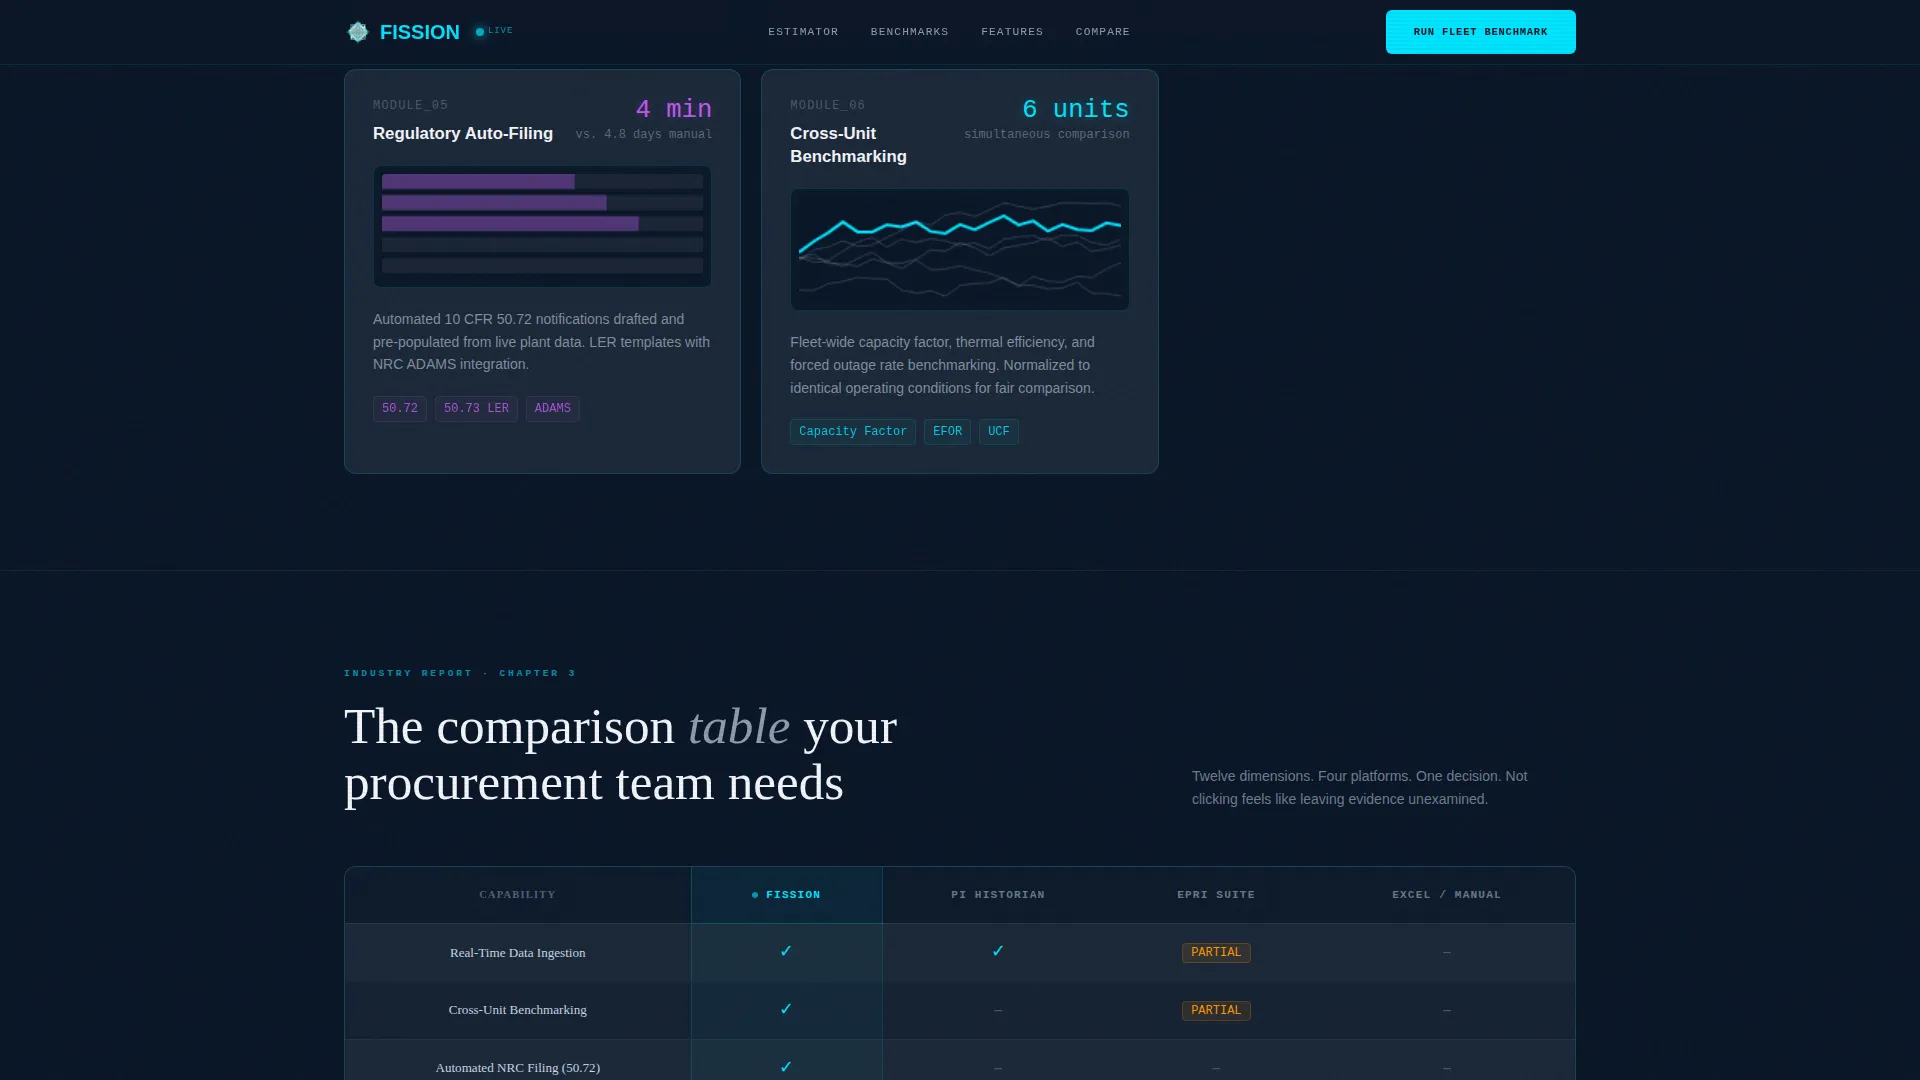
Six bento-style cards each present one platform capability. Coverage includes neutron flux mapping, fuel-burnup tracking, outage scheduling, dose-rate heatmaps, regulatory auto-filing, and cross-unit benchmarking. Each card carries a micro-screenshot and a single supporting metric.
Full-Width Comparison Table
A twelve-dimension versus table scores the platform against competing tool categories across every key operational and compliance criterion. Cyan checkmarks and silver dashes make differences readable at a glance, turning the scroll into a structured proof sequence.
Progressive Three-Step Conversion Form
The primary call-to-action form is staged across three steps. Step one collects plant name and fleet size. Step two asks about current tooling and the biggest operational pain point. Step three requests a work email and preferred demo window, reducing drop-off by building commitment gradually.
PDF Secondary Conversion Path
Visitors not ready to book a demo can download a gated industry report PDF. Only an email address is required. This path captures early-stage buyers and keeps them inside the funnel without forcing a full demo commitment.
Page sections overview
| Section | Purpose |
|---|---|
| Header Estimator | Capture attention with personalized fleet projections |
| Industry Benchmark Cards | Frame the market problem with cited data |
| Feature Module Grid | Demonstrate platform capabilities with proof metrics |
| Comparison Table | Score the platform against competing tools |
| Progressive call to action Form | Qualify and convert visitors into demo leads |
| PDF Download Path | Capture early-stage buyers via email gate |
| Footer | Single-row linear navigation and legal links |
Design & branding system
The visual system is built around a Data Command aesthetic that feels like a darkened nuclear control room. The palette draws from the Cherenkov glow of a spent-fuel pool: overwhelmingly dark, then a single electric blue light that makes every element legible.
- Background uses deep reactor-pool blue (#0A1628); card surfaces use instrument-panel charcoal (#1B2838) with 1-pixel cyan borders that brighten on hover
- Coolant-channel cyan (#00E5FF) drives all live data accents, interactive hover states, and data visualization pulses
- Typography combines JetBrains Mono for data labels, Plus Jakarta Sans for body text, and Fraunces for headline type in near-white (#F4F6FB)
Mobile & speed optimization
This template is built desktop-first. The primary users are shift supervisors on workstations and fleet engineers on large monitors, so the layout prioritizes wide-screen data density. Responsive behavior is still included for secondary device contexts.
- Static content sections are built as server components to reduce initial load overhead
- Interactive elements including the estimator calculator, progressive form, and hover animations run as isolated client components
- Animations use GSAP ScrollTrigger with canvas-based spark-line charts and stat counters that activate on scroll entry
How this template helps you convert
The conversion architecture mirrors the way a skeptical engineer reads an industry technical brief: data first, context second, proof third. Each section earns the right to ask for the next step.
- The Fleet Performance Estimator opens with a personalized output tied to the visitor's own fleet numbers, making the value proposition feel immediate and specific rather than generic.
- The industry benchmark chapter and comparison table deliver independent proof before the call to action appears, so the "Run Your Fleet Benchmark" button feels like a logical next step rather than a sales push.
Other information about this template
This template is designed for nuclear vertical software-as-a-service products targeting enterprise buyers in the US nuclear power industry. It uses NRC and nuclear industry terminology throughout, with localization set to English, USD currency, and US date formatting.
- The "Run Your Fleet Benchmark" call to action appears three times: inside the estimator header, as a sticky bottom bar after the comparison table, and as a closing card
- The footer follows a Pattern 1 linear single-row layout
- Animation intensity is high, with GSAP ScrollTrigger, pulse effects, and stat counter animations built into the scrolling experience
- The template uses industry-specific language such as 10 CFR 50.72 event reports, capacity factors, neutron flux, and fuel-burnup cycles to signal credibility to technical buyers
Theme
Data Command
Creative direction
Industry Report
Color system
Midnight Blue
Style
Card Grid (Modular)
Direction
Comparison/Versus
Page Sections
Live Fleet Performance Estimator
Industry Benchmark Card Chapter
Six-card Feature Module Grid
Twelve-dimension Comparison Table
Progressive Three-step Call to Action Form
Gated PDF Secondary Path
Related questions
Who is the primary audience for this landing page template?
Can I customize the Fleet Performance Estimator inputs and outputs?
What conversion paths does this template include?
Is this template designed for desktop or mobile use?
How does the comparison table work?



