AI for Financial Cost Calculator Website Template
Forecast is a dark-themed, dashboard-style landing page template built for AI-powered inventory forecasting platforms. It targets CFOs, operations directors, and supply chain leads at mid-market retailers and direct-to-consumer brands. The template uses a Problem-to-Solution scroll arc, glassmorphic KPI cards, an interactive margin calculator, and a three-step lead capture form to convert high-intent visitors into diagnostic leads.
by Rocket studio
Quick summary
Forecast is a single-page, lead generation template designed for B2B software platforms in AI-powered inventory forecasting. It guides a high-intent visitor from a visceral cost-of-guessing pain section through a solution reveal, a supplier workflow diagram, an interactive margin calculator, and a three-step diagnostic form. Every visual decision reinforces precision, control, and urgency.
Who this template is for
This template is purpose-built for software companies and platform teams selling intelligent inventory tools to operations-heavy buyers. If your product speaks the language of stock-keeping units, reorder points, and demand curves, this template was designed around that conversation.
- CFOs and finance leads at mid-market retailers tired of writing off dead inventory
- Operations directors at direct-to-consumer brands burning cash on excess safety stock
- Supply chain leads at regional distributors who still reconcile forecasts in spreadsheets
What problem this template solves
Most landing pages for financial services AI tools either over-explain the technology or under-deliver on proof. Buyers like CFOs and operations directors need to feel the cost of their current problem before they trust a new solution. This template is built around that exact psychology.
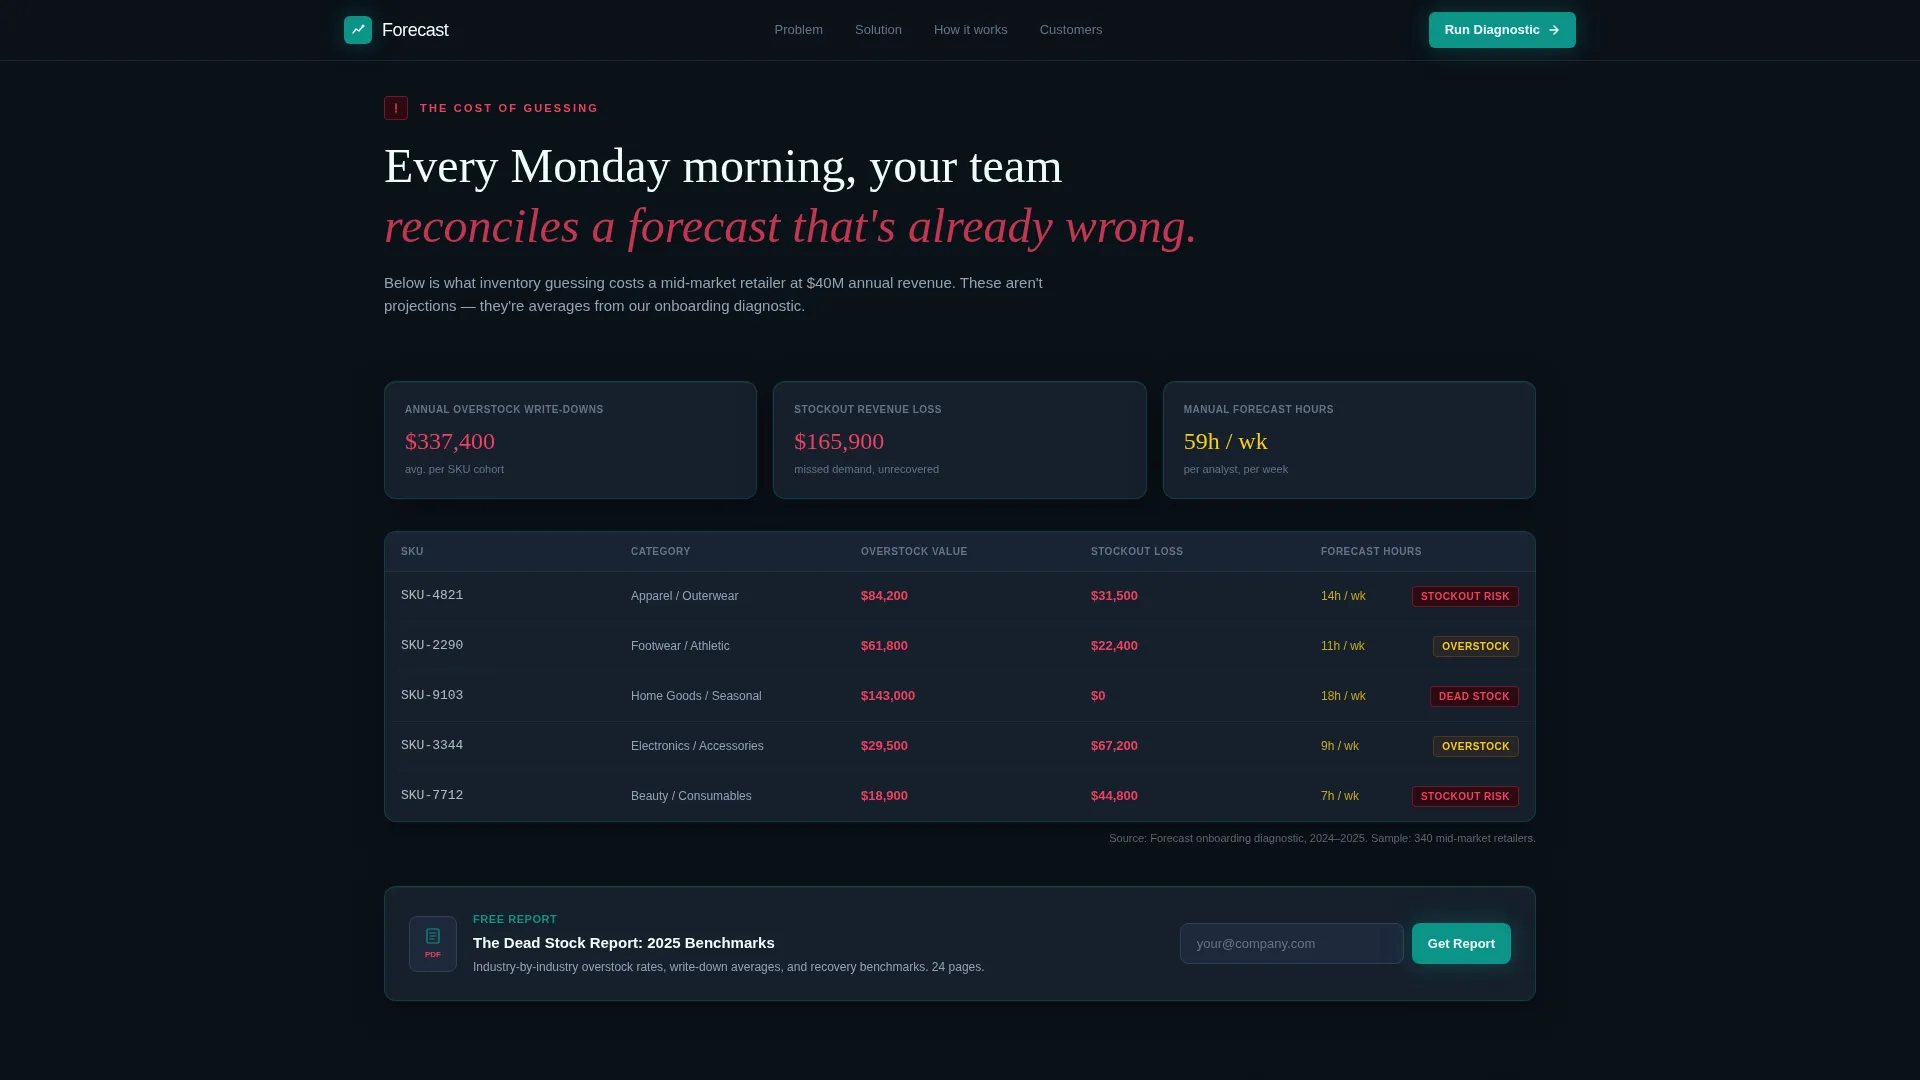
- It opens with a data grid that shows real-looking overstock write-downs and stockout revenue losses, making the pain immediate and quantified
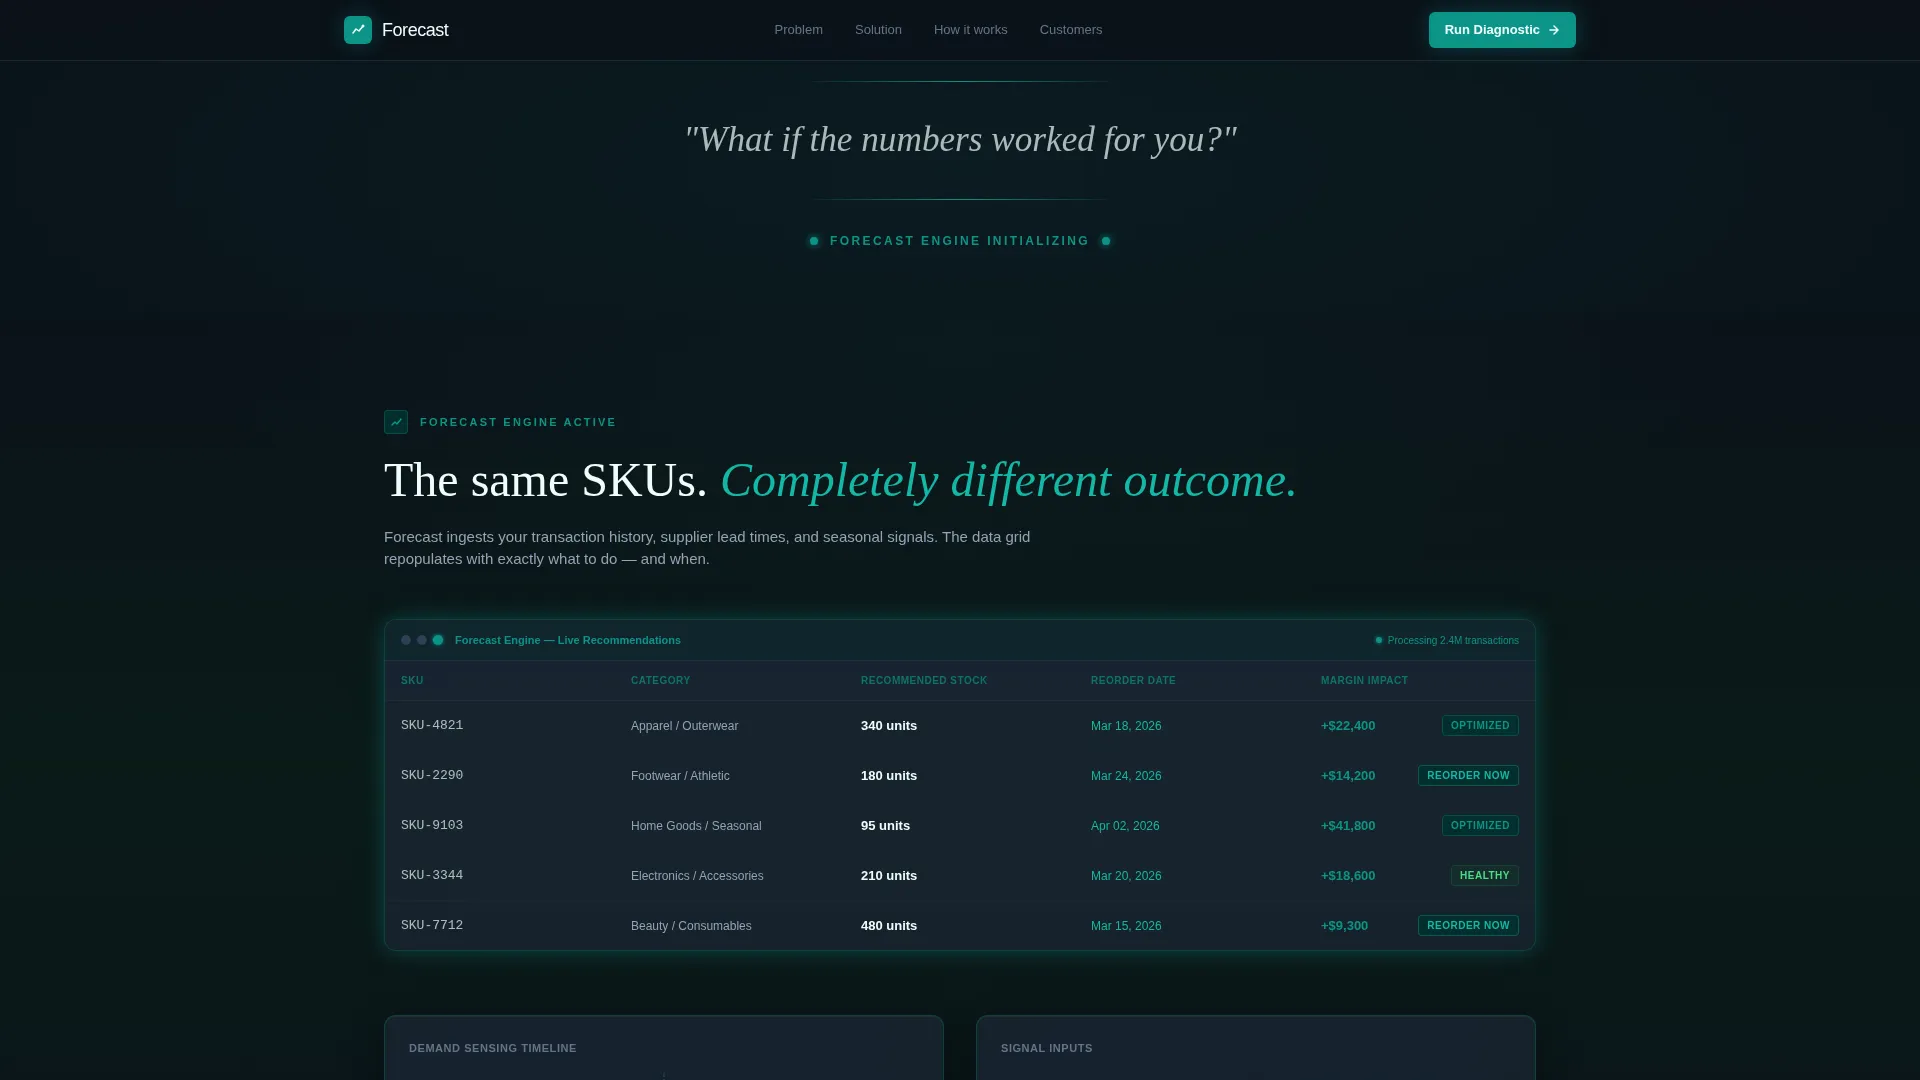
- It then transitions into an optimized view of the same grid, shifting the narrative from cost to control
- It closes with a progressive lead form that qualifies visitors by revenue range, forecasting method, and their single biggest inventory challenge
What you get with this template
You get a fully structured, design-ready landing page with dark glassmorphic user interface, animated data sections, an interactive calculator, and a multi-step lead capture flow. Every section has a defined purpose in the conversion arc.
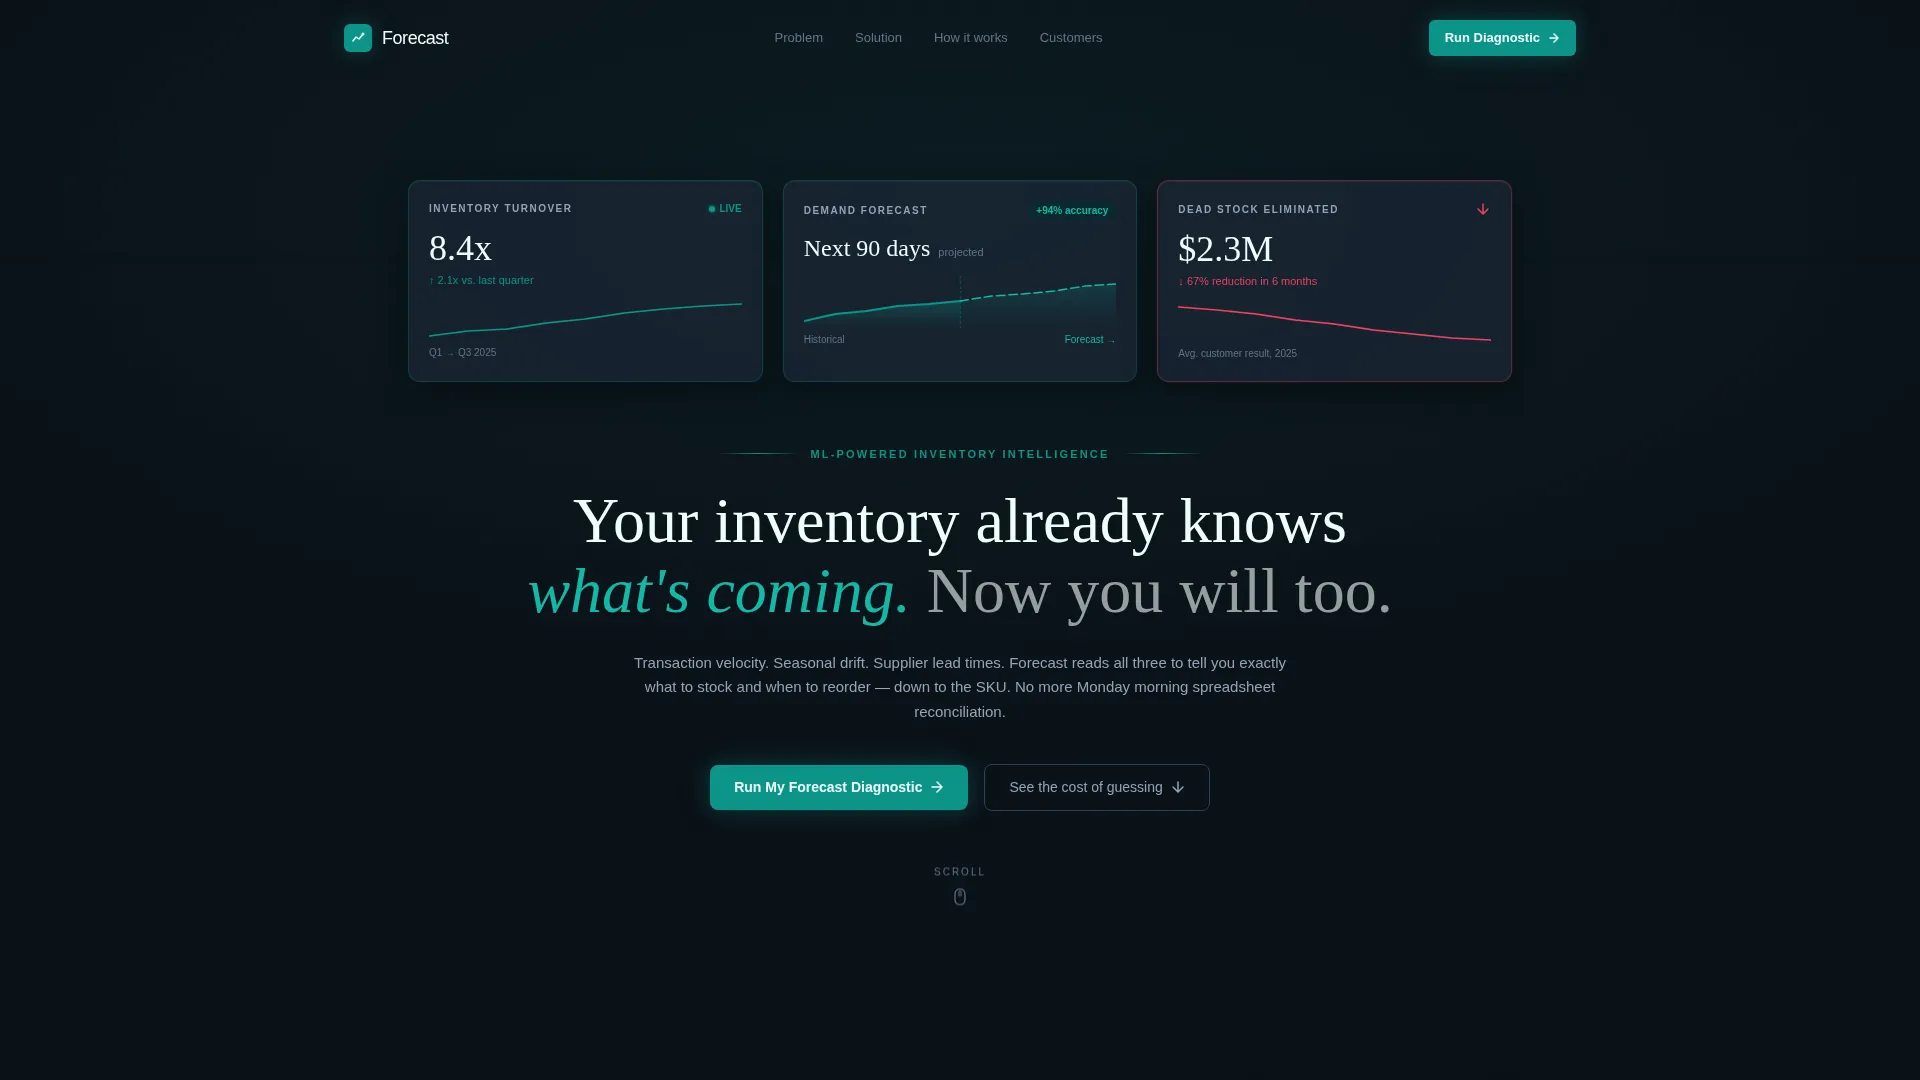
- A hero with three floating KPI cards, an atmospheric dark background, and a headline built to stop a CFO mid-scroll
- A pain-to-solution data grid that visually transforms as the visitor scrolls, with coral alert styling for problem figures and teal for resolved ones
- A supplier sync workflow diagram, a margin impact calculator with a revenue-range slider, and testimonial cards styled as field reports
Feature list
This section describes the core built-in components and interaction patterns included in the Forecast template.
Glassmorphic Hero KPI Cards
Three translucent, frosted-glass data cards float against the deep command-center background. Each card displays a live-looking metric: inventory turnover ratio, a demand forecast curve, and a dead stock elimination figure. Subtle teal border glows and micro-reflections give the hero immediate credibility.
Problem-to-Solution Data Grid
The page opens with a cost-of-guessing table rendered in slate and coral, showing overstock write-downs, stockout revenue loss, and manual forecast hours. A single-line transition triggers a palette shift, and the same grid repopulates with optimized teal figures. This is the emotional and logical pivot of the entire scroll.
Animated Demand-Sensing Timeline
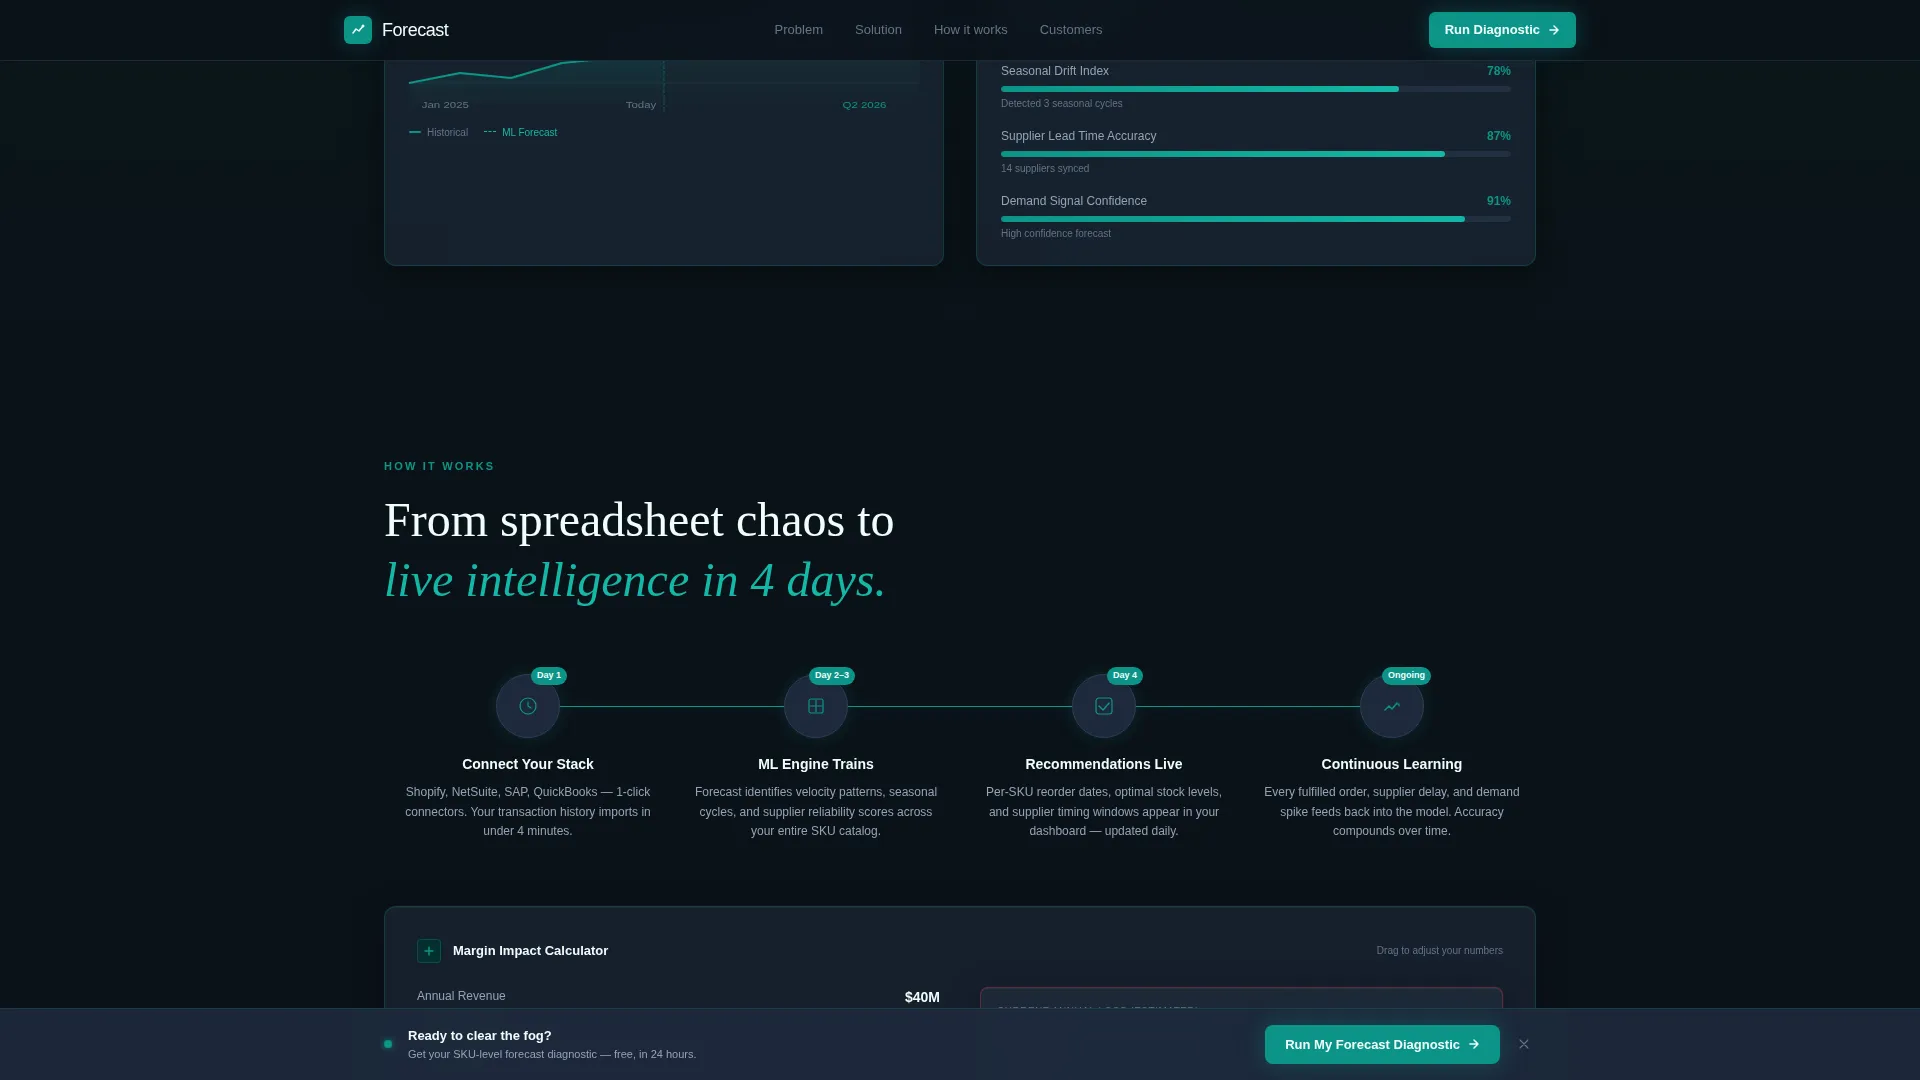
A scrollable timeline section visualizes how transaction velocity, seasonal drift, and supplier lead times feed into the forecasting model. The animation is driven by GSAP ScrollTrigger, so elements come online as the visitor reaches them, reinforcing the sense of a control room activating.
Interactive Margin Impact Calculator
Visitors input their own annual revenue range using a slider. The calculator returns estimated margin impact figures based on the selected range. This section sits in the workflow area and gives finance-minded buyers a personalized reason to continue to the lead form.
Three-Step Diagnostic Lead Form
The primary conversion path is a progressive micro-form anchored in a sticky bottom bar. Step one captures revenue range and industry vertical. Step two asks how the visitor currently forecasts. Step three captures name, company email, and a free-text field for their biggest inventory challenge.
Mid-Page Lead Magnet Gate
A secondary conversion path offers a downloadable PDF report positioned directly after the cost-of-guessing section. It is gated behind email only, placed at the moment of peak pain to capture visitors who are not yet ready for the full diagnostic flow.
Page sections overview
| Section | Purpose |
|---|---|
| Hero KPI Cards | Establish credibility and curiosity with three floating metric cards |
| Cost-of-Guessing Grid | Make overstock and stockout losses immediate and tangible |
| Lead Magnet Gate | Capture emails mid-page at peak pain with a PDF download offer |
| Solution Reveal Grid | Reframe the same data with optimized teal figures after palette shift |
| Demand-Sensing Timeline | Animate the forecasting model inputs as a scrollable visual story |
| Supplier Sync Diagram | Show how supplier lead times feed into the reorder recommendation flow |
| Margin Impact Calculator | Let visitors apply their revenue range to personalized margin estimates |
| Testimonial Field Reports | Embed ops director social proof between data sections |
| Sticky Diagnostic Form | Anchor the primary three-step lead form in a persistent bottom bar |
Design & branding system
The Forecast template uses the Teal Catalyst color system on a Dashboard Pro theme. Every color in the palette has a defined role: backgrounds recede, surfaces organize, and alert colors earn immediate attention. Typography pairs a geometric sans-serif for data labels with a serif for high-impact headline moments.
- Color roles: deep black (#0B1219) for background, operational teal (#0D9488) for active states and solution moments, cool slate (#1E293B) for card surfaces, signal white (#F0FDFA) for KPI figures, and coral (#F43F5E) reserved strictly for alerts and overstock warnings
- Typography: DM Sans handles all interface copy, data labels, and body text; Fraunces appears at headline moments for editorial weight and contrast
- Visual style: Dark Glass Panels composition with frosted-glass card depth, faint teal border glows, and micro-reflections throughout the hero and data sections
Mobile & speed optimization
The template is designed desktop-first, reflecting how CFOs and operations directors typically work. The layout uses responsive breakpoints so the experience remains clean and navigable on smaller screens. Interactive components are separated into client-rendered modules to keep static sections fast.
- Desktop-first layout with responsive mobile breakpoints for all sections and data grids
- GSAP ScrollTrigger animations and the margin calculator are client-rendered; static sections use server component architecture for faster initial load
- The sticky call-to-action bar and the three-step form are optimized for desktop interaction but remain accessible on tablet and mobile viewports
How this template helps you convert
Every section in this template serves the conversion arc. The structure moves a skeptical finance buyer from pain recognition to solution confidence to qualified lead submission in a single scroll.
- The hero KPI cards and headline create immediate relevance for inventory-focused buyers, establishing that the platform understands their specific operational context before a single word of product copy appears.
- The cost-of-guessing grid followed by the mid-page PDF gate captures high-intent visitors at the exact moment of pain, giving you two conversion opportunities before the visitor reaches the primary diagnostic form.
- The three-step progressive form qualifies leads by revenue, forecasting method, and stated pain point, so every submission arrives with actionable context rather than just a name and email address.
Other information about this template
The Forecast template is a strong fit for teams building go-to-market pages for machine learning inventory tools, demand planning software, or supply chain analytics platforms. It is also well-suited for product launches targeting finance-adjacent buyers who respond to data-dense, proof-forward design.
- The template is built on a Dashboard Pro theme and uses the Teal Catalyst color system as its foundational design language
- Localization defaults are English, United States dollar currency, and United States date format
- The footer follows a Linear Single-Row pattern for a clean, minimal close that keeps focus on the final call to action
- Animation complexity is high by design: GSAP ScrollTrigger drives the data grid swap, the teal bleed transition, and counter animations throughout the scroll
Theme
Dashboard Pro
Creative direction
Problem→Solution Arc
Color system
Teal Catalyst
Style
Dashboard/Data Grid
Direction
Lead Generation
Page Sections
Glassmorphic Hero KPI Cards
Problem-to-solution Data Grid
Animated Demand-sensing Timeline
Interactive Margin Impact Calculator
Three-step Progressive Lead Form
Mid-page PDF Lead Magnet
Related questions
Who is the Forecast template designed for?
What conversion paths does the template include?
Can I adapt the color system and typography for my own brand?
Does the margin impact calculator require custom backend setup?
Is this template suitable for a product in a different vertical?



