AI for Financial Cost Calculator Website Template
Forecast is a dashboard-style AI inventory forecasting landing page built for B2B SaaS platforms targeting mid-market retailers, direct-to-consumer brands, and regional distributors. It uses a Problem-to-Solution scroll arc, live-looking KPI cards, an interactive margin calculator, and a three-step lead generation form to convert CFOs, operations directors, and supply chain leads into qualified pipeline.
by Rocket studio
Quick summary
Forecast is a single-page, dashboard-style lead generation template for AI-powered inventory forecasting platforms. It opens with frosted-glass KPI cards in a command-center dark layout, walks visitors through a cost-of-guessing problem grid, and resolves into a teal-lit solution reveal. The primary call to action is "Run My Forecast Diagnostic," captured through a progressive three-step form.
Who this template is for
This template is built for B2B SaaS companies selling machine-learning inventory forecasting tools to mid-market businesses. It speaks directly to buyers who carry real financial accountability for inventory decisions.
- CFOs at mid-market retailers managing overstock write-downs and dead inventory costs
- Operations directors at direct-to-consumer brands burning cash on excess safety stock
- Supply chain leads at regional distributors still reconciling forecasts in spreadsheets each week
What problem this template solves
Inventory forecasting platforms often struggle to communicate the financial cost of inaccurate stock decisions. A generic product page does not create urgency for the specific buyers who feel that pain most directly.
- Visitors leave without understanding the dollar impact of their current forecasting method
- The value of machine-learning precision over spreadsheet guessing is rarely made visible before a demo request
- Lead capture forms placed too early in the scroll collect low-intent submissions from unqualified visitors
What you get with this template
This template delivers a fully structured, scroll-driven landing page designed around a Problem-to-Solution Arc. Every section builds trust and urgency before asking for contact information.
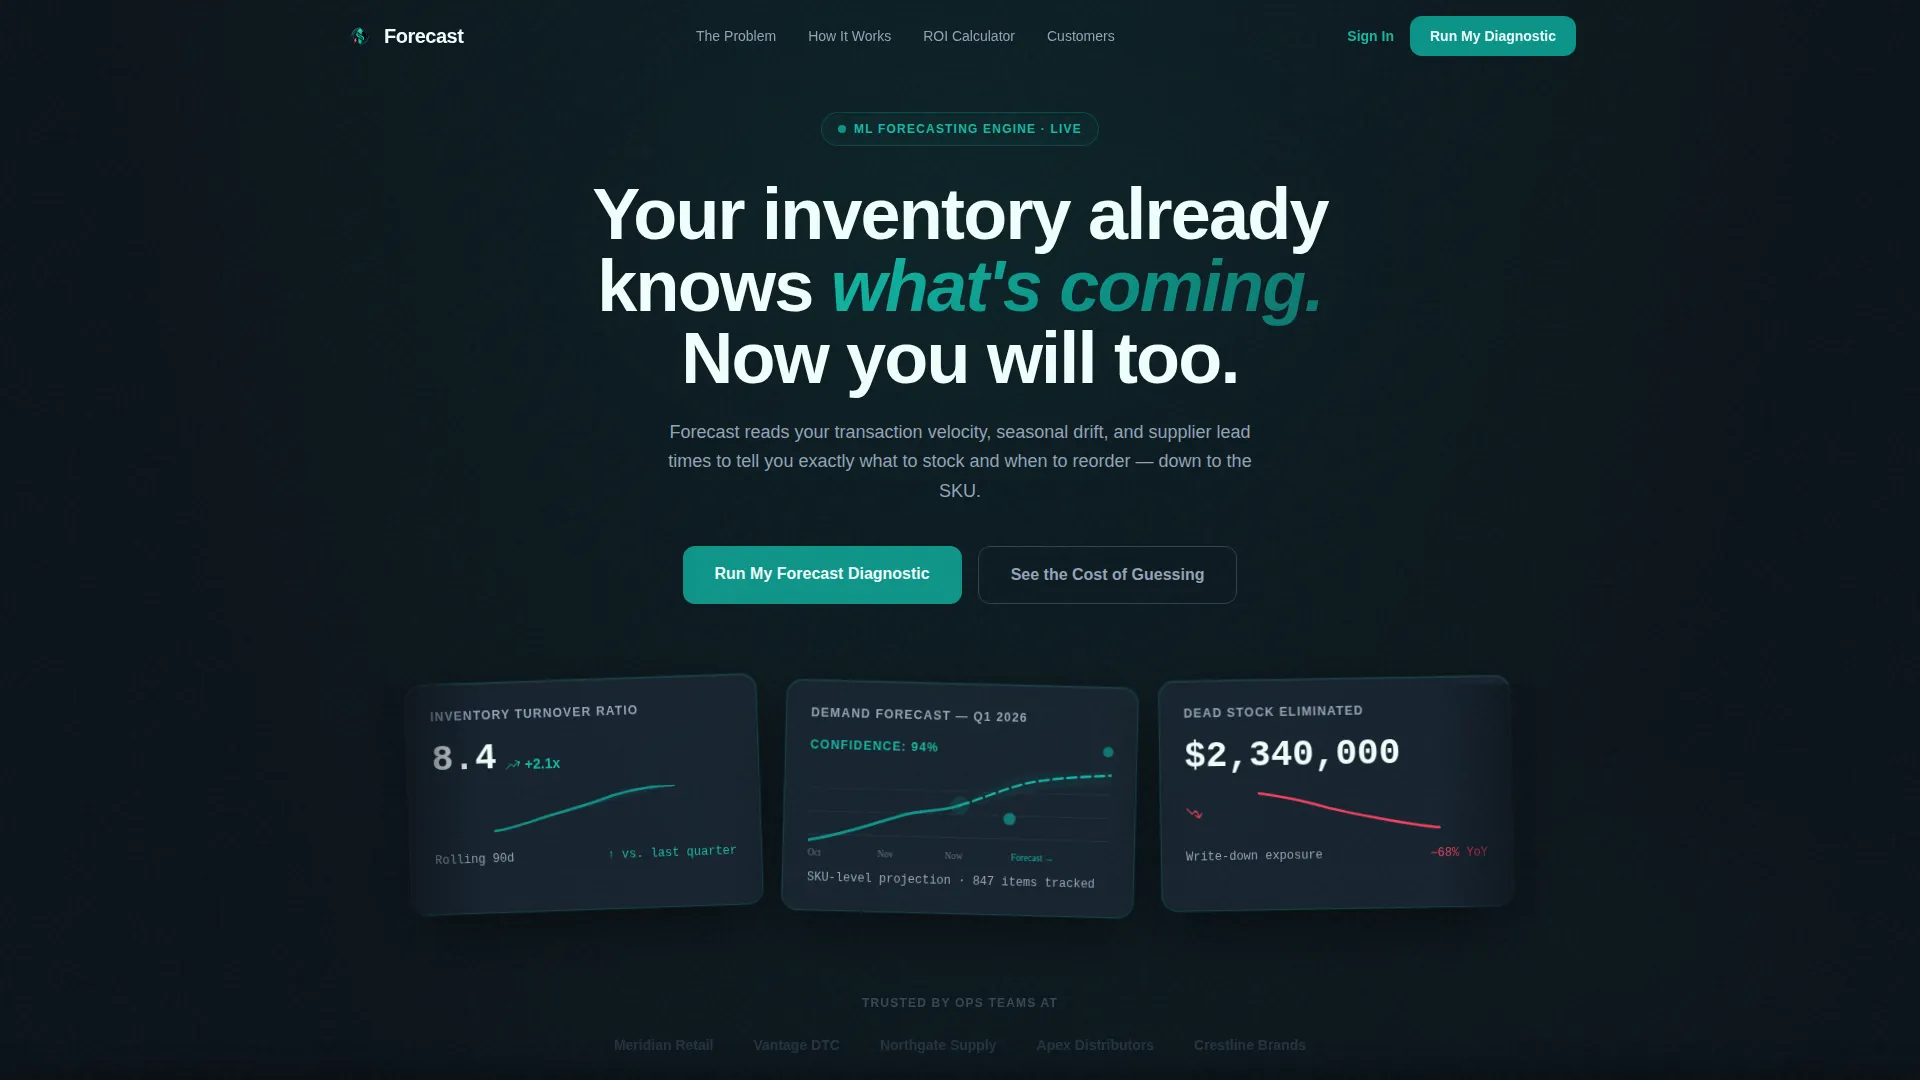
- A hero section with three floating dark glass KPI cards and a fade-in headline
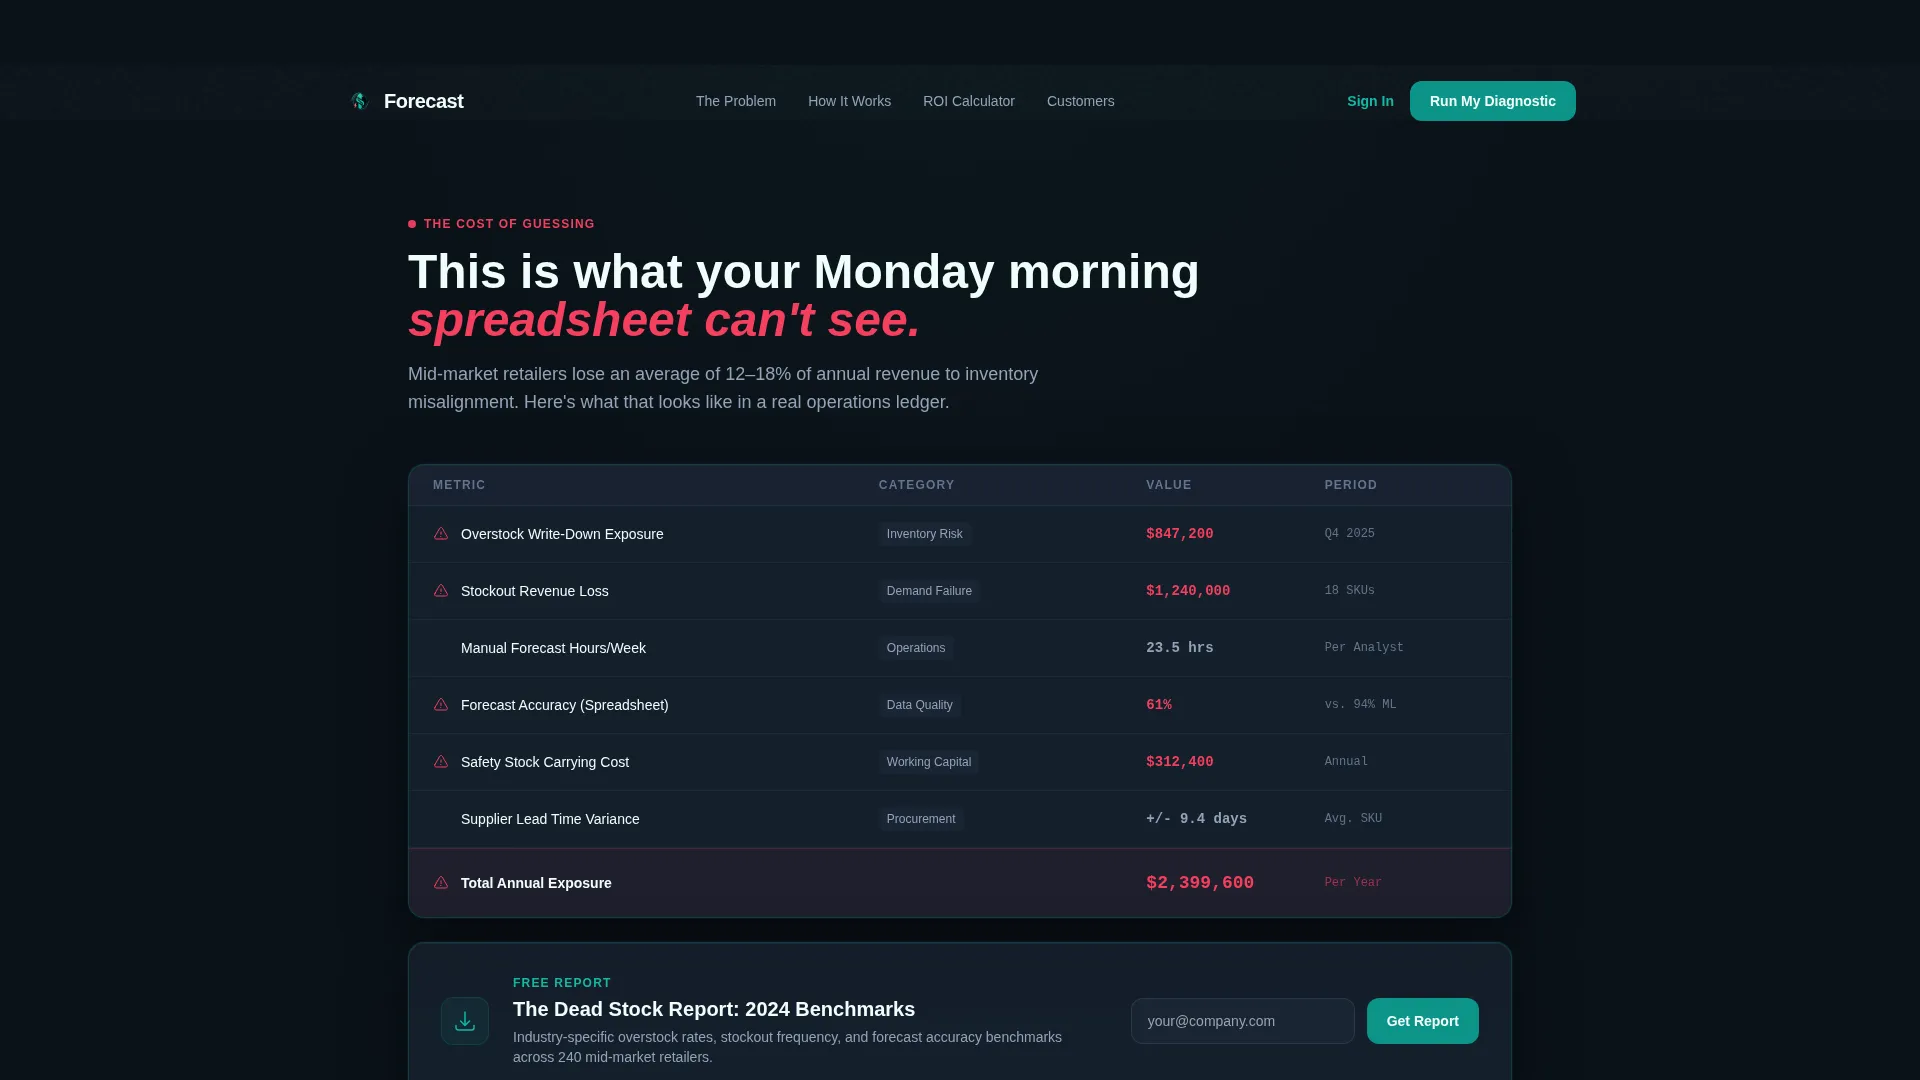
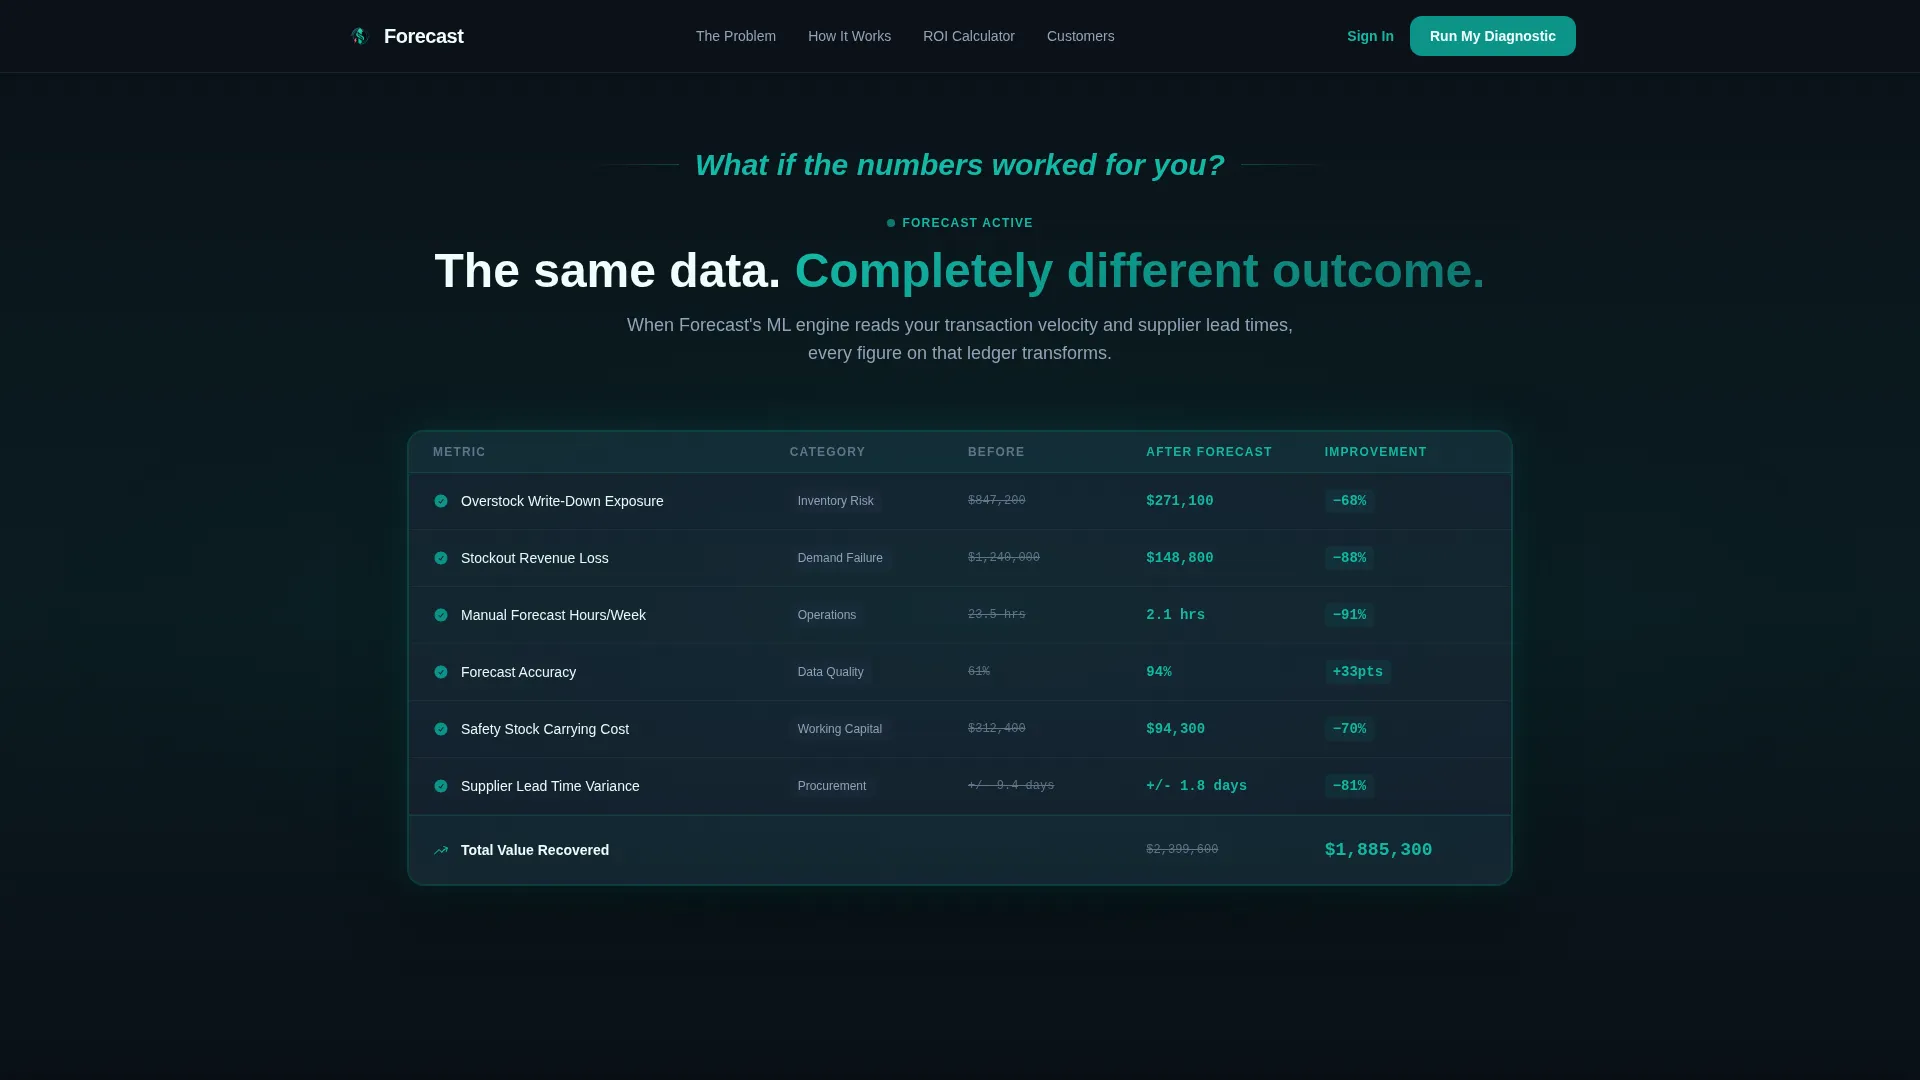
- A two-state data grid that shows the cost of guessing in coral and slate, then repopulates with optimized figures as teal bleeds in
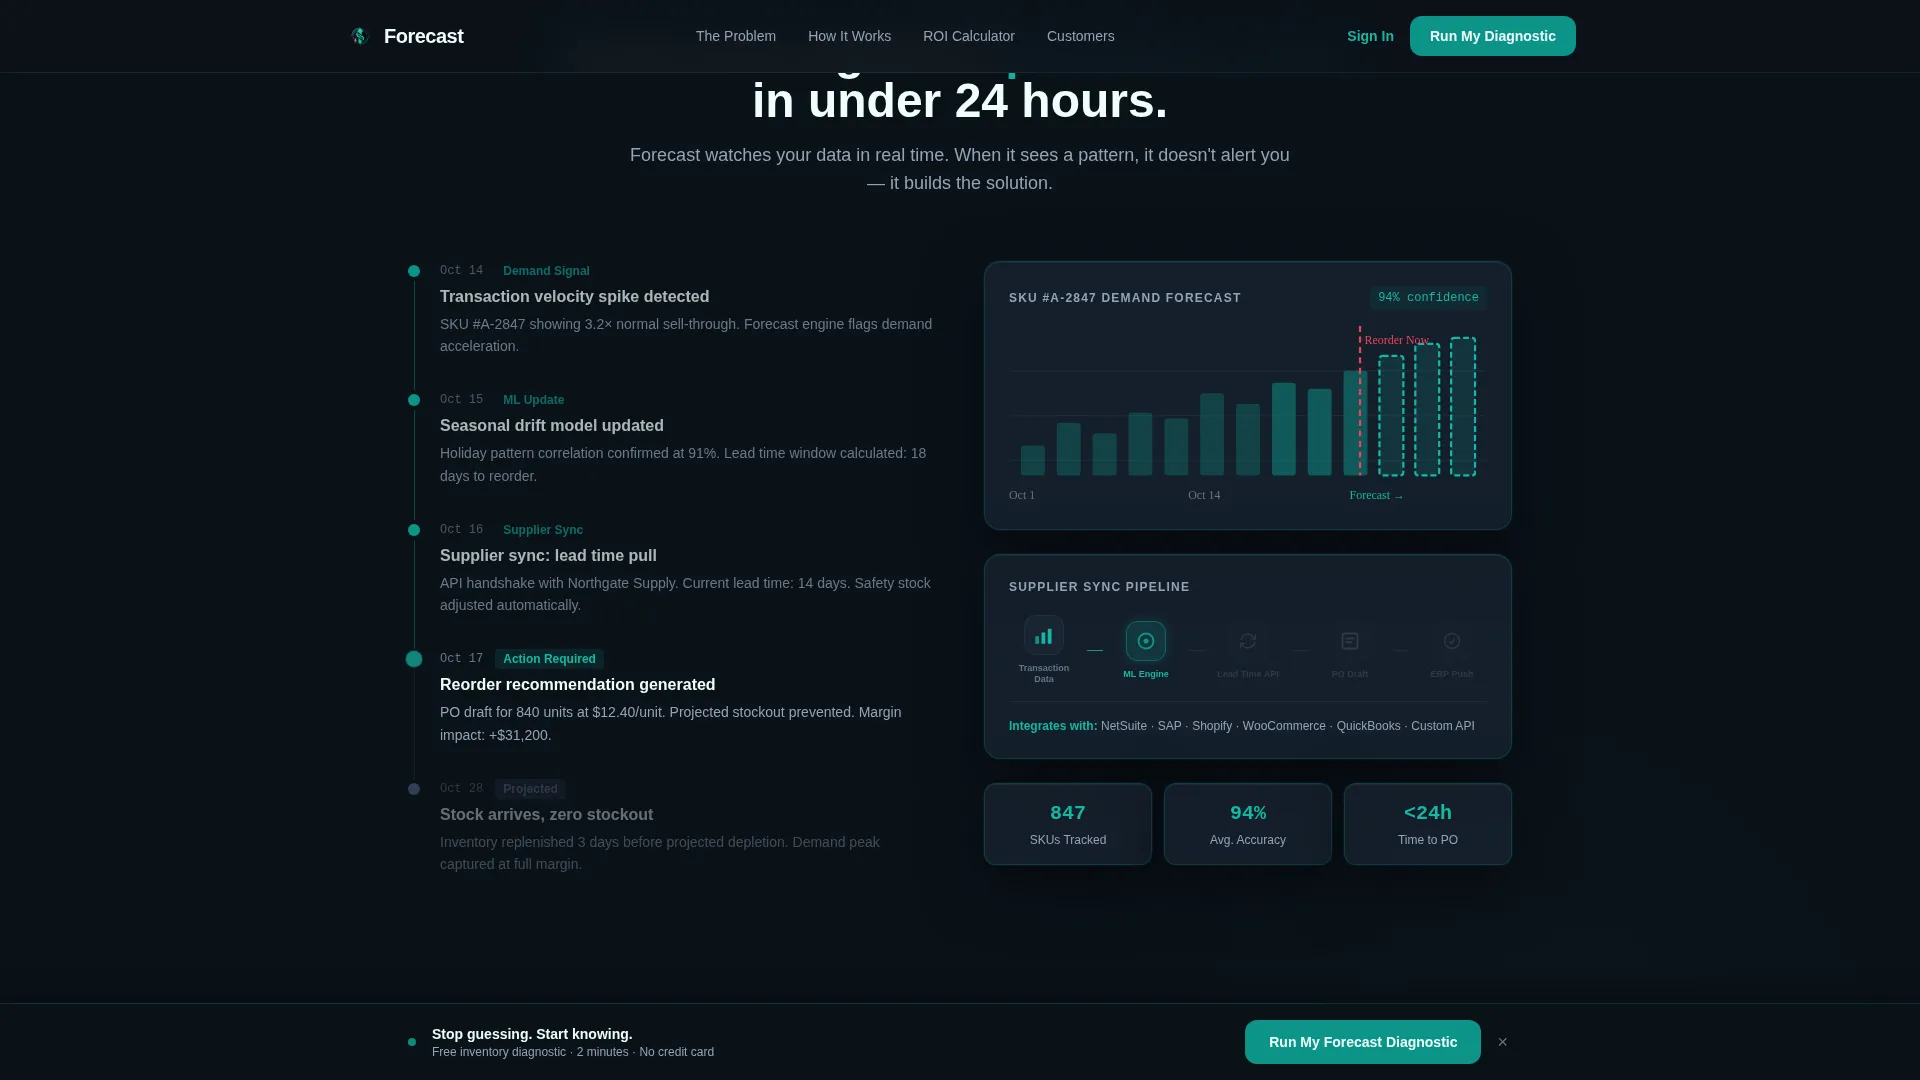
- An interactive margin calculator, animated demand-sensing timeline, supplier sync workflow diagram, and testimonial cards embedded as field reports
- A sticky bottom bar with the primary call to action and a progressive three-step lead generation form
Feature list
This template includes purpose-built components for demand intelligence platforms. Each one is designed to qualify visitors and move them toward the primary conversion action.
Dark Glass KPI Hero Cards
Three translucent frosted-glass cards float against the deep command-center background. Each displays a live-looking metric: inventory turnover ratio, a forward-looking demand curve, and a dollar figure for dead stock eliminated. Coral accents mark the alert-state card, while teal borders give each card a subtle pulse.
Problem-to-Solution Data Grid
The scroll opens with a data grid rendered in slate and coral showing real-looking overstock write-downs, stockout revenue loss, and manual forecast hours per week. After a single-line transition, the same grid repopulates with optimized figures and the palette shifts to teal, making the before-and-after contrast impossible to miss.
Interactive Margin Impact Calculator
Visitors enter their own annual revenue range via a dropdown and watch the template calculate a projected margin impact. This interactive element personalizes the value proposition and increases engagement time before the form appears.
Three-Step Lead Generation Form
The primary conversion flow is a progressive micro-form. Step one collects revenue range and industry vertical. Step two asks how the visitor currently forecasts. Step three captures name, company email, and a free-text field for their biggest inventory challenge right now.
Sticky Call-to-Action Bar
A persistent bottom bar labeled "Run My Forecast Diagnostic" appears after the problem section resolves on scroll. It stays visible throughout the rest of the page without interrupting the reading flow.
Mid-Page PDF Lead Magnet
A secondary conversion path offers a downloadable report gated behind email only. It is positioned immediately after the cost-of-guessing section, when visitor pain is at its highest point in the scroll.
Page sections overview
| Section | Purpose |
|---|---|
| Hero KPI Cards | Establish credibility with live-looking inventory metrics |
| Problem Cost Grid | Surface the financial cost of inaccurate forecasting |
| Solution Grid Reveal | Show optimized figures with teal transition to signal resolution |
| Demand-Sensing Timeline | Visualize ML-driven forecast confidence across future quarters |
| Supplier Sync Diagram | Illustrate how lead times and reorder points connect |
| Margin Calculator | Let visitors calculate projected impact with their own revenue range |
| Testimonial Field Reports | Reinforce trust with ops-director voice embedded between data sections |
| PDF Lead Magnet | Capture mid-funnel email with a downloadable benchmarks report |
| Three-Step Form | Qualify and convert visitors into forecast diagnostic leads |
| Sticky call to action Bar | Keep the primary action visible throughout the scroll |
| Footer | Single-row linear layout for navigation and legal links |
Design & branding system
The visual identity follows the Teal Catalyst color system inside a Dashboard Pro theme. The overall feel is a cargo vessel bridge at night: dark, calm, and every illuminated element intentional.
- Core palette: deep command-center black (#0B1219) as the base, operational teal (#0D9488) for active states and card borders, cool slate (#1E293B) for card surfaces and data panels, signal white (#F0FDFA) for KPI figures and body text, and accent coral (#F43F5E) reserved strictly for alerts and overstock warnings
- Typography: Plus Jakarta Sans for headings and display text, DM Sans for body copy and data labels, keeping the dashboard feel consistent across all sections
- Visual motifs: depth-of-field blur at card edges, micro-reflections on glass panels, scroll-linked teal bleed transitions, and KPI counter animations on reveal
Mobile & speed optimization
The template is built desktop-first to match the primary audience of CFOs and operations directors who work on large screens. Responsive breakpoints ensure the layout adapts cleanly on smaller devices.
- Scroll-linked animations and grid repopulation transitions are designed for desktop viewport widths where the before-and-after contrast lands with full impact
- Static structural sections use Server Components for efficient rendering, while the interactive calculator and multi-step form use Client Components to keep interactivity responsive
How this template helps you convert
Every scroll decision in this template is designed to reduce friction and increase qualified lead volume for inventory forecasting platforms.
- The problem grid surfaces real-looking financial pain before any ask is made, ensuring visitors self-qualify based on recognized costs before they encounter the form
- The progressive three-step micro-form reduces abandonment by breaking a potentially intimidating data request into three short, logical steps with clear progress
- The mid-page PDF gating captures email addresses from visitors who are not yet ready for a diagnostic call, creating a secondary funnel for follow-up without losing the lead entirely
Other information about this template
This template is part of the Dashboard Pro theme collection and uses the Teal Catalyst color system as its visual foundation. It is designed for teams building lead generation pages in the financial services AI and inventory intelligence space.
- Template style: Dashboard and Data Grid, suited for platforms where data visualization is a core part of the product story
- Creative direction: Problem-to-Solution Arc, header concept: Dark Glass Panels, page direction: Lead Generation
- Category placement: Technology, subcategory AI for Financial Services, niche Financial Services AI Inventory Forecasting
- The footer follows a Linear Single-Row pattern for a clean, minimal close to the page
- Localization defaults: English language, USD currency, MM/DD/YYYY date format, North American mid-market retail context
Theme
Dashboard Pro
Creative direction
Problem→Solution Arc
Color system
Teal Catalyst
Style
Dashboard/Data Grid
Direction
Lead Generation
Page Sections
Dark Glass KPI Hero Cards
Problem-to-solution Data Grid
Interactive Margin Impact Calculator
Three-step Progressive Lead Form
Sticky Diagnostic Call to Action Bar
Mid-page PDF Lead Magnet Gate
Related questions
Who is this landing page template designed for?
What conversion paths does this template include?
Can I customize the KPI figures and data grid values?
Does this template include the interactive margin calculator logic?
How many sections does this landing page include?



