Forecast - Predictive Travel Landing Page Template
Forecast is a bento grid landing page template built for travel AI inventory forecasting platforms. It combines a dark glass panel header, stats-first data visuals, and a guided demo click-through flow to move revenue managers from first glance to live forecast in minutes. The design runs on a void-black and iridescent palette that makes every number feel urgent and earned.
by Rocket studio
Quick summary
Forecast is a single-page bento grid template designed for AI-powered travel inventory forecasting tools. It opens with a wall of frosted-glass data panels above the fold, escalates through outcome rows, model mechanics, and proof sections, and closes with a pulsing call-to-action bar. Every visual choice reinforces calm authority over real-time demand data.
Who this template is for
This template is built for teams that sell or present predictive revenue tools to travel industry buyers. It speaks directly to the people staring at dashboards before most offices open.
- Revenue managers at boutique hotel groups who track occupancy gaps and need faster inventory decisions
- Airline yield analysts repricing transatlantic routes mid-week against shifting demand signals
- Online travel agency operations leads trying to prevent overbooking penalties from cutting into margin
What problem this template solves
Travel inventory decisions still happen too late. By the time a revenue manager sees a demand spike in their dashboard, the window to reprice or release inventory has often already closed. This template is designed for platforms that solve exactly that gap.
- It gives forecasting tools a credible, data-forward face that earns trust before asking for a demo sign-up
- It removes the friction of leading with marketing copy when buyers respond to charts and KPI numbers
- It eliminates the mismatch between a sophisticated AI product and a generic SaaS landing page that undersells it
What you get with this template
You get a fully structured bento grid landing page with a dark glass panel header, three escalating content rows, and a dual-path conversion system. Every section is pre-built around the Stats-First Impact direction.
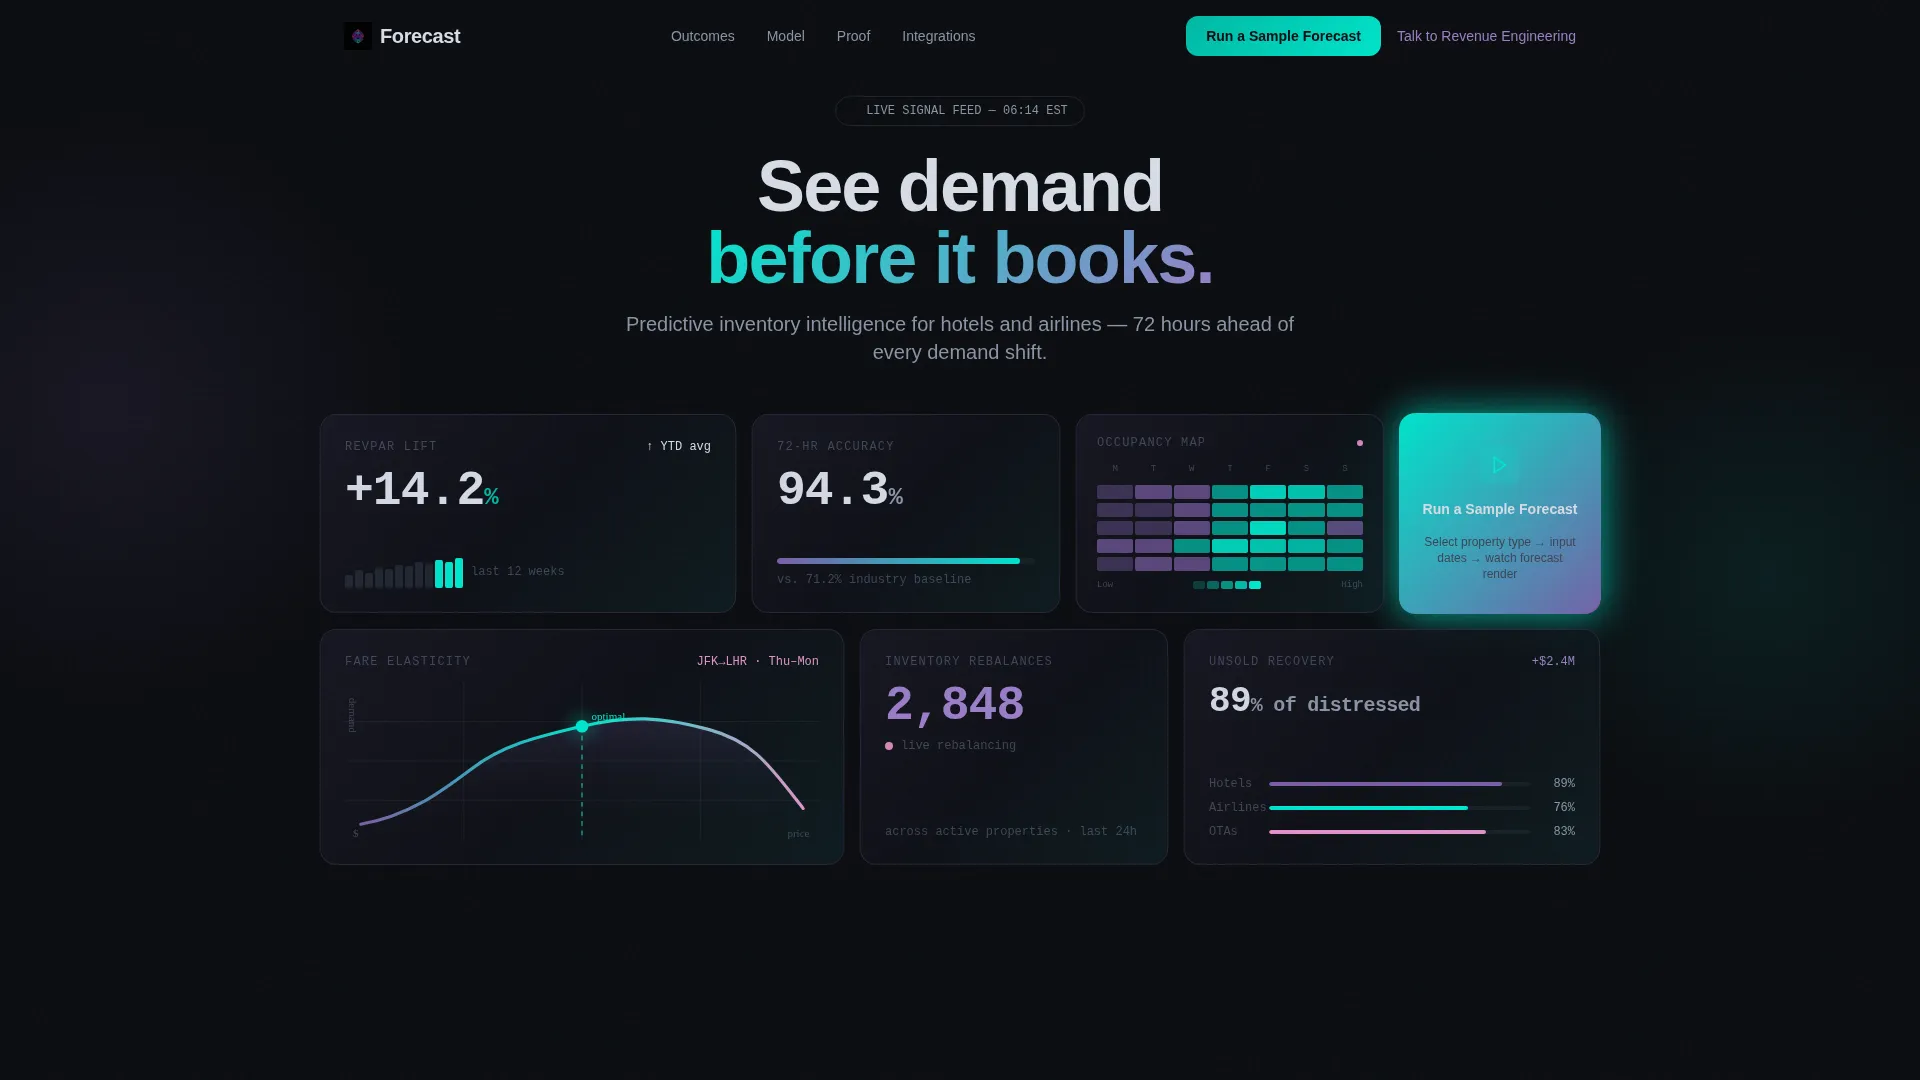
- A header grid with five to six frosted-glass cards displaying live-style stats, a fare elasticity curve, an occupancy heat map, and a pulsing "Run a Sample Forecast" card
- Three scroll rows that progress from outcomes to model mechanics to named proof points, with micro-interactions including card tilt on hover and chart animation on scroll-enter
- A sticky bottom bar call to action and a quieter secondary link for enterprise buyers who want a direct conversation
Feature list
This section covers the core functional components built into the Forecast template.
Bento Grid Header with Dark Glass Panels
The header fills the viewport with five to six frosted-glass bento cards. Each card holds a single live-looking stat or visual, such as a 72-hour demand forecast accuracy figure, a miniature occupancy heat map, or a blinking inventory rebalance counter. There is no hero image. The data is the visual.
Stats-First Scroll Architecture
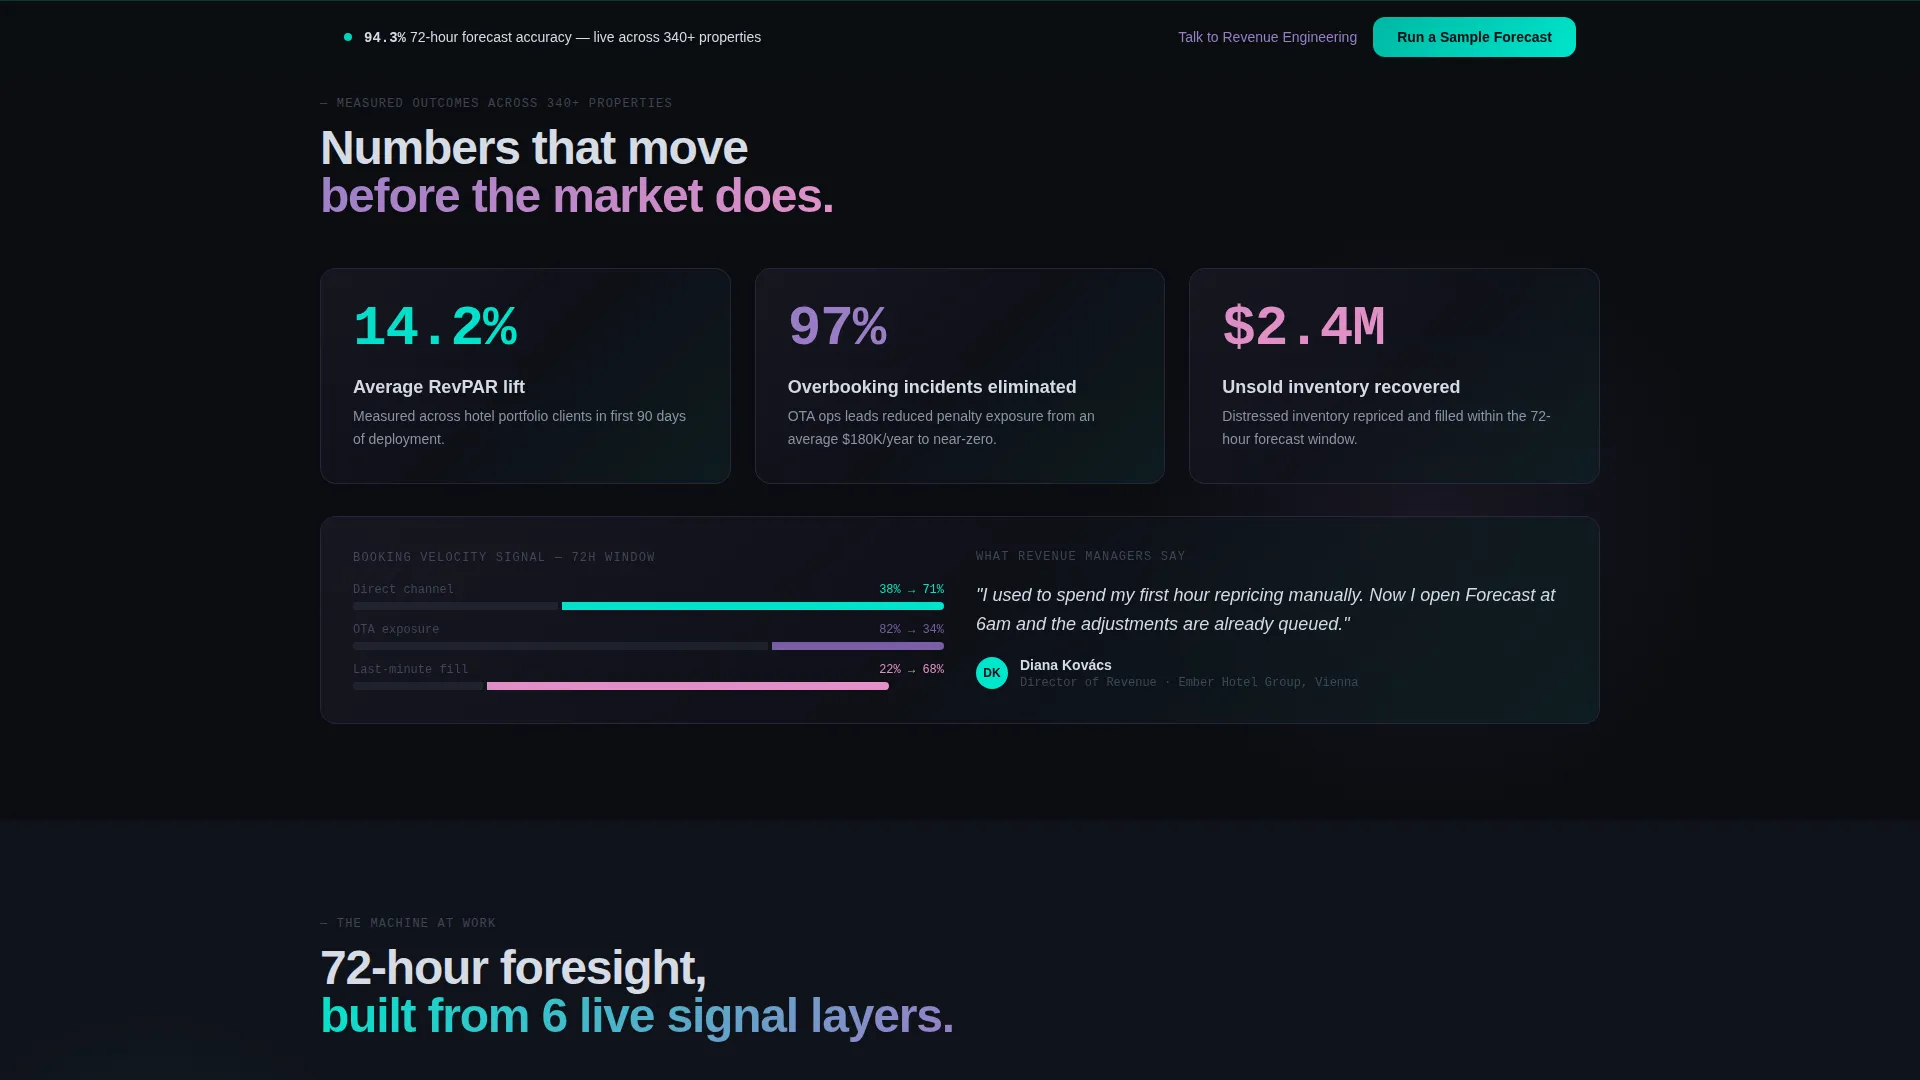
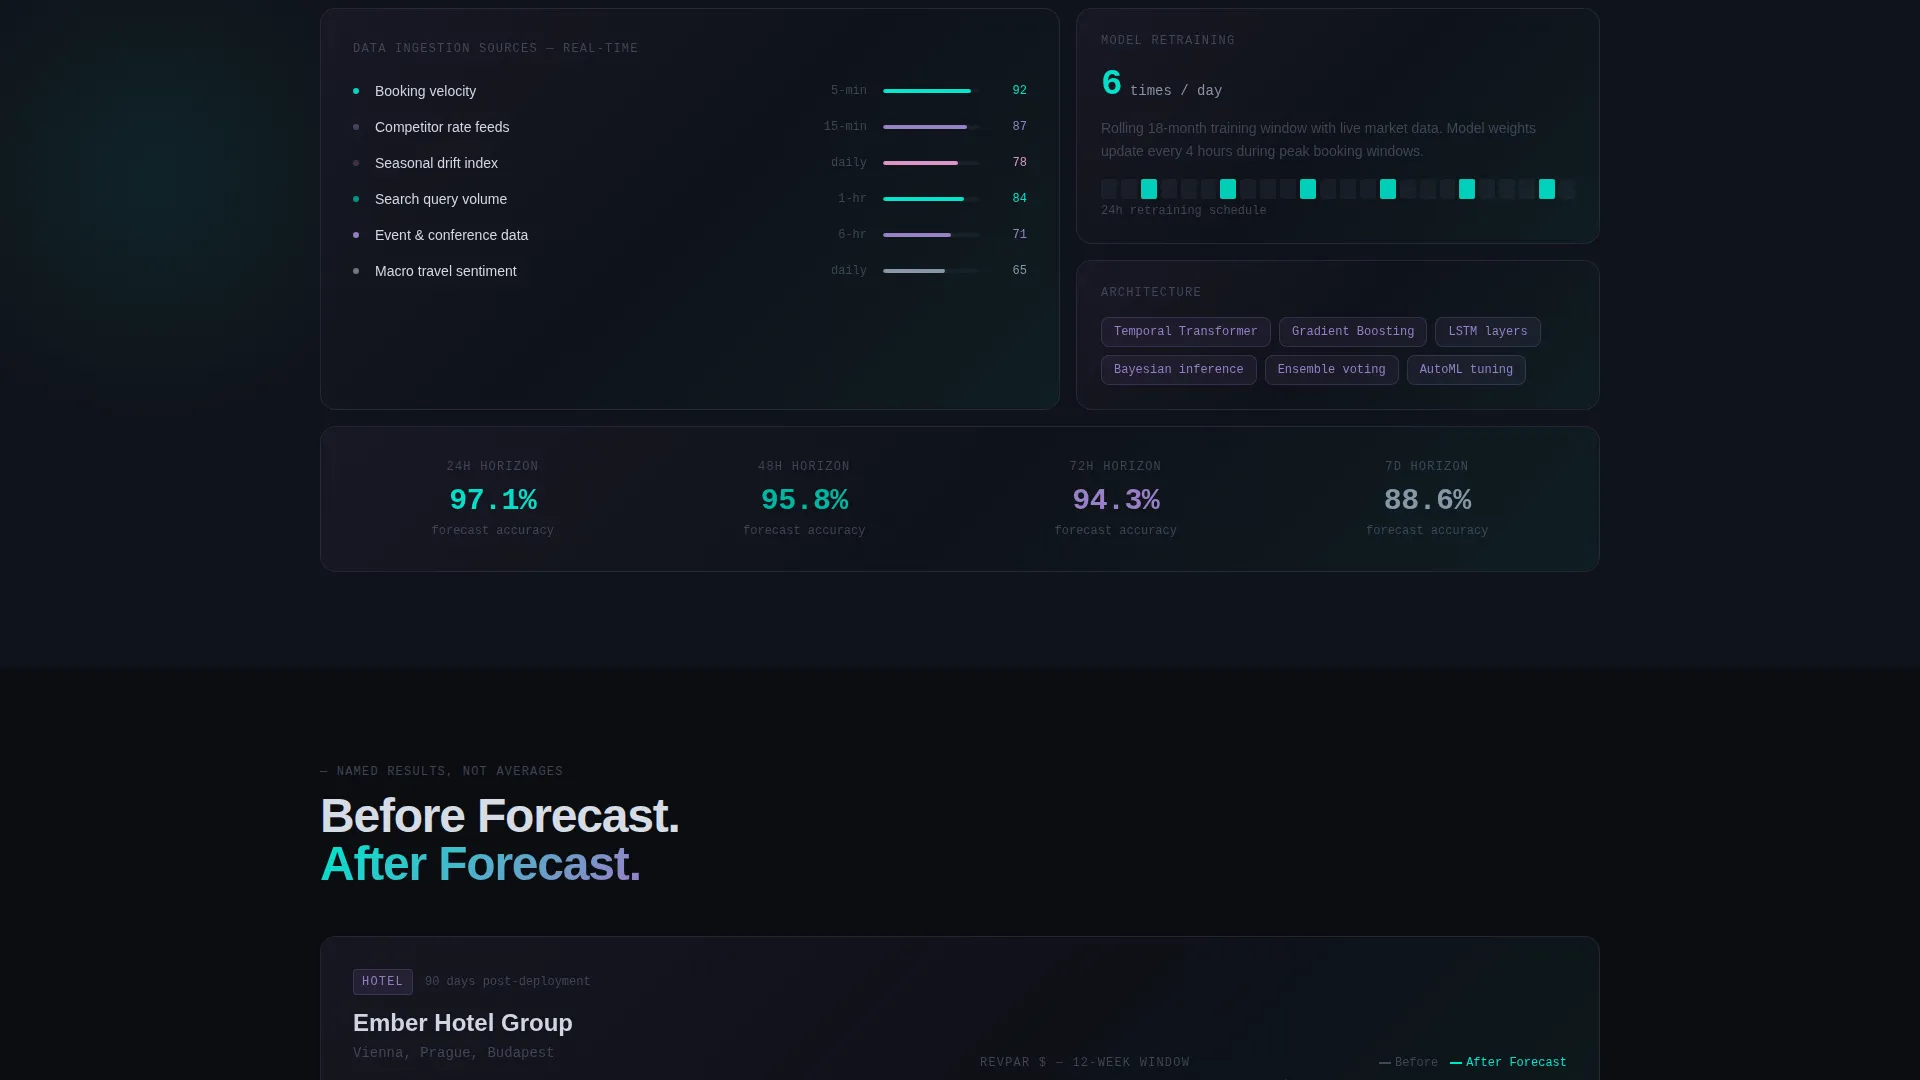
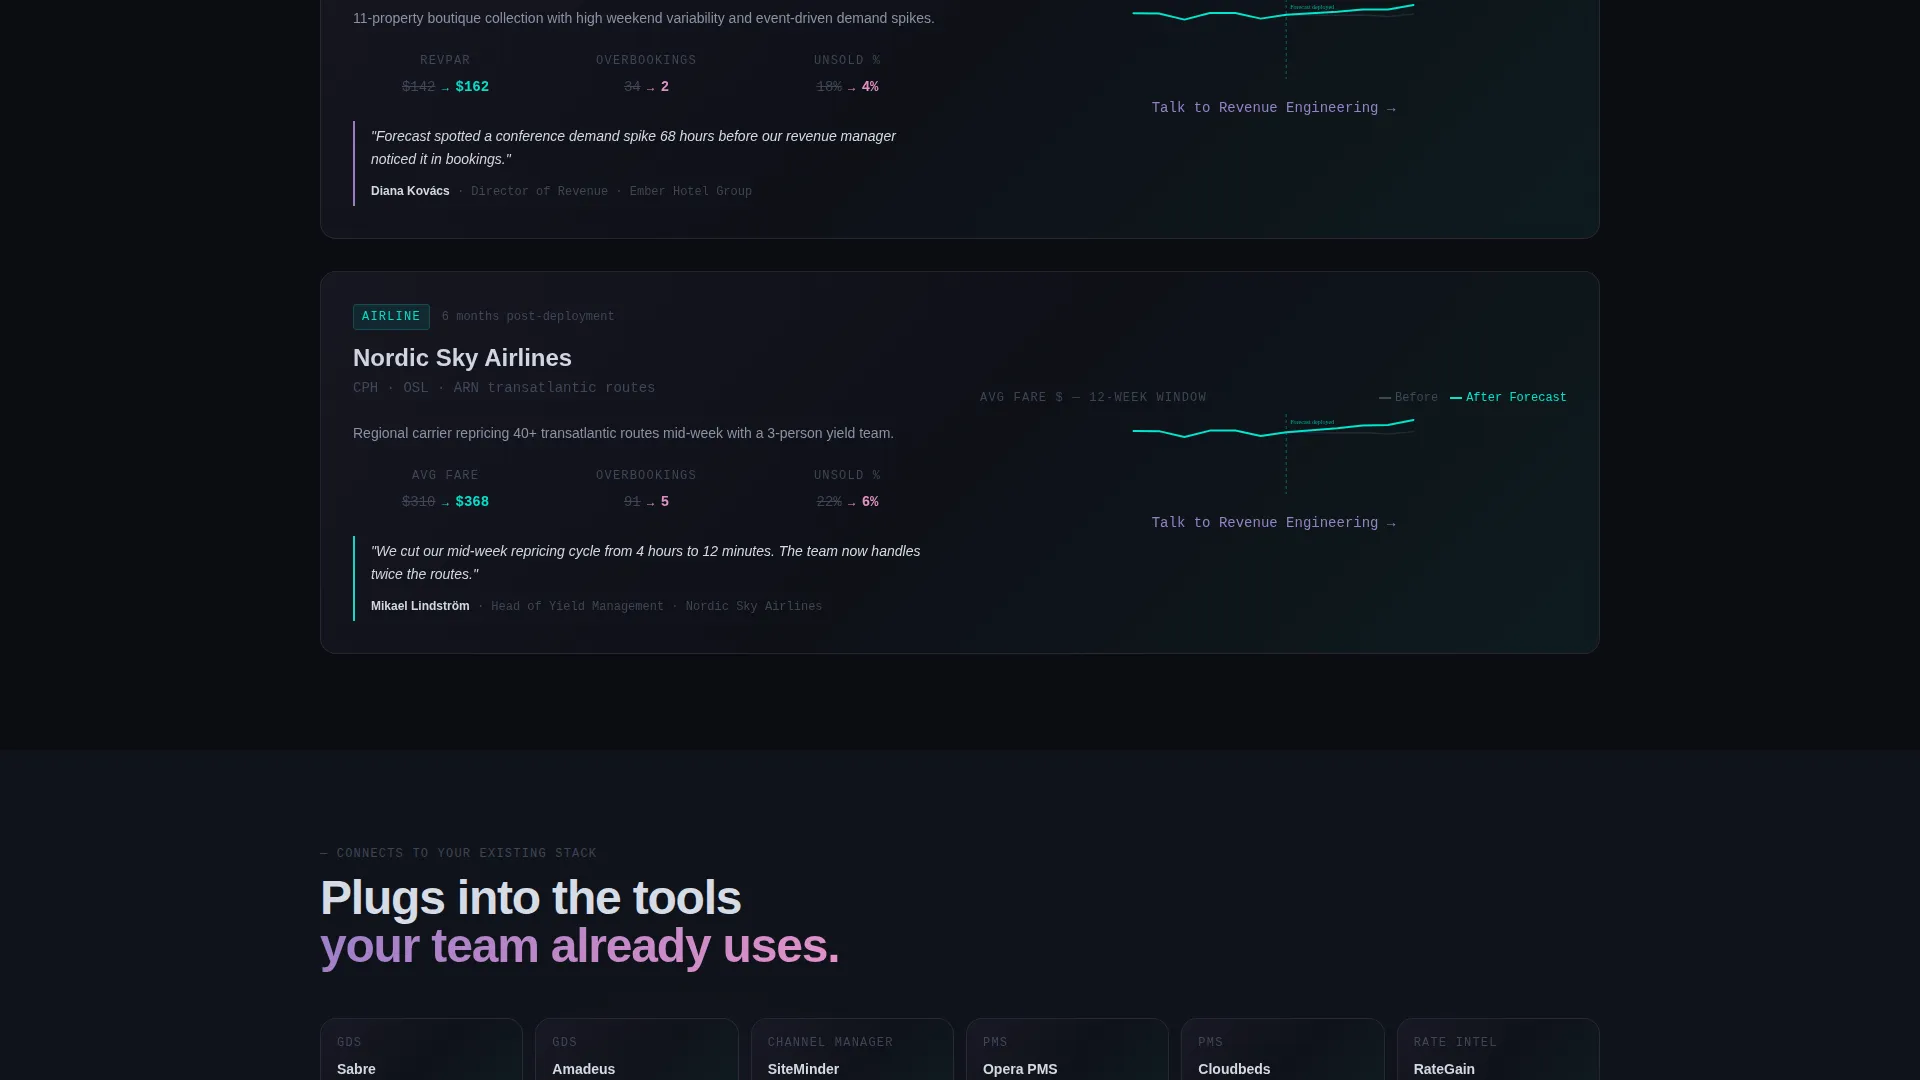
Each scroll row leads with a number or chart before any paragraph appears. The first row shows revenue outcomes, the second exposes the model at work, and the third delivers named case studies with before-and-after charts. This structure keeps analytical buyers engaged without asking them to read past claims to reach evidence.
Dual-Path Conversion System
The primary call-to-action, "Run a Sample Forecast," appears first inside the header grid as its own bento card with a pulsing cyan border, then again as a sticky bottom bar after the second scroll section. A secondary path, "Talk to Revenue Engineering," sits as a quieter violet-text link beneath each primary call to action for enterprise buyers.
Guided Demo Click-Through Flow
Clicking the primary call to action routes visitors to a guided demo environment. The visitor selects their property type, inputs a sample date range, and watches a simulated forecast render in real time. This lets the platform show results before asking for any commitment.
Micro-Interaction System
Cards tilt slightly on hover. Charts animate as they enter the viewport on scroll. KPI counters tick upward as they come into view. These interactions reinforce the sense of a live command environment without requiring video or heavy media assets.
AI Iridescent Color System
The palette uses void black as the base, with holographic violet and signal cyan dividing between chart accents and KPI highlights. Faint aurora pink appears only on hover states and active data pulses. Text stays in cool silver-white. No color is decorative. Every hue carries informational weight.
Page sections overview
| Section | Purpose |
|---|---|
| Dark Glass Header | Display live-style KPI cards and primary call to action above the fold |
| Outcomes Row | Lead with revenue lifted, overbookings eliminated, unsold inventory recovered |
| Model Mechanics Row | Show data ingestion sources, model architecture, and retraining cadence |
| Proof and Partners Row | Present named case studies, before-and-after charts, and integration logos |
| Sticky call to action Bar | Persist the primary forecast demo action after the second scroll section |
Design & branding system
The visual identity follows a Data Command theme. Every design decision reinforces the feeling of sitting in a dim control room at dawn, where numbers move before the market does.
- Color palette: void black (#0B0D11) as the background, holographic violet (#7B5EA7) for chart accents, signal cyan (#00E5CC) for KPI highlights, aurora pink (#E491C8) reserved for hover and pulse states, and cool silver-white (#D6DCE5) for all body text
- Iridescent bento card borders shift from violet to cyan as the eye moves across the grid, giving the layout depth without adding imagery
- Typography stays in silver-white and never competes with the data figures; the single headline, "See demand before it books," floats above the grid in restraint
Mobile & speed optimization
The bento grid layout is designed to reflow across screen sizes without losing the command-room atmosphere. Frosted-glass panel depth and border shifts are handled through CSS-level effects that keep the visual fidelity intact on smaller viewports.
- Micro-interactions such as card tilt and counter animations are lightweight and scroll-triggered, avoiding autoplay overhead
- The sticky call to action bar adapts to mobile bottom navigation patterns, keeping the primary conversion action reachable without scrolling back to the top
How this template helps you convert
This template is designed as a click-through page. It earns the demo click by showing proof first and asking for action second.
- Visitors land on a header wall of moving data cards that immediately communicate precision and authority, building trust before any sales copy appears
- Each scroll row adds a new layer of evidence, so by the time the sticky call to action bar appears, the visitor has already encountered six or more proof points and interacted with the live-feeling interface
Other information about this template
Forecast is categorized under the Technology and AI for Travel intersection. It is built specifically for the travel AI inventory forecasting niche, where buyers are analytically trained and skeptical of marketing-first layouts. The template style is Bento Grid, the theme is Data Command, and the creative direction is Stats-First Impact with a Click-Through landing page flow and a Dark Glass Panels header concept.
- This template works well for platforms that connect to property management systems or global distribution systems, as the proof row includes space for integration partner logos
- The guided demo flow is designed to support property types including hotels, airlines, and online travel agencies, matching the three primary buyer personas built into the page
- Teams building on this template can adapt the case study cards in the proof row to feature their own before-and-after RevPAR data and named client references
Theme
Data Command
Creative direction
Stats-First Impact
Color system
AI Iridescent
Style
Bento Grid
Direction
Click-Through
Page Sections
Bento Grid Header with Dark Glass Panels
Stats-first Scroll Architecture
Dual-path Conversion System
Guided Demo Click-through Flow
Scroll-triggered Micro-interactions
AI Iridescent Color System
Related questions
Who is the primary audience for this template?
Can I replace the sample stats and charts with my own data?
What does the guided demo click-through flow look like?
Is this template suitable for a SaaS product launch in the travel sector?
How does the two-path call to action system work?



