Graph - Electric Database Landing Page Template
Graph is a scroll-reveal landing page template built for graph database platforms. It opens with a live query-speed estimator, then guides visitors through an interactive fraud-detection traversal, a Cypher query sandbox, and animated customer architecture maps. Every section loads as the visitor arrives, making the performance case personal before a single word is read.
by Rocket studio
Quick summary
Graph is a single-page, scroll-reveal landing page template designed for graph database platforms. It hooks visitors immediately with a personalized query-speed estimator, then walks them through interactive graph explorations that make the technology feel tangible. The template is built around one goal: turning curiosity into a free-cluster signup without a form on the page.
Who this template is for
This template is built for technical product teams that need to convince a skeptical, hands-on audience. If your buyers need to experience the product before they believe the pitch, this layout is designed for exactly that.
- Backend engineers and data scientists who evaluate tools by touching them first
- CTOs and technical decision-makers comparing graph databases against relational alternatives
- Developer-tool startups that need a landing page with depth, not just a hero section and a video
What problem this template solves
Most database landing pages describe performance with a benchmark table and a generic quote. That approach rarely moves a backend engineer. The real problem is that the gap between a 14-table JOIN and a native graph traversal is almost impossible to communicate in static copy.
- Visitors leave without understanding what a graph database actually does differently
- Generic calls to action like "Request a Demo" add friction for developers who want to explore first
- Static screenshots cannot show a query returning connected meaning instead of flat rows
What you get with this template
You get a fully structured, interaction-led landing page that lets your visitor's own numbers make the argument. The template layers four distinct interactive sections, each loading progressively as the visitor scrolls.
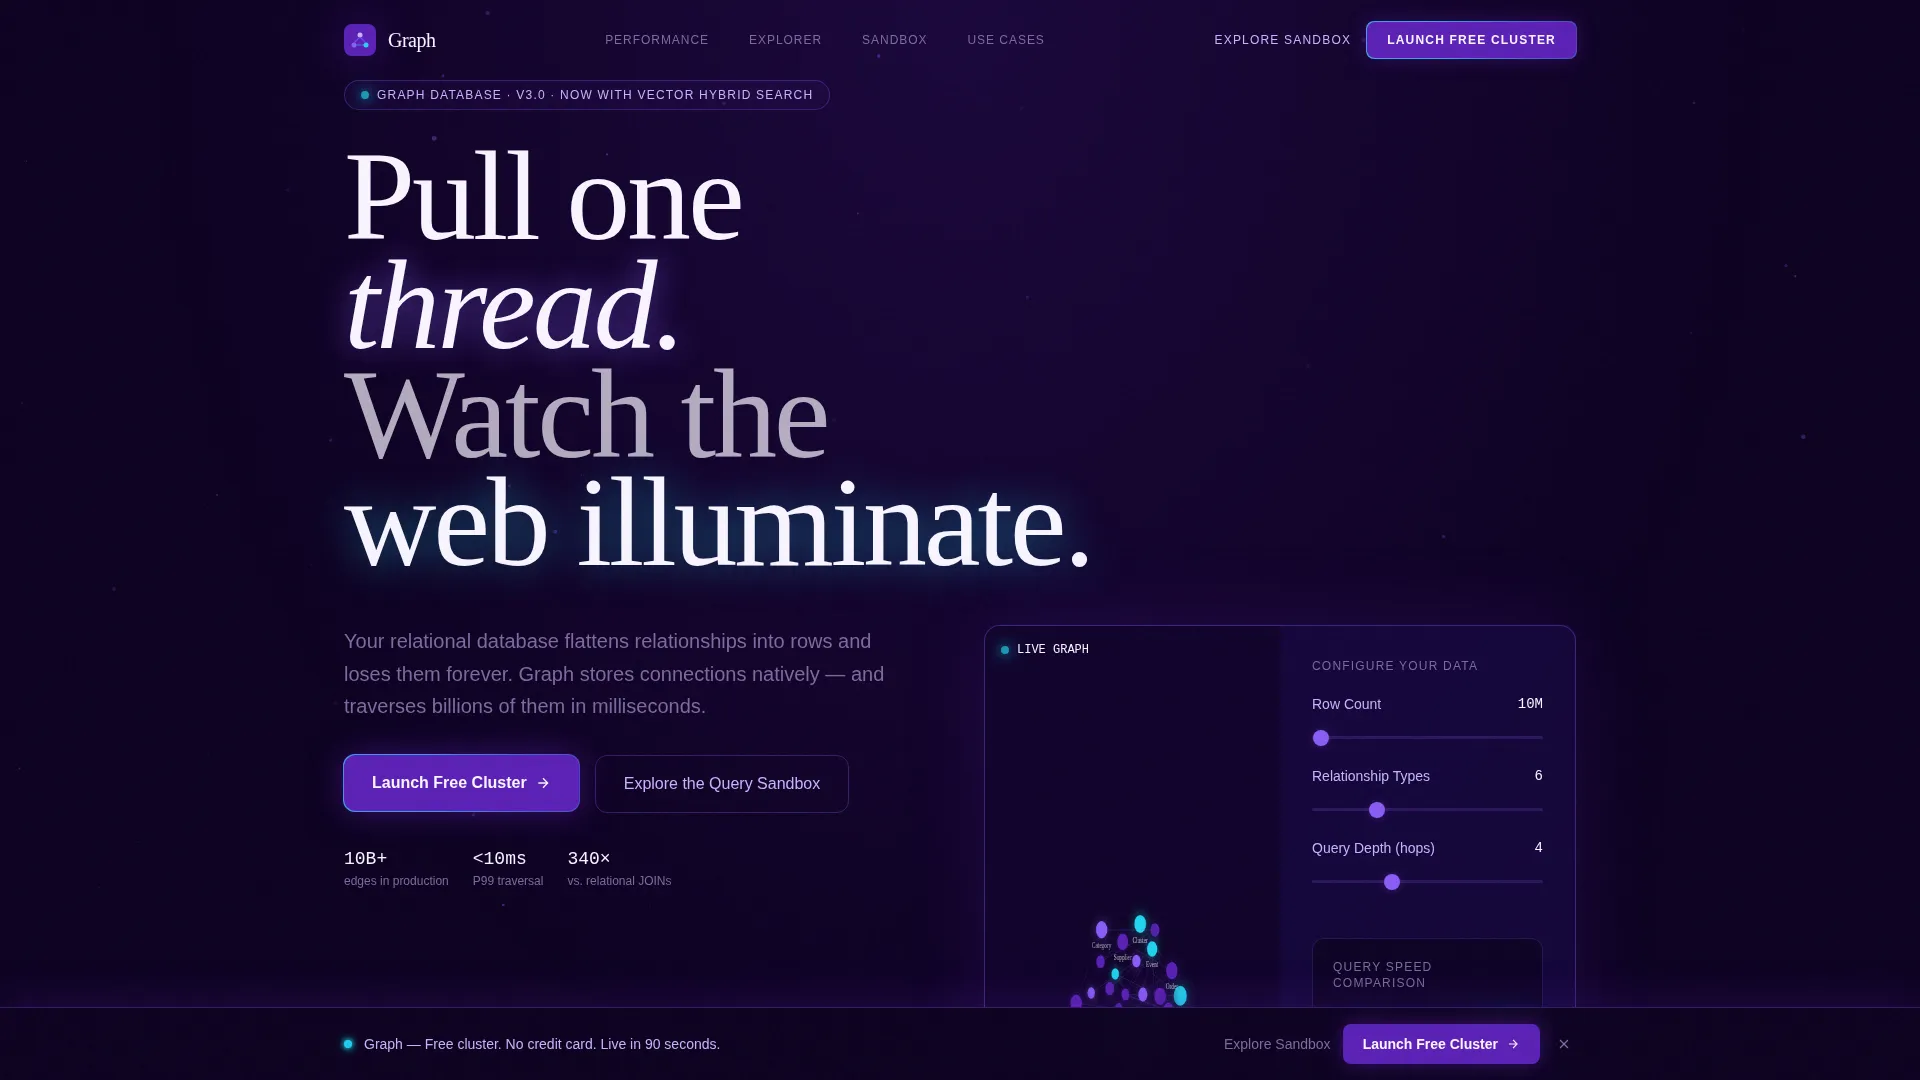
- A header estimator that calculates and visualizes query-speed comparisons using the visitor's own row count, relationship types, and query depth
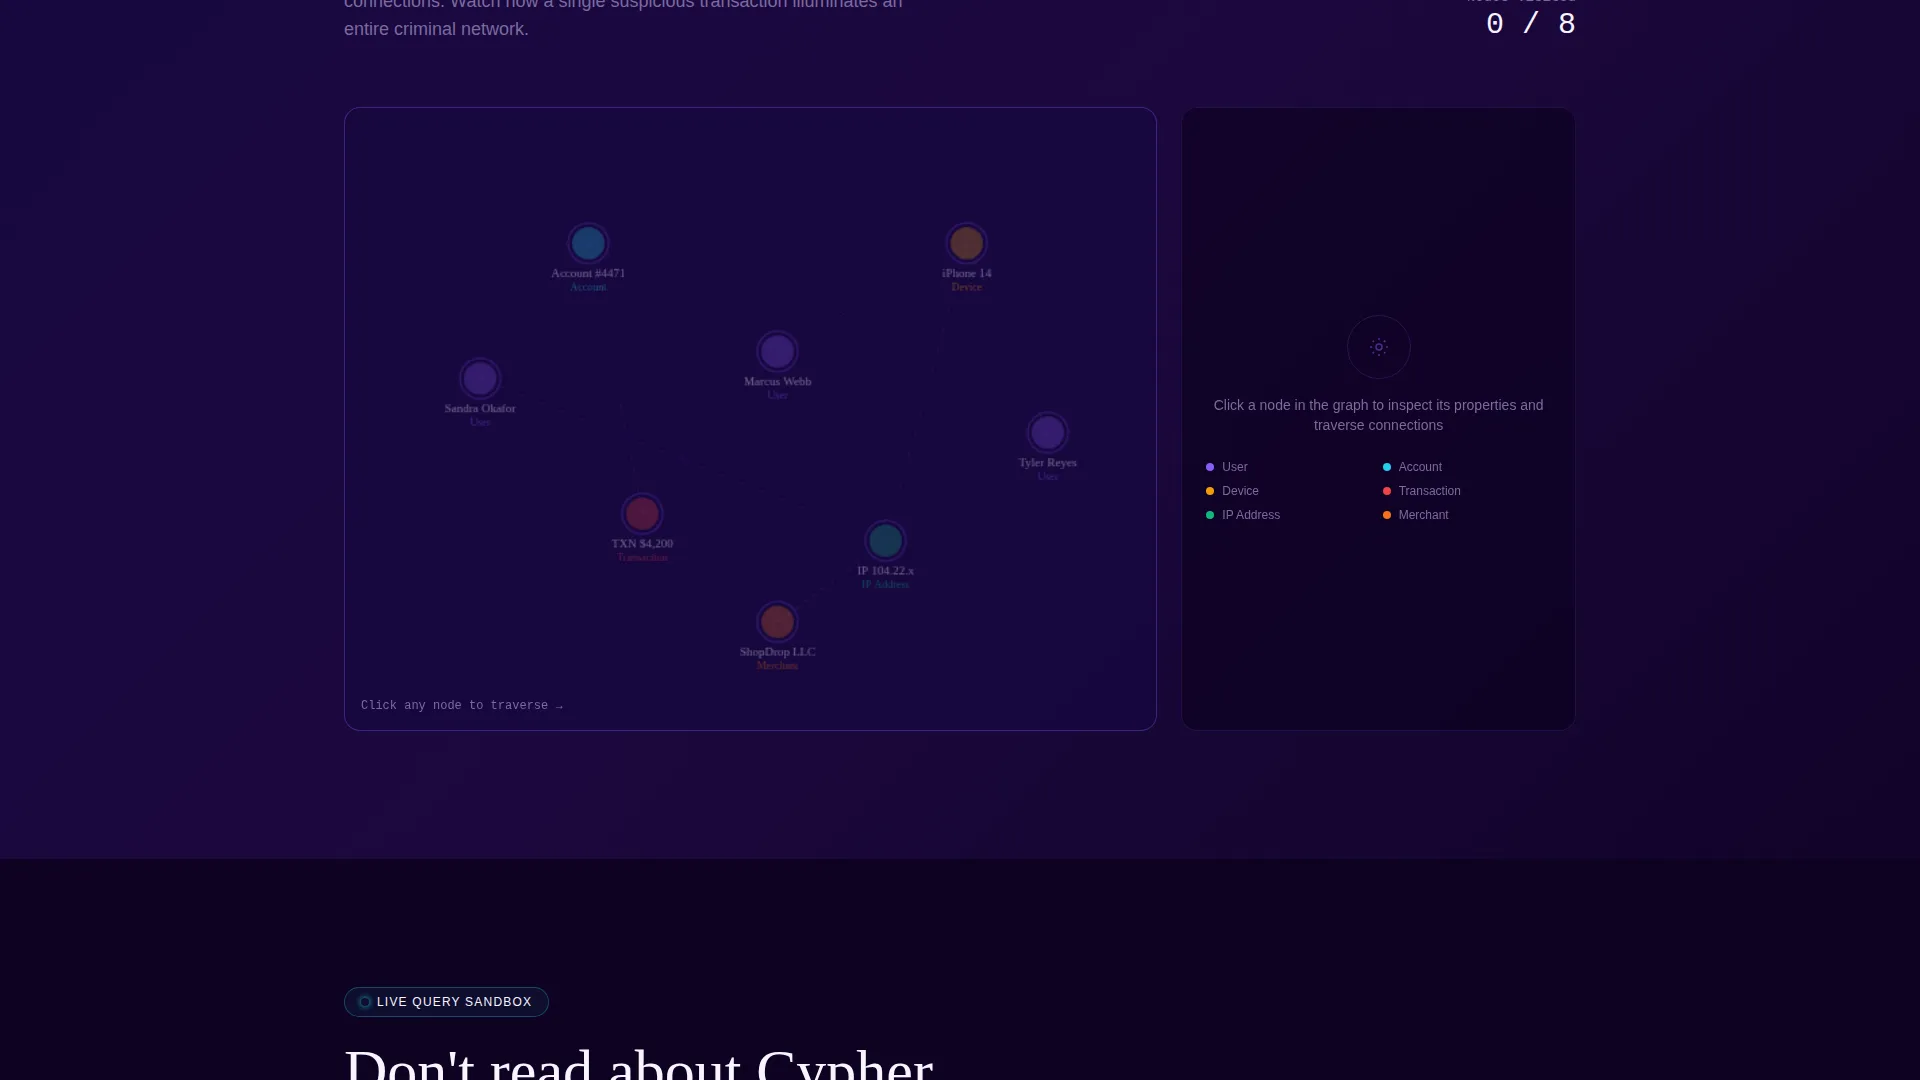
- A node-by-node fraud-detection traversal visualizer, a live Cypher query sandbox against a demo dataset, and interactive customer architecture maps rendered as constellation diagrams
- Two conversion paths: a primary "Launch Free Cluster" call to action and a secondary "Explore the Query Sandbox" anchor for visitors who need more proof
Feature list
This section describes the core interactive and structural features built into the template as specified in the source brief.
Live Query-Speed Estimator Header
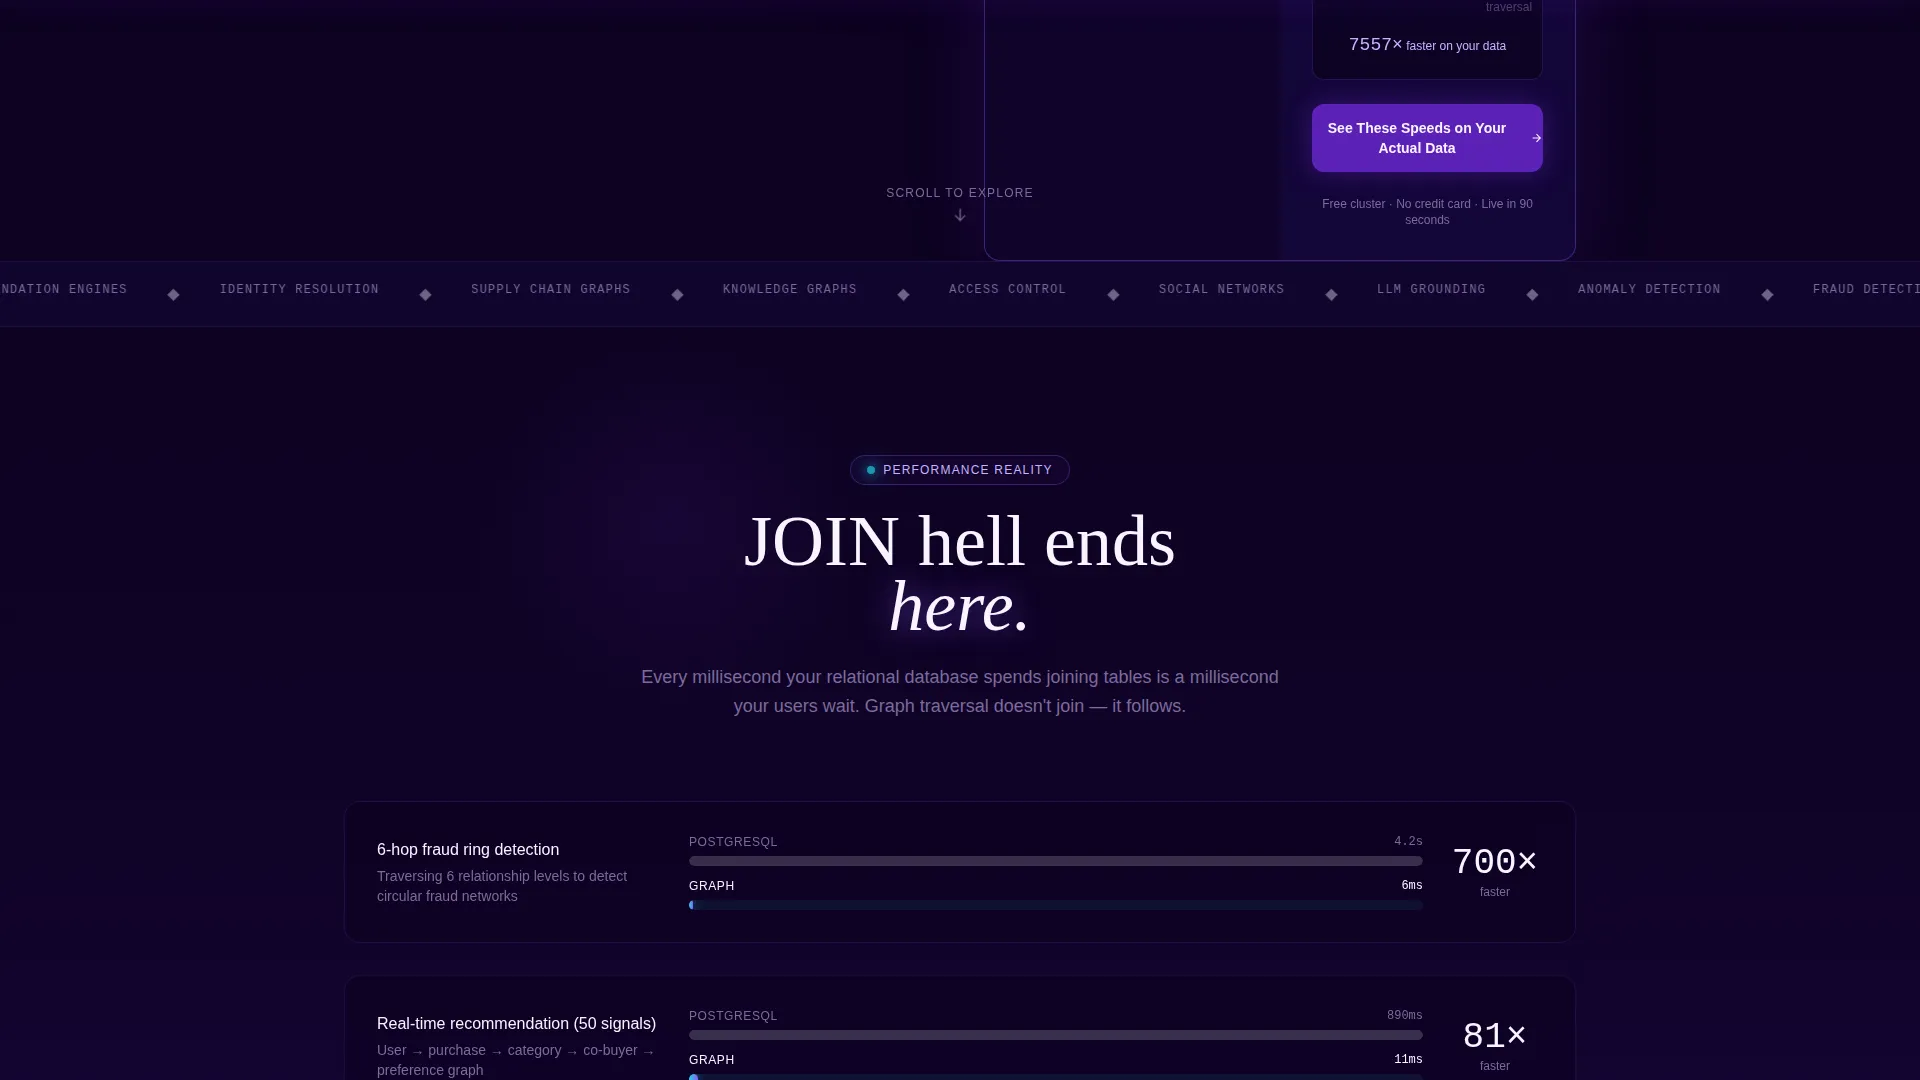
The page opens with a calculator that accepts the visitor's current row count, number of relationship types, and average query depth. It instantly renders a spinning force-directed graph and outputs a direct speed comparison, for example showing that a 14-table JOIN taking 4.2 seconds in a relational database completes in 6 milliseconds in a graph system. The graph animation updates in real time as sliders move.
Progressive Scroll-Reveal Sections
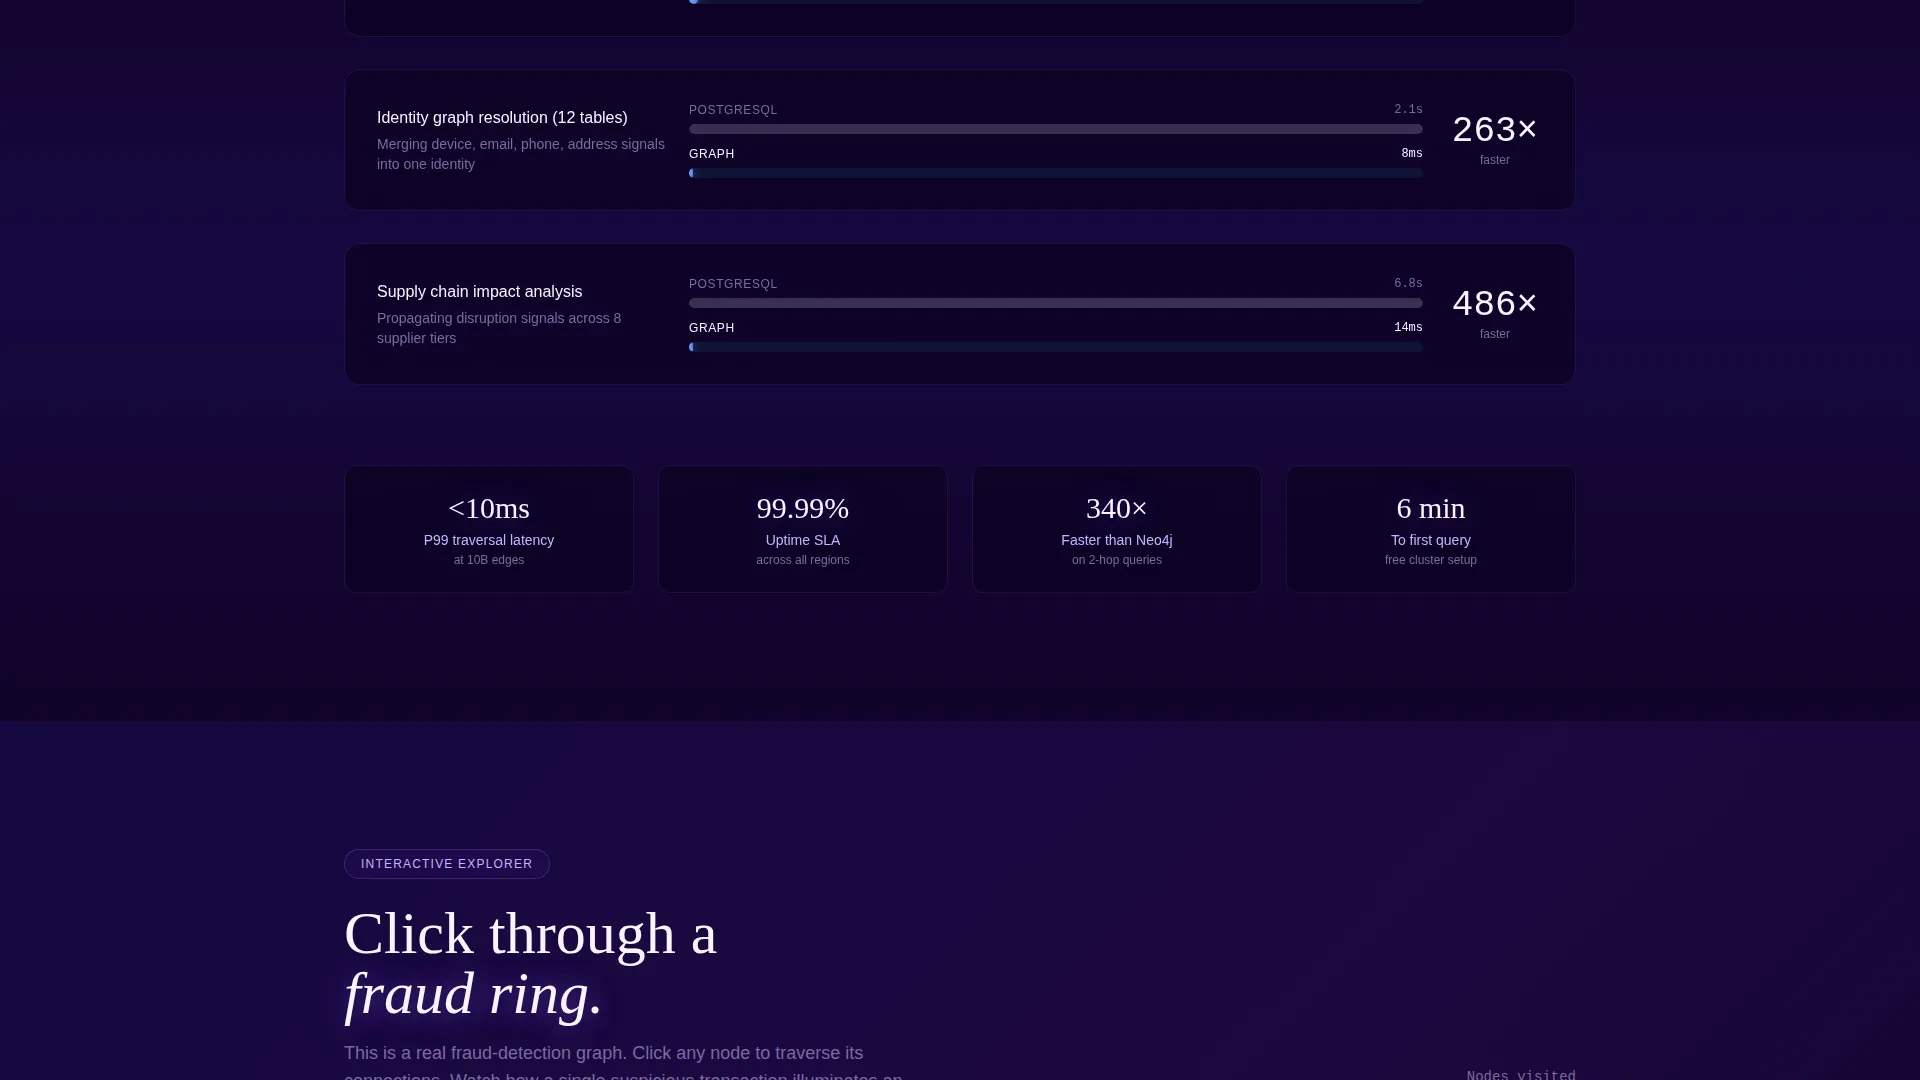
Every section loads only when the visitor reaches it. Nodes bloom from a dark background, edges draw themselves across the canvas, and numbers count upward as each section enters the viewport. This approach keeps the page feeling alive and paced rather than overwhelming.
Interactive Fraud-Detection Traversal
Visitors can click node by node through a sample fraud-detection graph. This section turns an abstract concept into a hands-on exploration, letting visitors trace relationships across a real-looking dataset without needing to write a single query.
Live Cypher Query Sandbox
A built-in query sandbox lets visitors run Cypher queries against a demo dataset and see real results returned on screen. This is the deepest proof point on the page and serves visitors who need direct technical contact before committing to a signup.
Interactive Customer Architecture Maps
Customer use cases are rendered as interactive constellation maps rather than static case-study cards. Visitors can engage with the architecture diagrams directly, reinforcing credibility through exploration rather than reading.
Persistent Bottom-Bar Call to Action
After the visitor passes the second section, a persistent bottom bar appears carrying the primary "Launch Free Cluster" call to action. This keeps the conversion path visible throughout the rest of the scroll without interrupting the interactive sections.
Page sections overview
| Section | Purpose |
|---|---|
| Header Estimator | Personalize query-speed proof using visitor-supplied data |
| Traversal Visualizer | Let visitors explore a fraud-detection graph node by node |
| Cypher Query Sandbox | Run live queries against a demo dataset |
| Architecture Maps | Display customer use cases as interactive constellation diagrams |
| Persistent call to action Bar | Keep the primary signup path visible after section two |
Design & branding system
The visual identity is built around an Electric Indigo color system that channels the feeling of a live terminal at 2 AM. Deep void black dominates the canvas, electric indigo washes across section transitions, and hot node violet marks interactive elements like buttons and graph nodes.
- Reactive cyan fires exclusively on hover states and live data pulses, functioning as a reward color the visitor earns through interaction
- Black, indigo, and violet carry the structural weight of the layout, keeping the page dark and focused
- The overall aesthetic communicates technical seriousness without the sterility of a typical developer-tool page
Mobile & speed optimization
The template is built with a progressive-loading approach that defers each interactive section until the visitor reaches it. This keeps initial load fast while preserving the full interactive experience for visitors who scroll through.
- Each section loads its nodes, edges, and animations only on scroll entry, reducing upfront rendering overhead
- The force-directed graph in the header responds to slider input in real time, designed to remain responsive across viewport sizes
How this template helps you convert
The template does not rely on persuasive copy alone. It builds a personal, evidence-based case for each visitor using their own inputs and interactive exploration.
- The header estimator makes the first conversion moment contextual: after seeing their own query-speed comparison, visitors see a "Launch Free Cluster" prompt framed as a natural next step to test these speeds on their actual data.
- The secondary "Explore the Query Sandbox" anchor gives technically cautious visitors a lower-commitment path, keeping them engaged and moving them deeper into the page before the primary call to action reappears.
Other information about this template
This template fits within the Startup Velocity theme family, which pairs high-energy visual systems with interaction-forward layouts. It is designed for teams building in the graph database technology space and can support positioning for graph database platforms, graph analytics products, and connected-data infrastructure tools.
- The template follows a click-through landing page direction, meaning no form appears on the page itself and all signup friction is deferred to a dedicated flow after the click
- The Interactive Explorer creative direction means the page is structured as a sequence of playgrounds rather than a sequence of marketing claims
- The scroll-reveal template style ensures sections animate into view progressively, which reinforces the product narrative of data connections emerging from darkness
Theme
Startup Velocity
Creative direction
Interactive Explorer
Color system
Electric Indigo
Style
Scroll Reveal (Progressive)
Direction
Click-Through
Page Sections
Live Query-speed Estimator
Node-by-node Traversal Visualizer
Live Cypher Query Sandbox
Progressive Scroll-reveal Animations
Interactive Architecture Constellation Maps
Persistent Conversion Bottom Bar
Related questions
Do I need real data connected to launch this template?
Can I update the color system to match my brand?
Is there a form on this landing page?
Who is this landing page template designed for?
How many conversion paths does the template include?



