Smart Early Learning Landing Page Template
Pipeline is a modular, card-grid landing page template built for DataOps open source projects. It combines a Dark Glass Panels header, an interactive Pipeline Health Estimator, and integration cards into a cohesive lead-generation experience. Designed for analytics engineers and platform teams, the template turns raw pipeline reliability data into a confident, conversion-ready story.
by Rocket studio
Quick summary
Pipeline is a single-page, card-grid landing page template built for DataOps open source projects. It opens with live-styled health metrics behind frosted glass panels, leads directly into an interactive estimator tool, and cascades through integration cards, architecture schematics, and testimonials. Every section is engineered to turn a visitor's pipeline anxiety into a qualified lead.
Who this template is for
This template is designed for teams who live inside data infrastructure and need to earn trust quickly. It speaks directly to the people who feel the cost of a broken pipeline before their VP does.
- Analytics engineers managing complex dependency graphs across large model libraries
- Platform teams responsible for orchestrating multi-tool data stacks day to day
- Data leads who need to demonstrate pipeline reliability to non-technical stakeholders
What problem this template solves
Data infrastructure projects often lack a front door that matches their technical depth. A raw documentation site or a generic product page fails to communicate the real cost of schema drift, stale models, or zombie jobs to the people who approve budgets or evaluate tools.
- Visitors cannot quickly quantify the value of the tool without hands-on experience
- Integration support and architecture clarity are buried in documentation rather than showcased up front
- There is no clear conversion path that captures both technical evaluators and decision-makers
What you get with this template
You get a fully structured landing page that places the tool's value front and center from the very first scroll. The layout is modular, so each card-grid row can be adapted without rebuilding the page from scratch.
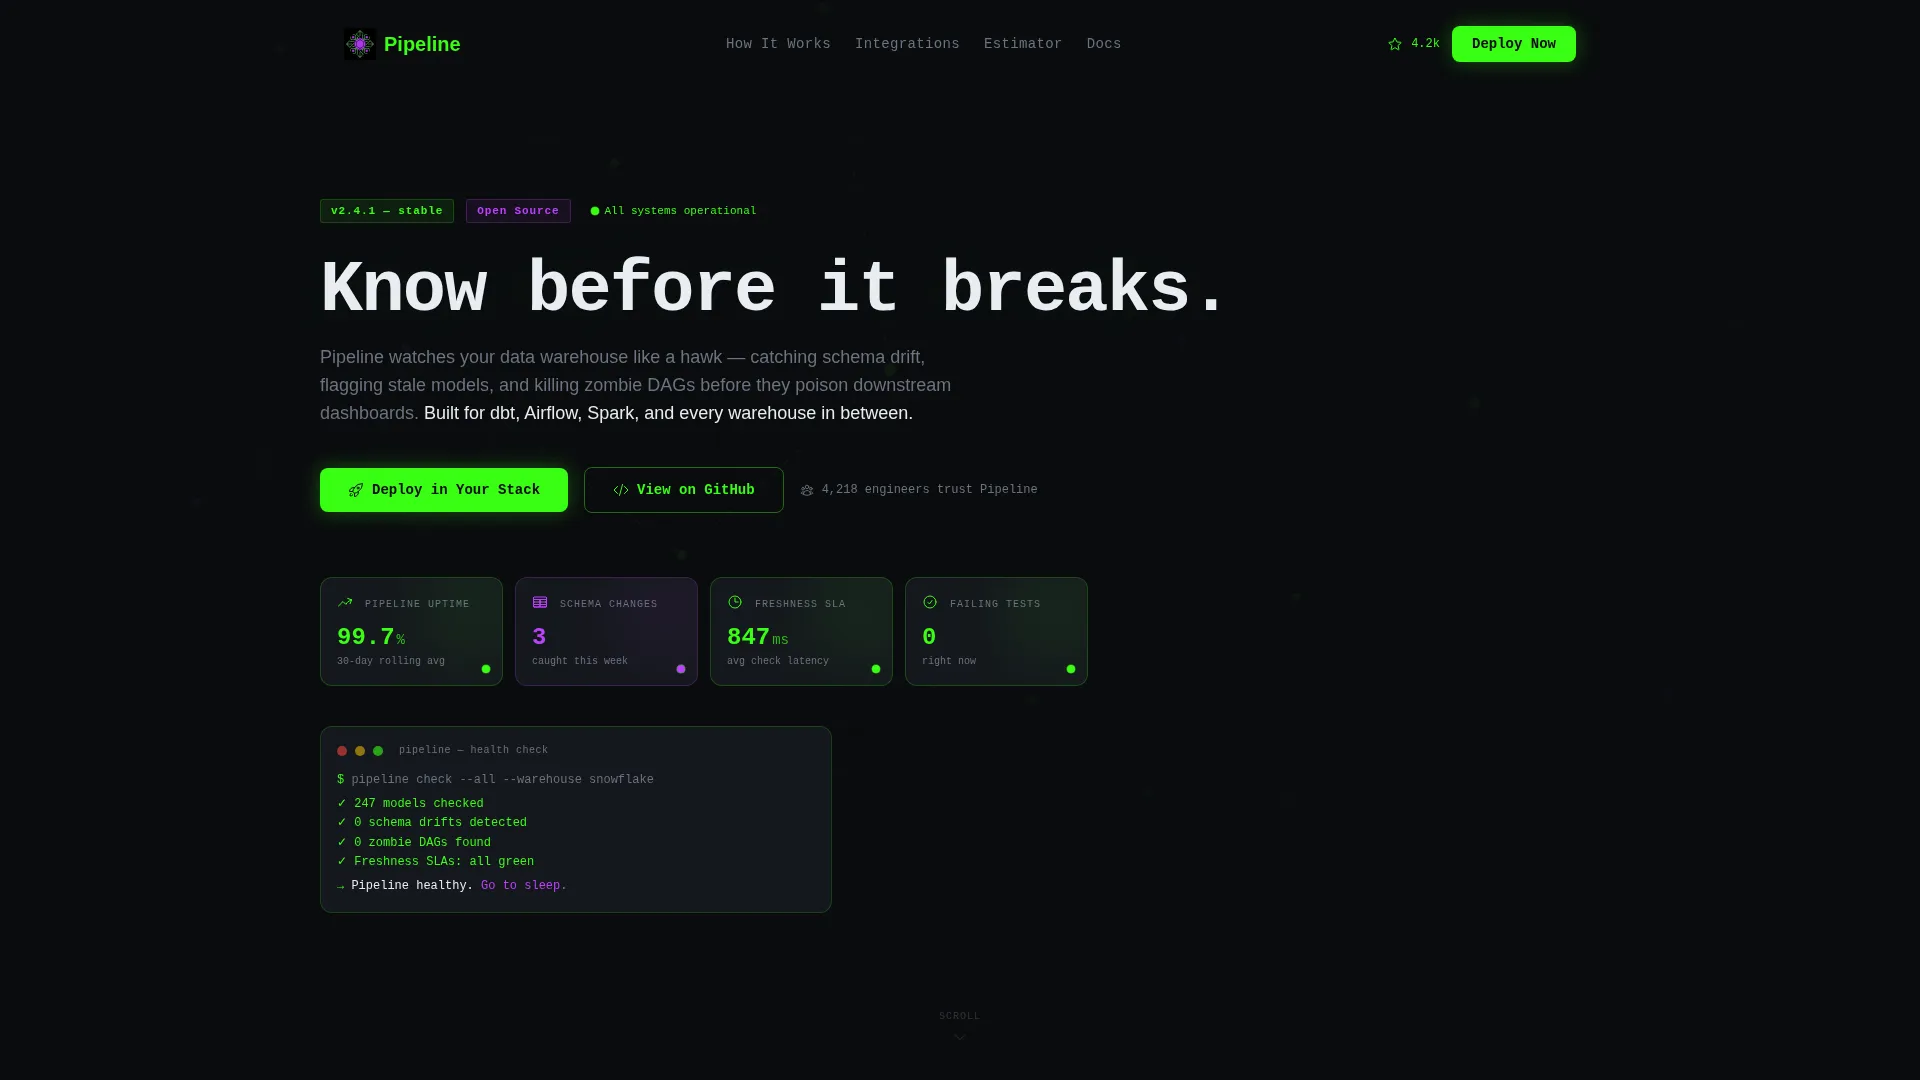
- A Dark Glass Panels header displaying live-styled pipeline health metrics with a typing monospaced headline
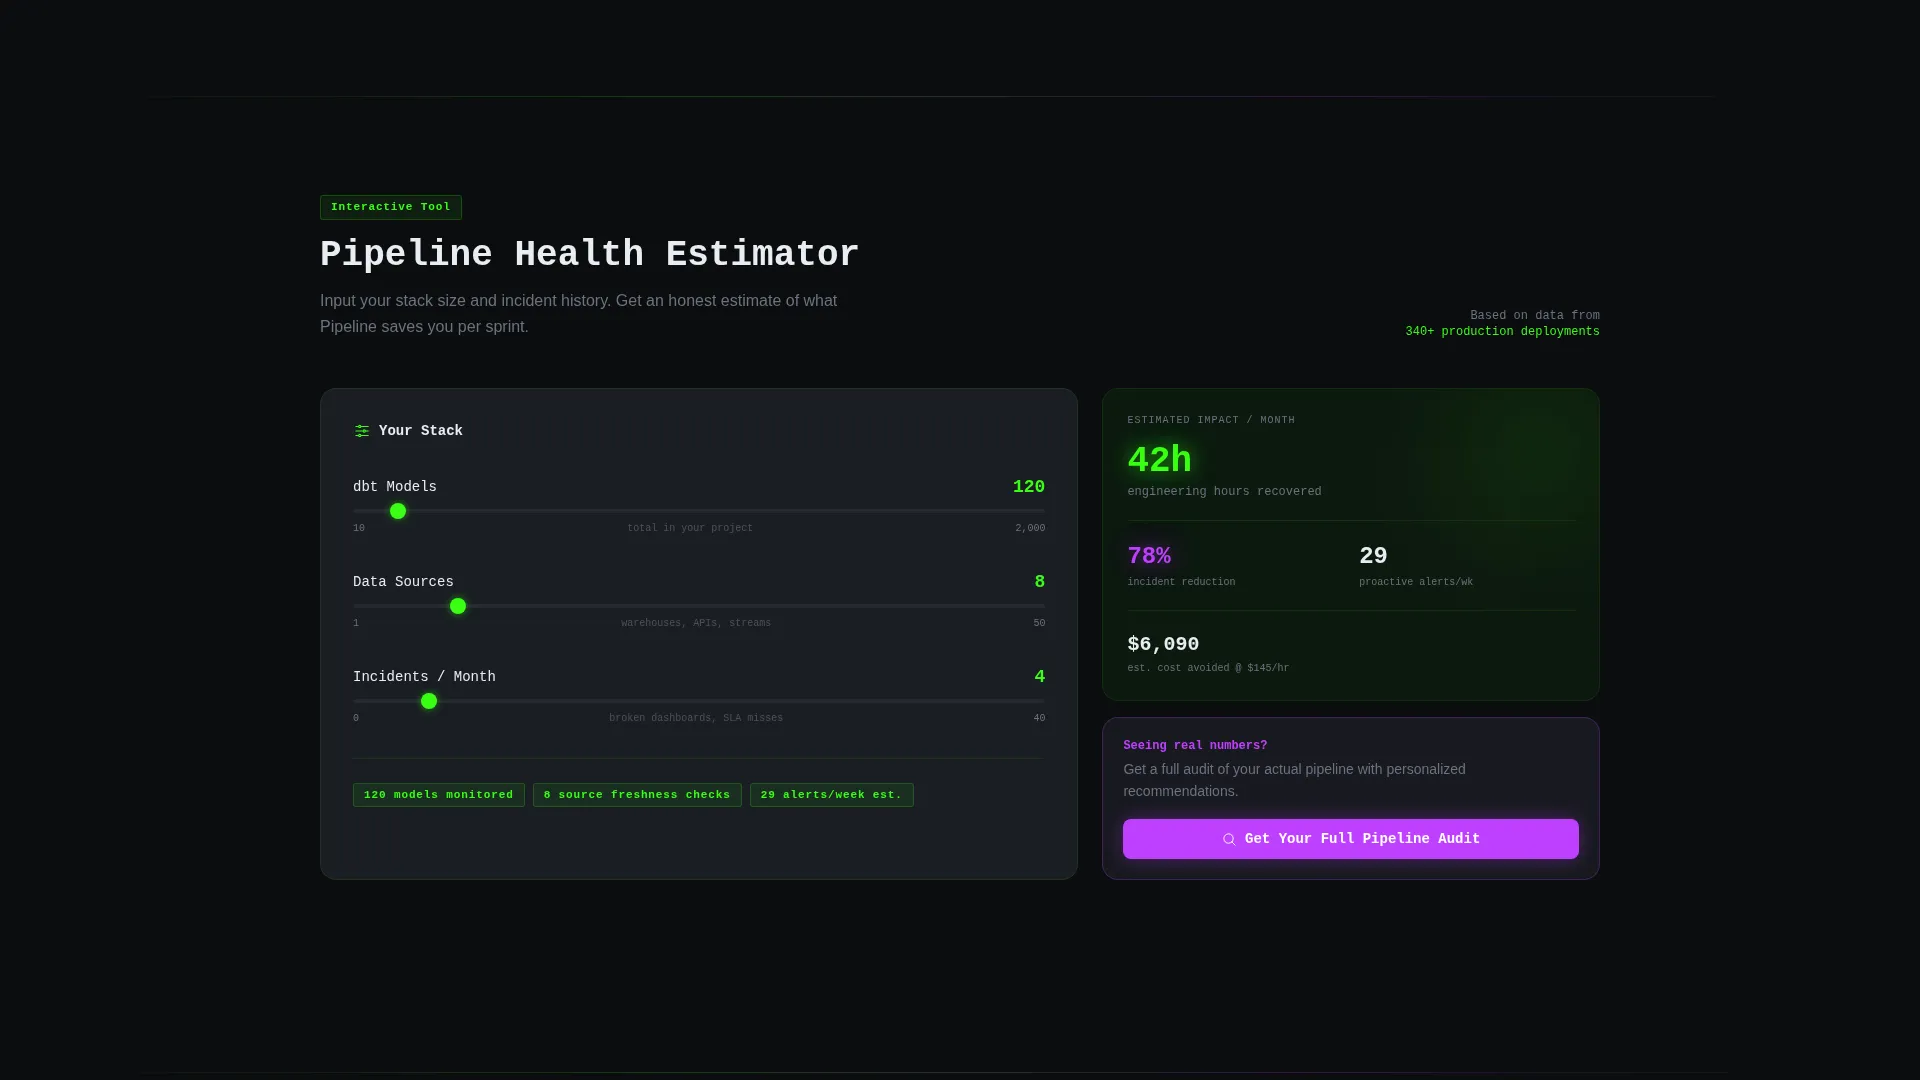
- An interactive Pipeline Health Estimator that returns estimated hours saved and incident reduction on user input
- Integration cards, contributor stats, architecture schematics, and testimonial cards arranged in an escalating grid
Feature list
This template packages several purpose-built components into one cohesive layout. Each feature is grounded in the creative and structural brief for this project.
Dark Glass Panel Header
The header row uses frosted, semi-transparent cards with a subtle depth blur effect. Each panel displays a live-styled metric: pipeline uptime, schema change count, freshness service-level agreement timer, and a failing-test counter at zero. A faint node-graph topology drifts behind the glass, and a monospaced headline types itself onto the screen.
Interactive Pipeline Health Estimator
The estimator is the first interactive stop after the header. Visitors input their number of models, data sources, and current incident frequency. The tool instantly returns two outputs: estimated hours saved per sprint and an incident reduction percentage. A result panel includes an embedded call to action, converting quantified pain into a direct lead.
Modular Integration Card Grid
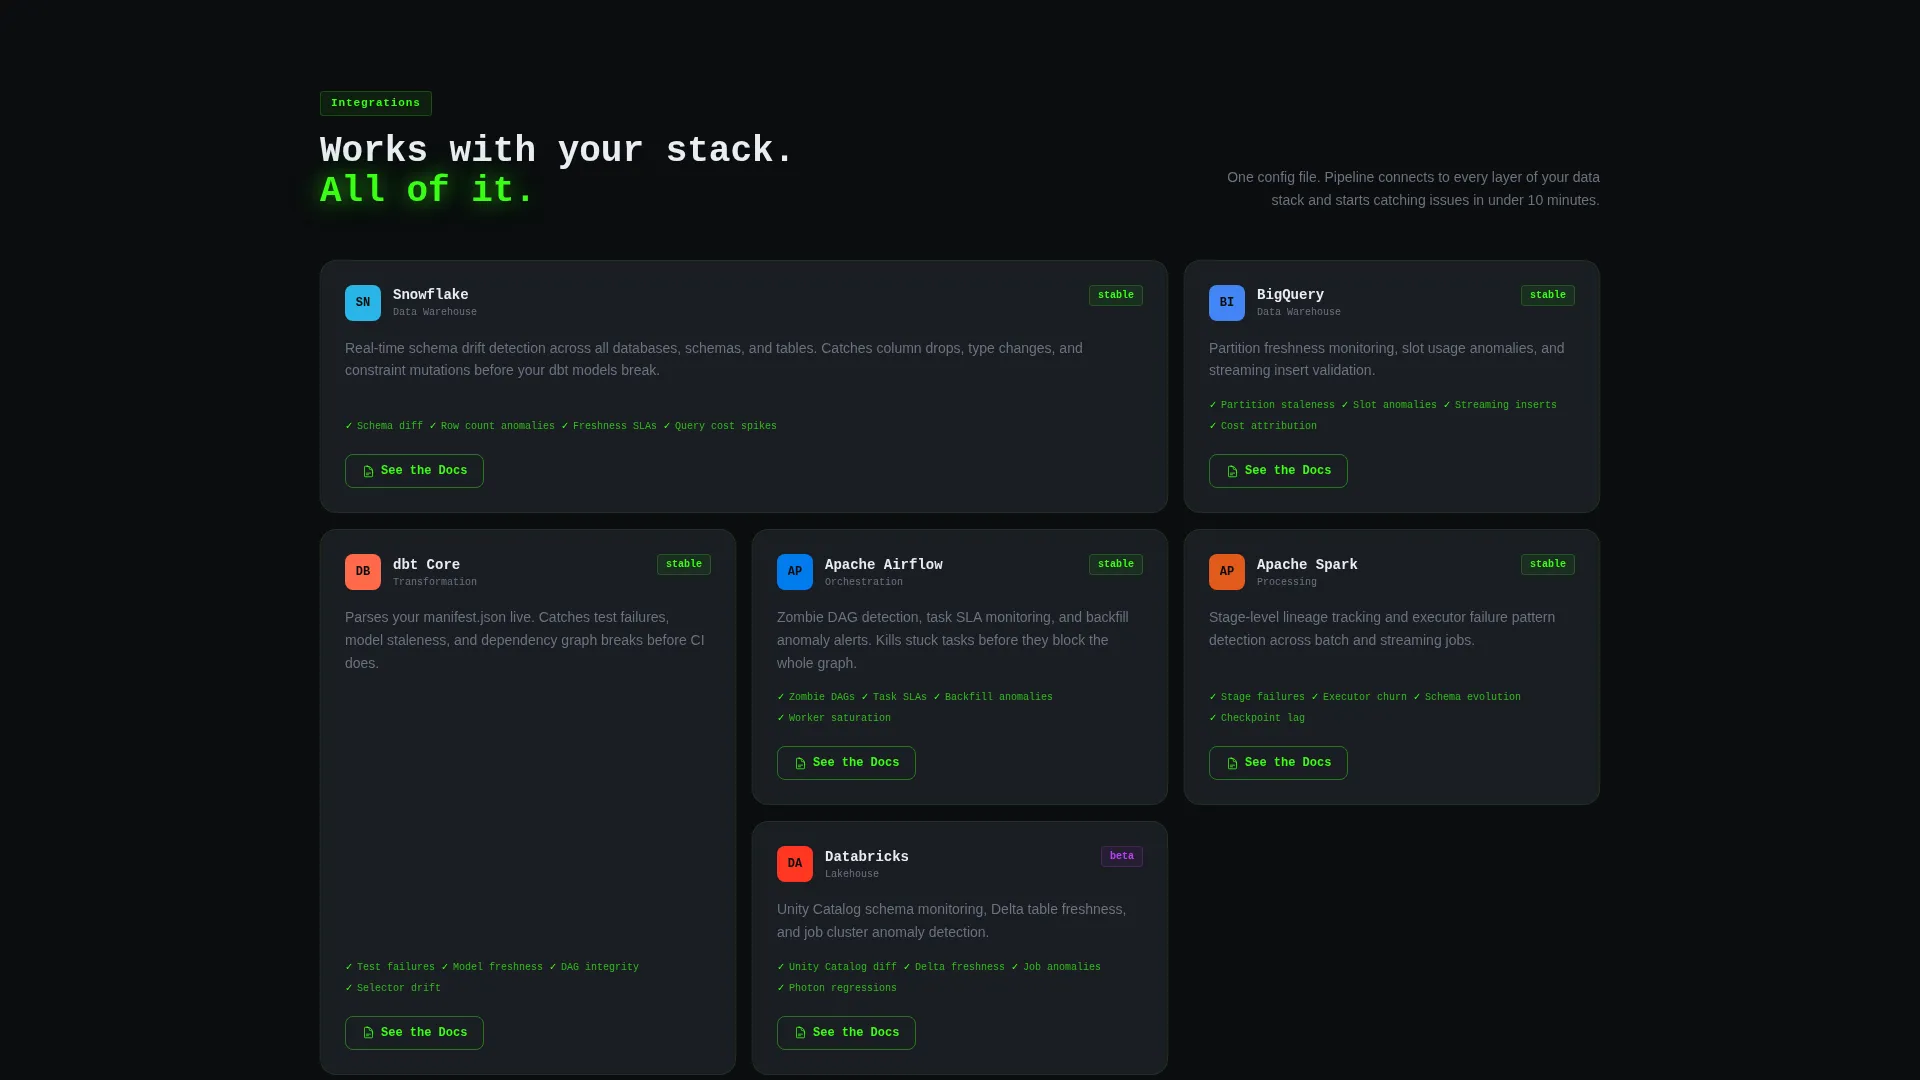
A structured card grid presents supported integrations in a scannable, visual format. Each card carries its own secondary call to action linking out to documentation. The grid is designed to grow without breaking the layout.
Escalating Content Grid
The card rows are sequenced intentionally. The grid moves from what the tool connects to, through what it catches, and finally to what it costs a team not to use it. This narrative arc keeps visitors moving down the page with increasing motivation.
Dual-Path Lead Generation
The primary call to action, labeled "Deploy in Your Stack," opens a slim form gated behind a cloud provider, warehouse type, and work email field. Every integration card carries a secondary "See the Docs" call to action routing to the project repository. Both paths capture intent at different levels of commitment.
Testimonial and Contributor Cards
Named engineer testimonials and live-styled contributor statistics from the project repository are displayed as dark-glass cards. These sections give the open source project social proof at scale without requiring a marketing team.
Page sections overview
| Section | Purpose |
|---|---|
| Glass Panel Header | Display live-styled health metrics and typed headline |
| Health Estimator Tool | Let visitors calculate hours saved and incident reduction |
| Integration Card Grid | Show supported data stack connections with doc links |
| Architecture Schematics | Render pipeline topology as dark-glass diagrams |
| Contributor Stats Row | Surface project activity and community credibility |
| Testimonial Cards | Provide named social proof from engineering teams |
| Primary call to action Form | Gate sandbox access behind a slim qualification form |
Design & branding system
The visual identity uses an Acid Digital color system that feels like a control room monitor bleeding neon into a dark environment. Every color choice serves a functional purpose in the interface.
- Void black (#0B0D0F) anchors the full-bleed page body so the modular card grid appears to float
- Terminal phosphor green (#39FF14) pulses on card borders at hover states and marks active health indicators
- Electric violet (#BF40FF) identifies interactive affordances, active states, and call-to-action elements
- Cold interface gray (#1A1D23) forms the card surface background, separating content panels from the dark body
Mobile & speed optimization
The card-grid layout is built modularly, which means columns reflow naturally at smaller viewport widths. The template keeps the interface readable and usable on any screen size without sacrificing the visual density that technical audiences expect.
- The modular grid structure allows card rows to stack vertically on narrow screens without custom overrides
- Dark Glass Panel elements use CSS-level blur and transparency rather than heavy image assets
- The estimator tool is self-contained and interactive without requiring an external service dependency
How this template helps you convert
The page is structured as a progressive commitment funnel. Every scroll stop either answers a question or creates a reason to take the next step.
- The live-styled header metrics create immediate credibility by showing the product working before a word is read, lowering the visitor's skepticism threshold right at the top of the page.
- The Pipeline Health Estimator turns abstract value into a personal number, making the cost of inaction concrete and giving visitors a natural moment to act on the embedded call to action.
- The dual-path conversion system means both hands-on engineers and evaluating data leads find a relevant next step, whether that is a sandbox deployment or a quick documentation review.
Other information about this template
This template is categorized under DataOps Technology and is purpose-built for an open source project positioning. It follows a Directory and Discovery theme, meaning the layout is designed to surface information in a browsable, grid-organized format rather than a linear narrative scroll.
- The template style is Card Grid (Modular), making it straightforward to add or remove integration cards as the project grows
- The creative direction is Calculator and Tool First, which means the estimator component is treated as a primary feature rather than a supporting element
- Tools referenced in the brief as integration targets include Snowflake, BigQuery, dbt, Airflow, and Spark, and the integration card grid is the designated location for those entries
- The header concept (Dark Glass Panels) and the Acid Digital color palette are unique to this template and reinforce the terminal-native aesthetic expected by the target audience

Theme
Directory & Discovery
Creative direction
Calculator/Tool First
Color system
Acid Digital
Style
Card Grid (Modular)
Direction
Lead Generation
Page Sections
Dark Glass Panel Header with Live Metrics
Interactive Pipeline Health Estimator
Modular Integration Card Grid
Dual-path Lead Generation System
Testimonial and Contributor Social Proof Cards
Escalating Narrative Card Grid
Related questions
Who is this landing page template designed for?
Can I customize the integration cards for my own data stack?
How does the Pipeline Health Estimator work in this template?
What conversion paths does this template support?
Is this template suitable for a commercial product or only for open source projects?



