Harvest — Agri-Tech Landing Page Template
Yield is a precision agriculture landing page template built for smart sensor companies targeting large-scale farm operators, agronomists, and vertical farming executives. It combines a comparison table layout, a field-report creative direction, and a Dashboard Pro visual theme to turn complex sensor data into a compelling case for action. The design drives qualified leads through a low-friction assessment form and a gated benchmark report download.
by Rocket studio
Quick summary
Yield is a single-page lead generation template for smart agriculture sensor businesses. It uses a dark, data-forward visual style and an evidence-building scroll to move serious buyers from first glance to demo request. The layout is structured around a sensor comparison table, a field case study, and a two-path conversion system that captures both ready buyers and early-stage researchers.
Who this template is for
This template is designed for companies selling precision agriculture sensor technology to sophisticated agricultural buyers. It speaks the language of operations-focused decision makers who read data before breakfast.
- Precision agriculture managers overseeing 2,000-plus acre field operations
- Agronomists consulting for co-ops and regional farming networks
- CFOs and operations leads at vertical farming startups who must justify resource spend to investors
What problem this template solves
Conventional marketing pages rarely earn trust with buyers who live and die by field data. A generic layout cannot communicate the authority a sensor company needs to close deals with experienced farm operators. This template closes that gap.
- It replaces vague product claims with structured, side-by-side evidence in a comparison table
- It positions the sensor suite against manual soil sampling and named competitors across metrics that buyers actually care about
- It captures leads from both ready-to-buy operators and influential researchers who shape purchasing decisions months in advance
What you get with this template
This template delivers a fully structured single-page layout with every visual and functional component defined. Each section flows logically from credibility to proof to conversion.
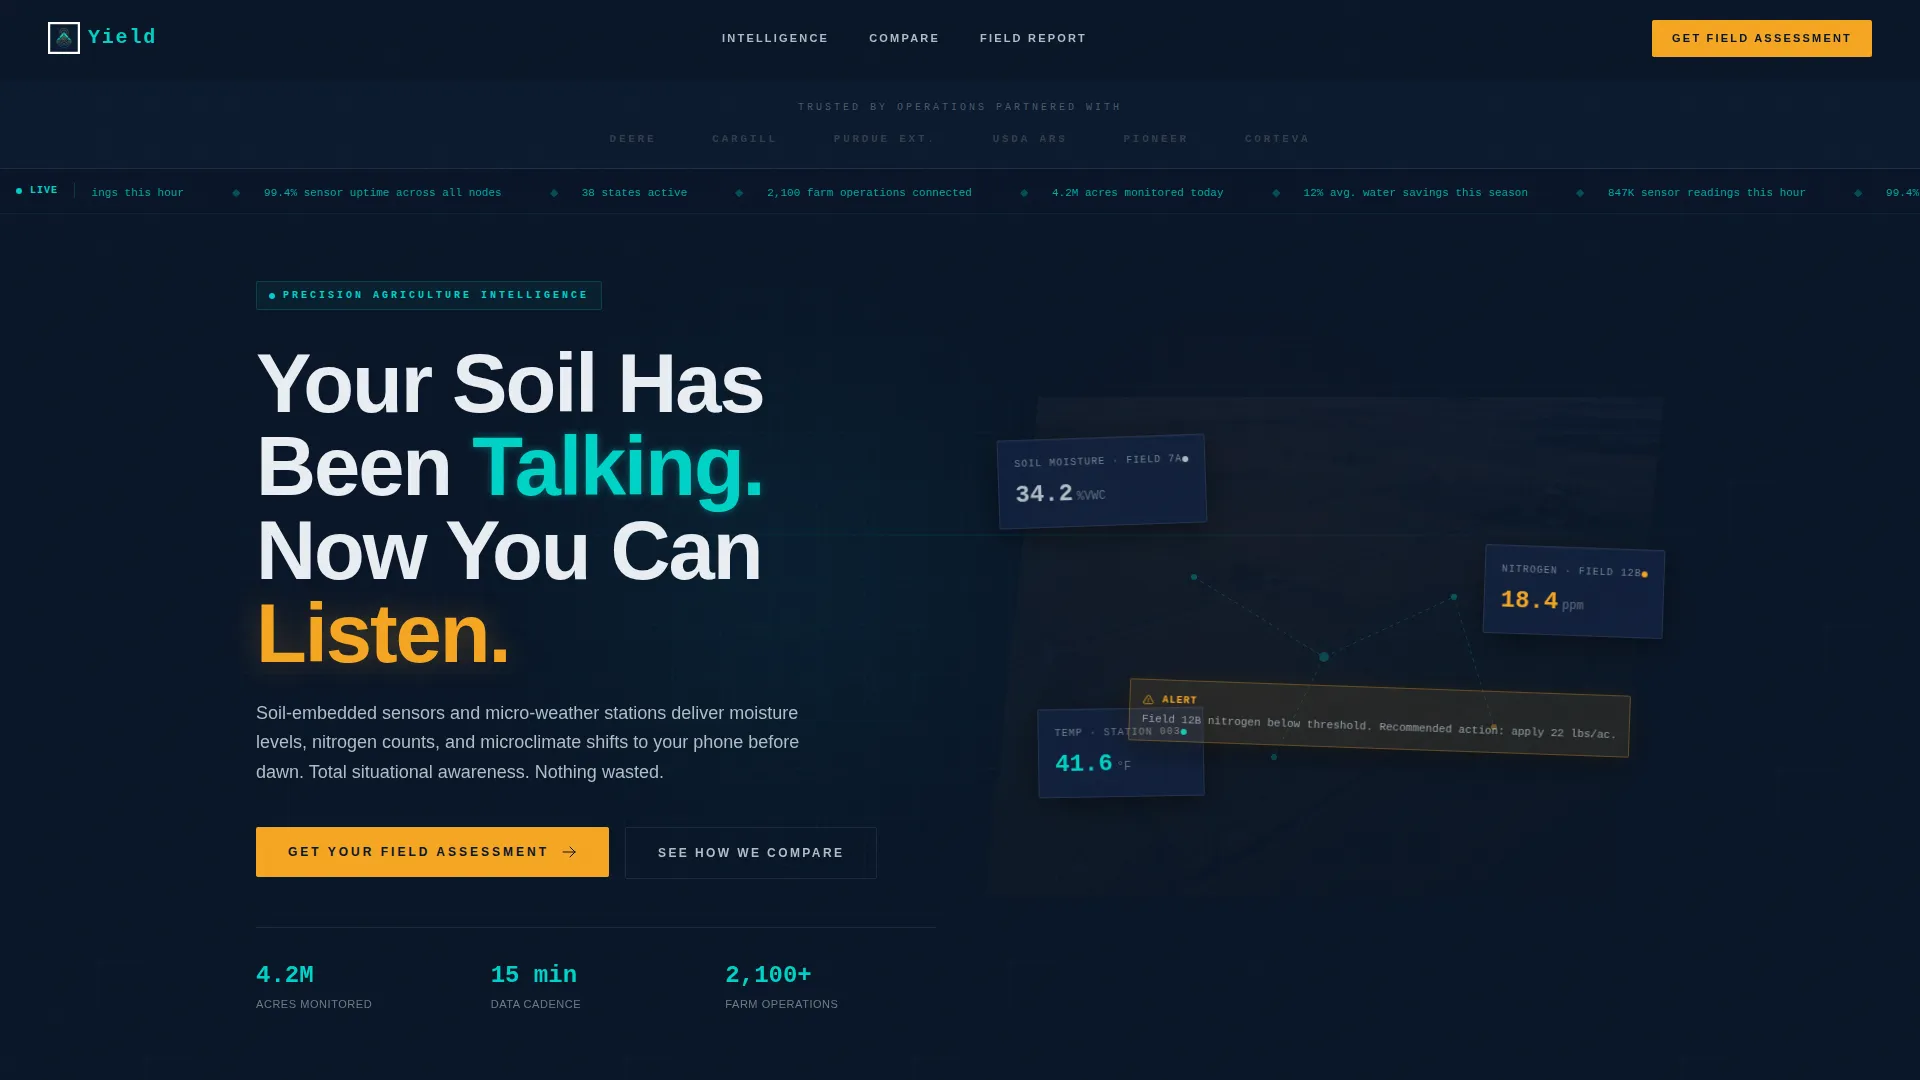
- A logo bar header, animated live-stats ticker, and bold headline section that establishes authority immediately
- A multi-column sensor comparison table, a field report case study, and a two-path lead capture system
- A sticky call-to-action bar, a primary demo request form with a slider and dropdowns, and a gated PDF download path
Feature list
This template packages several purpose-built components that work together to build trust and generate qualified leads.
Credibility Logo Bar
A horizontal strip of desaturated agricultural brand and institution logos sits above the primary headline. The logos render in field-dust gray so they lend authority without distracting from the core message.
Live Aggregate Stats Ticker
An animated scrolling ticker displays real-time aggregate statistics such as acres monitored, average water savings, and sensor readings per hour. It runs in sensor-glow teal against the deep navy background, reinforcing the live-data story before the visitor reads a single paragraph.
Sensor Comparison Table
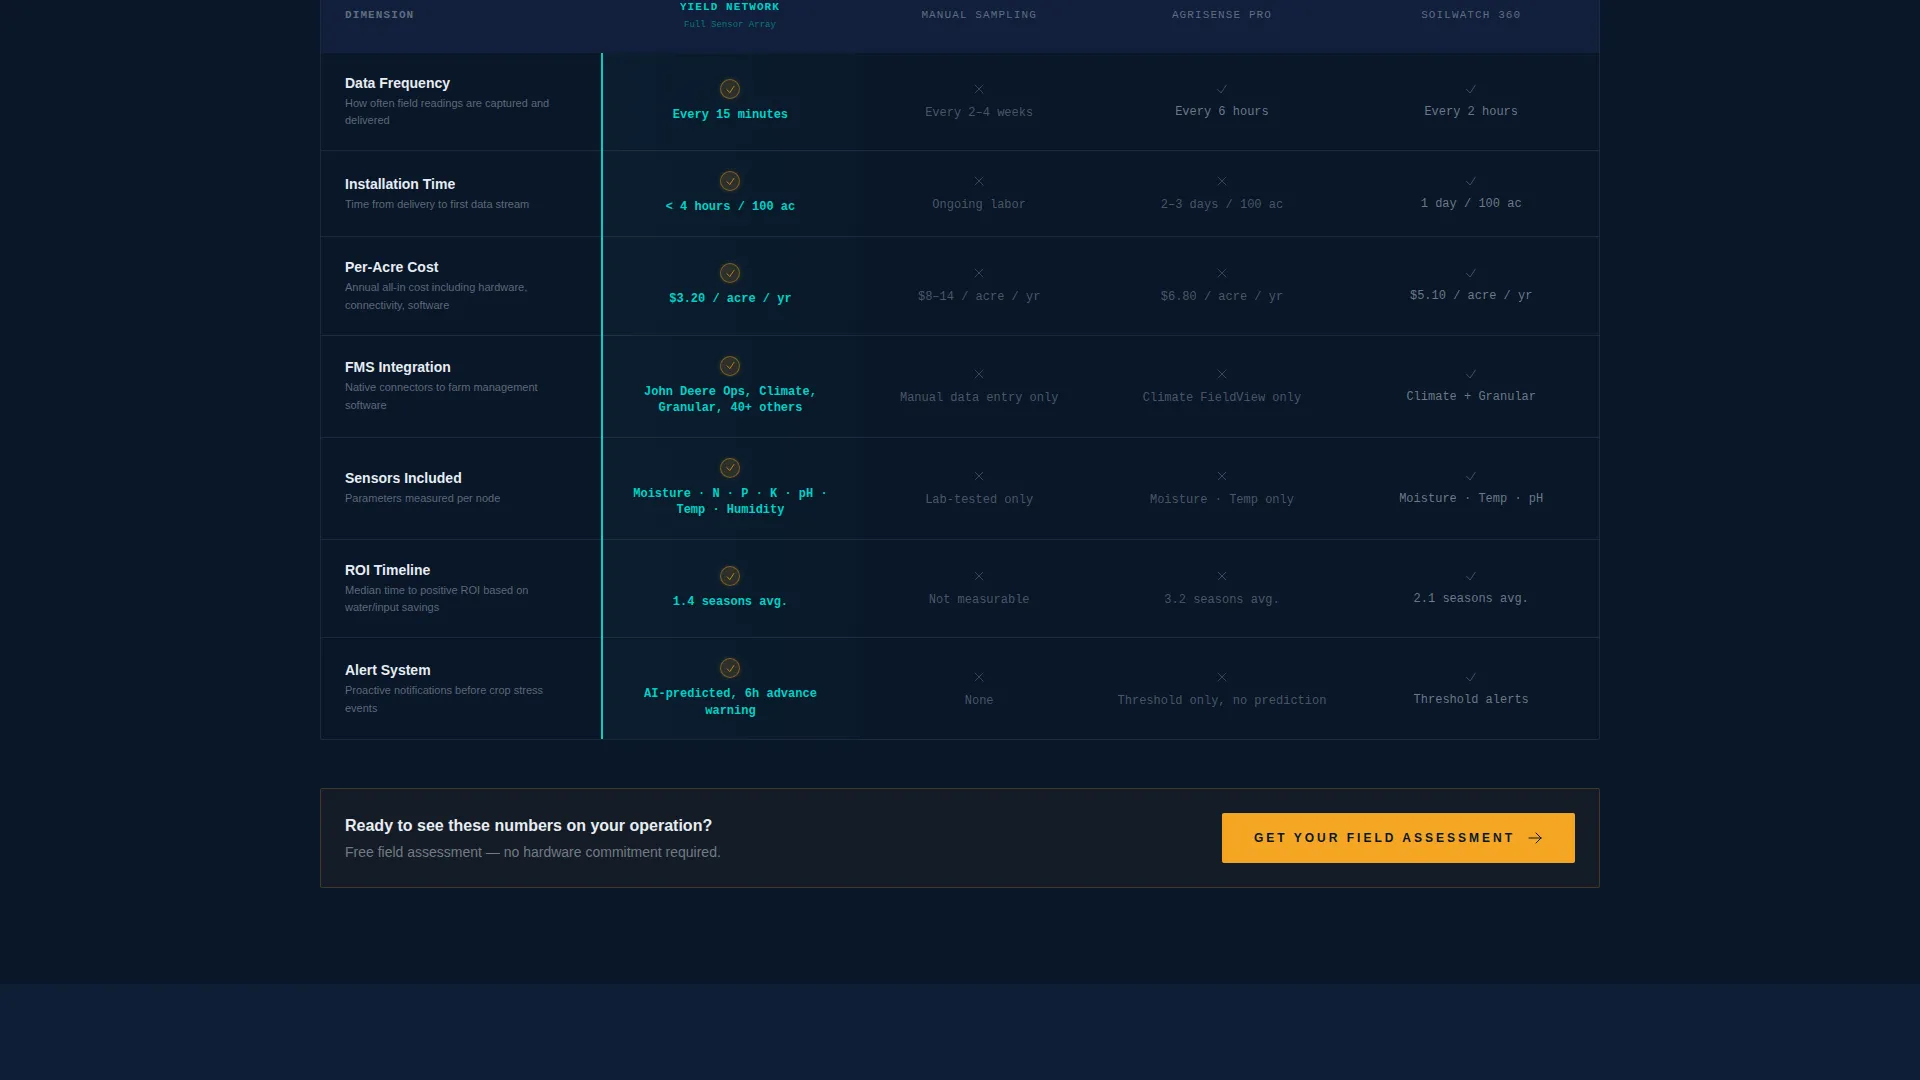
The core section places the sensor suite alongside manual soil sampling and two competitor products. Rows cover data frequency, installation time, per-acre cost, platform integration, and return-on-investment timeline. Harvest gold checkmarks highlight the featured product column so the advantage reads at a glance.
Field Report Case Study Block
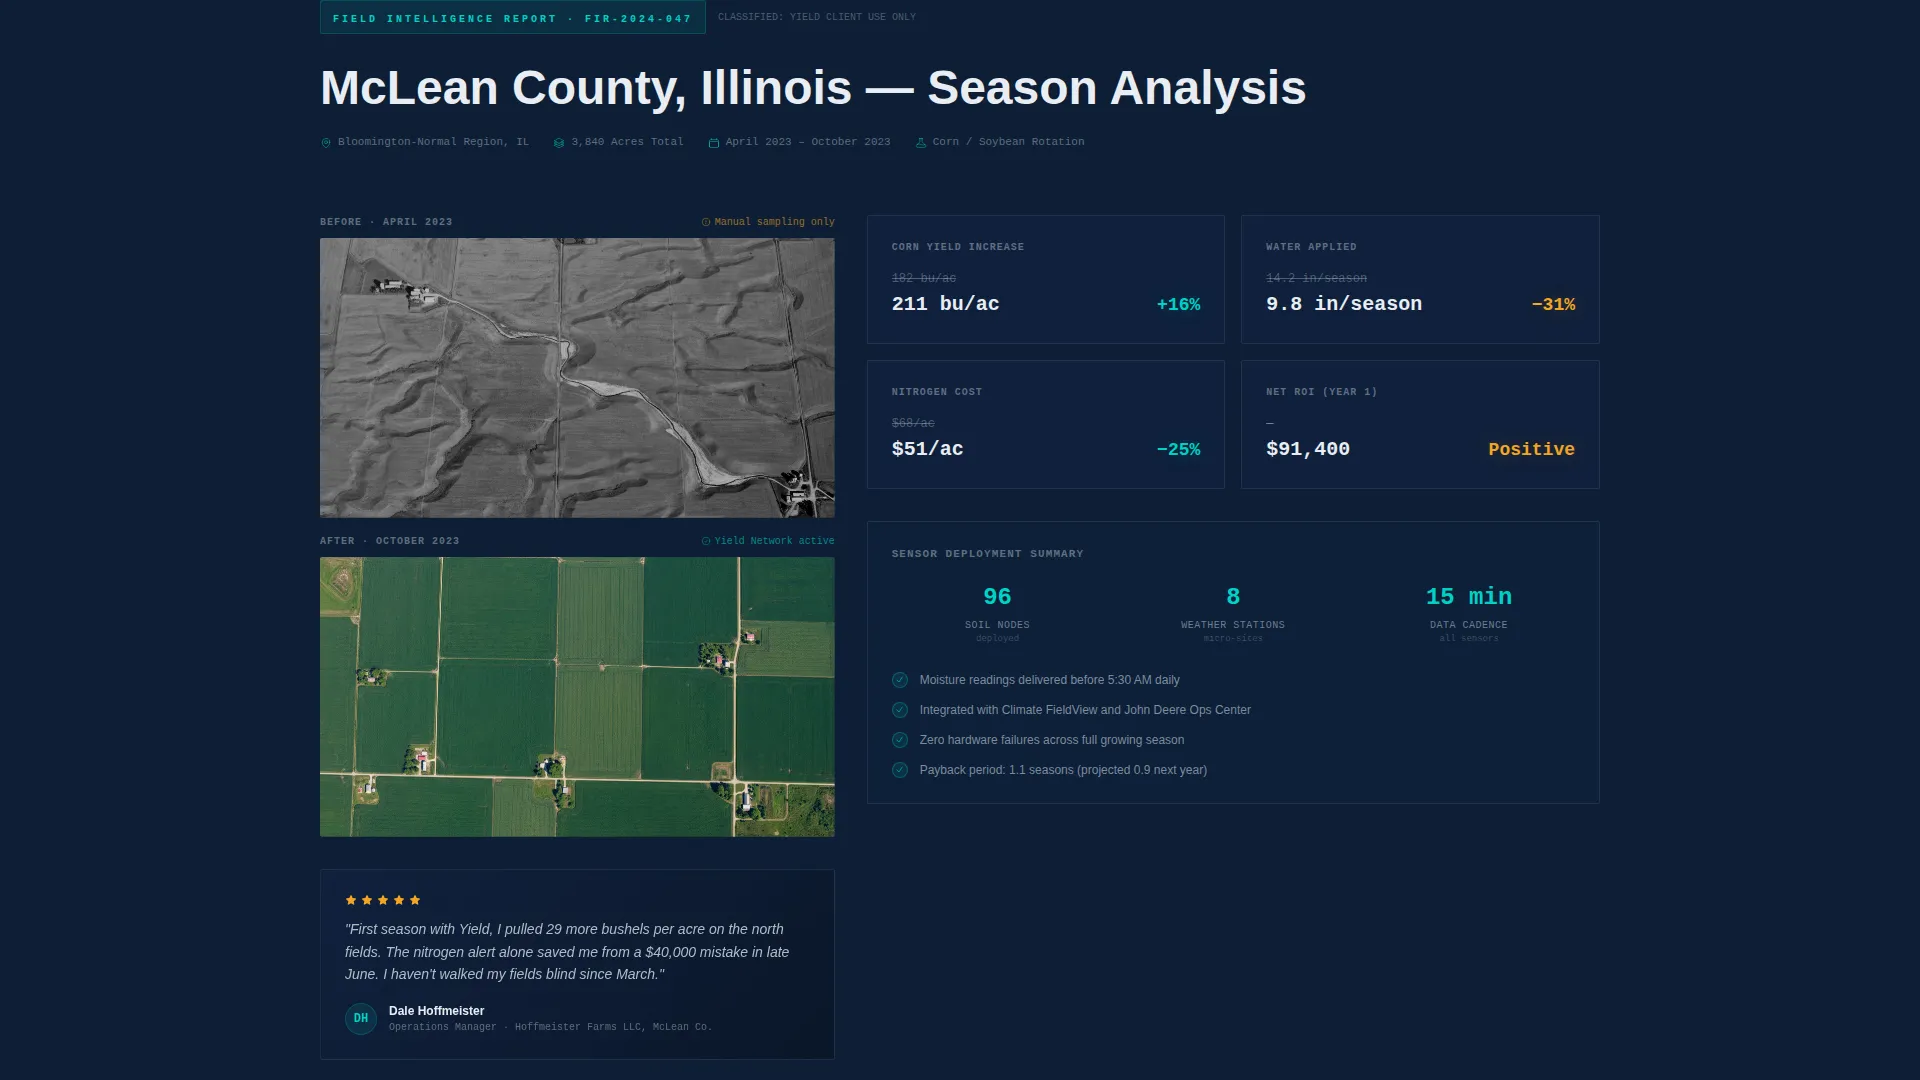
A structured case study section presents real operational proof in the format of an agricultural field report. It displays county, crop type, acreage, and before-and-after yield numbers alongside satellite imagery thumbnails, building the evidence wall the buyer needs to act.
Low-Friction Lead Capture Form
The primary conversion form opens with a total acreage slider to reduce entry friction. It follows with a crop type dropdown, a current monitoring method radio button group, and name and email fields last, keeping the most personal asks at the end.
Gated Benchmark Report Download
A secondary conversion path offers a downloadable precision agriculture benchmark report for visitors not yet ready for a sales conversation. This path captures agronomist researchers and consultants who influence purchasing decisions well before a formal buying cycle begins.
Page sections overview
| Section | Purpose |
|---|---|
| Logo Bar Header | Establishes brand credibility with recognized agriculture names and research institutions |
| Headline Block | Delivers the core value proposition with a single bold statement |
| Live Stats Ticker | Reinforces real-time platform activity with scrolling aggregate data |
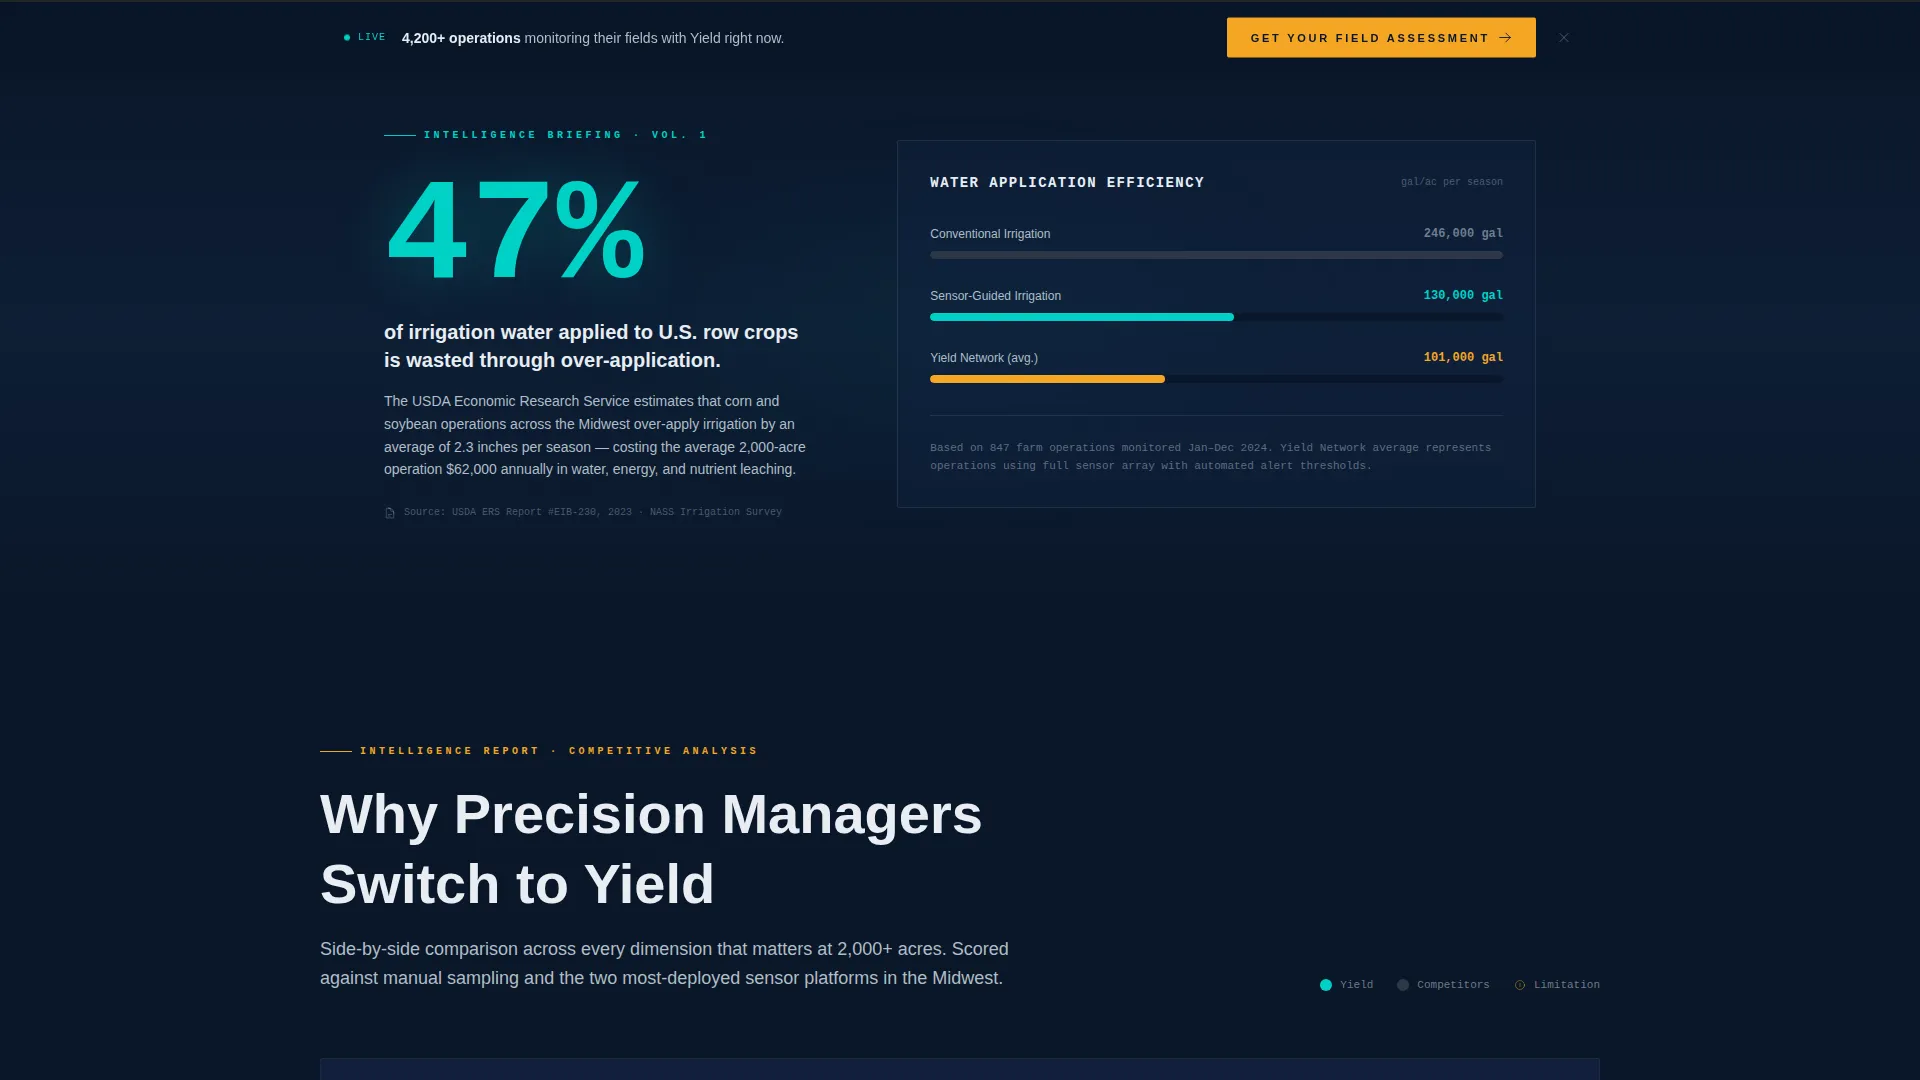
| Water Waste Stat | Opens with a cited industry statistic to frame the cost of inaction |
| Comparison Table | Positions the sensor suite against competitors across five key decision criteria |
| Field Report Case Study | Demonstrates real-world results with structured before-and-after operational data |
| Primary call to action Form | Captures ready buyers with a low-friction field assessment request form |
| Sticky call to action Bar | Re-engages scrollers past 60 percent page depth with a persistent call to action |
| Benchmark Report Download | Converts research-stage visitors with a gated PDF lead magnet |
Design & branding system
The visual system is built around a Dashboard Pro theme using a Midnight Blue color palette. Every color choice has a specific role, and no two elements compete for the same visual weight.
- Deep terminal navy (#0A1628) forms the primary background, giving the page the calm authority of a mission control interface
- Sensor-glow teal (#00D2C6) is reserved for live data accents, interactive hover states, and the animated ticker
- Field-dust gray (#B0BEC5) handles secondary text, table borders, and the desaturated logo bar treatment
- Harvest gold (#F5A623) appears exclusively on call-to-action buttons and critical alert indicators, making every conversion touchpoint unmistakable
Mobile & speed optimization
The template is structured so its dense data layout remains clean and readable on smaller screens. The comparison table and form components are designed with mobile display in mind.
- The comparison table adapts so key columns remain visible without horizontal scrolling on standard mobile viewports
- The acreage slider and form fields are sized for comfortable touch interaction on phones and tablets
- The sticky call-to-action bar activates after 60 percent scroll depth on all screen sizes, keeping the conversion prompt present without blocking early content
How this template helps you convert
The page is engineered as an evidence wall that makes inaction feel costly. Every scroll builds on the last section so the ask at the bottom feels earned.
- The logo bar and live ticker establish immediate credibility before the visitor reads a single product claim, reducing early bounce from skeptical buyers
- The comparison table makes the competitive advantage visible in seconds, giving procurement-minded buyers the structured data they need to justify a conversation
- The two-path conversion system captures both high-intent demo requests and research-stage leads, ensuring the page produces pipeline value from every visitor type
Other information about this template
This template is built specifically for the smart agriculture sensors niche within the broader IoT and hardware technology category. It is suited to companies operating at the intersection of agronomy, data technology, and large-scale farm management.
- The Industry Report creative direction gives the scroll a proprietary intelligence-briefing feel, which resonates with analytically minded agricultural buyers
- The Comparison Table template style is particularly effective for sensor technology where buyers routinely evaluate multiple vendors before committing
- The template fits naturally into a broader content ecosystem alongside soil health whitepapers, agronomy webinars, or co-op partnership announcements
- It can support campaigns targeting Midwest co-op networks, large independent farm operations, and controlled-environment agriculture investors simultaneously
Theme
Dashboard Pro
Creative direction
Industry Report
Color system
Midnight Blue
Style
Comparison Table
Direction
Lead Generation
Page Sections
Credibility Logo Bar with Desaturated Branding
Animated Live Statistics Ticker
Five-metric Sensor Comparison Table
Field Report Case Study Block
Low-friction Two-path Lead Capture
Sticky Call-to-action Bar
Related questions
Can I edit the comparison table to match my actual competitors?
What is the gated PDF download connected to?
Is the live stats ticker pulling real data automatically?
Can this template work for a vertical farming company, not just field agriculture?
Where does the sticky call-to-action bar appear on the page?



