Cannabis Dashboard Landing Page Template
The Cannalytics real time cannabis intelligence dashboard landing page template is built for multi-state cannabis operators who need answers before the morning meeting. It combines a live bento grid dashboard preview, a scroll-driven problem-to-solution arc, a head-to-head versus table, and a progressive two-step trial signup form into one high-converting, server-rack-aesthetic landing page.
by Rocket studio
Quick summary
This template puts real cannabis market data front and center. The header is a fully animated bento grid dashboard preview showing SKU velocity heatmaps, margin sparklines, and compliance alert feeds. Every scroll beat drives visitors through a pain grid, a solution mirror, a competitive versus table, and a final testimonial cell with one clear call to action.
Who this template is for
This template is built for operators who already understand the cannabis industry and need a platform that keeps pace with them. It speaks directly to decision-makers managing complexity across multiple locations.
- VP-level operations leaders at multi-state operators (MSOs) running twelve or more dispensaries across three or more states
- Procurement directors who need SKU-level inventory insights without building pivot tables from point-of-sale (POS) system exports every night
- Compliance officers who require seed-to-sale audit trails that hold up under state review
What problem this template solves
Cannabis businesses lose margin every day to blind spots in their data. Raw data sits locked inside POS system exports, compliance portals, and spreadsheets that no one has time to reconcile. The cannabis industry is growing fast, but most operators are still reacting to trends rather than predicting them.
- Dead inventory carries holding costs that quietly erode profitability across every location
- Manual compliance reporting creates audit risks that expose cannabis companies to significant regulatory fines
- Fragmented data across multiple platforms prevents sales teams and procurement directors from seeing which products are actually moving
What you get with this template
You get a complete, single-page layout designed to demonstrate enterprise-grade business intelligence in a format that VP-level buyers immediately recognize and trust. The template delivers the full visual and functional structure needed to launch a high-converting cannabis analytics platform landing page.
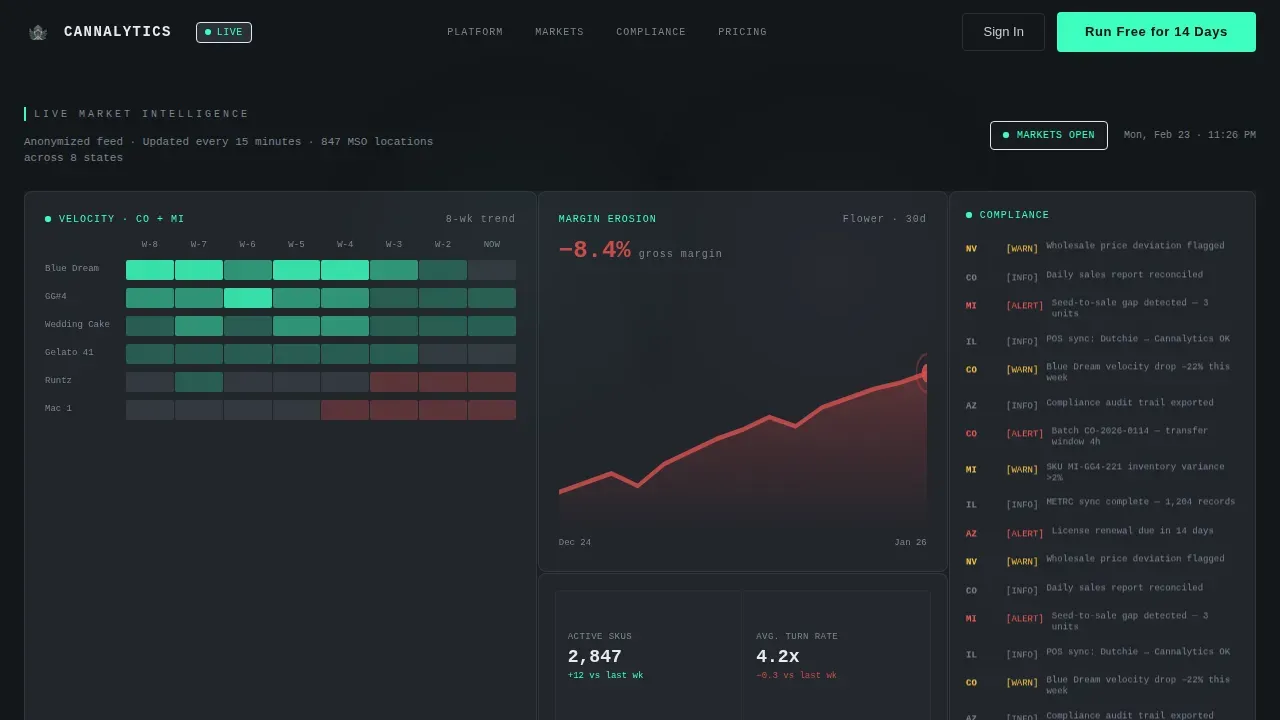
- A full-width animated bento grid header with a live dashboard preview populated with realistic, anonymized cannabis market data
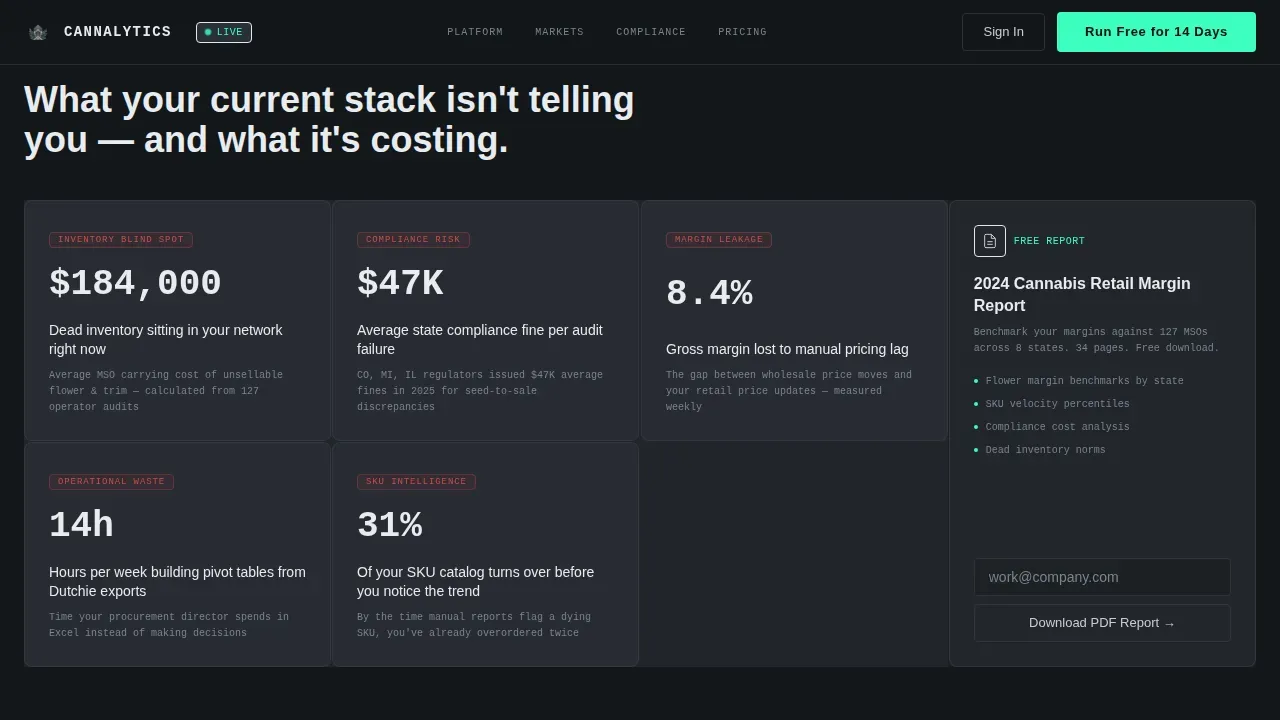
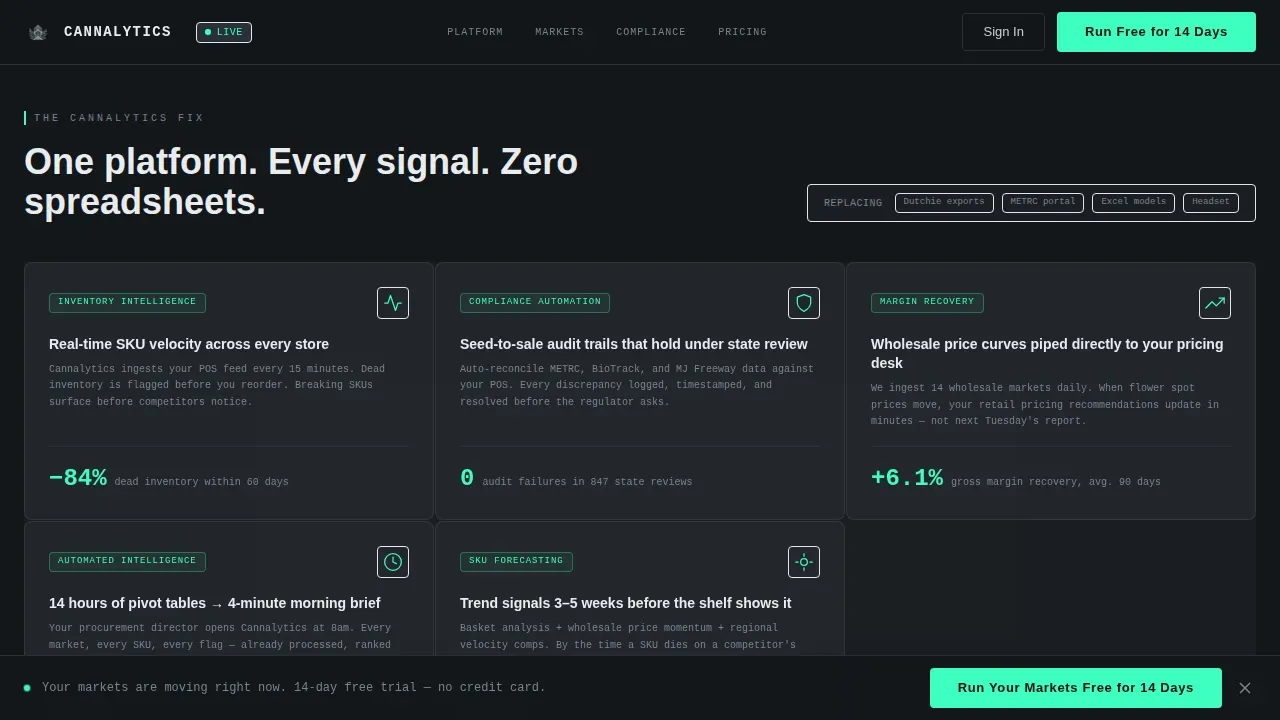
- A five-cell pain grid and matching solution mirror that crossfade on scroll, plus a sidebar card for a gated PDF benchmark report
- A competitive versus table comparing the platform against alternative tools across twelve feature dimensions, followed by a testimonial cell and sticky call-to-action bar
Feature list
The template's key features reflect the specific requirements of enterprise cannabis analytics buyers. Each section is purpose-built to surface actionable insights and move visitors toward a trial.
Animated Bento Grid Dashboard Header
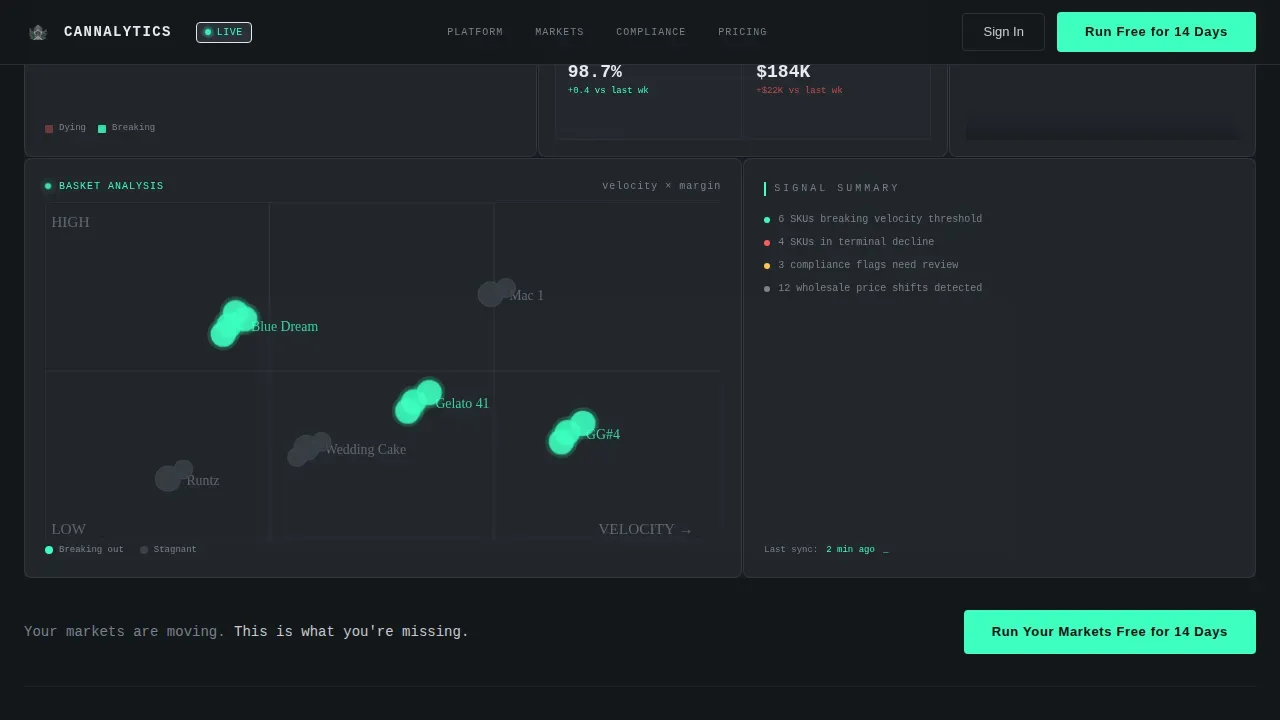
The header is a living dashboard preview, not a static hero image. It renders a velocity heatmap for flower SKUs, a margin erosion sparkline, a scrolling compliance alert feed, and a basket-analysis scatter plot. Data points pulse in electric mint. Numbers increment as cells enter the viewport, and the grid responds to scroll with subtle parallax motion.
Problem-to-Solution Scroll Arc
Section one presents five bento cells, each containing a single damning statistic about cannabis retail blind spots: dead inventory costs, compliance fine averages, and margin leakage from manual reporting. Section two mirrors the identical grid layout, replacing each pain cell with the corresponding Cannalytics solution module through a smooth scroll-triggered crossfade. This structure makes the platform's value visceral before the visitor reads a single feature description.
Head-to-Head Versus Table
The versus table lets visitors track performance differences across twelve feature dimensions directly. Electric mint checkmarks and steel-gray dashes make the comparison immediately readable. This section is designed around a Comparison/Versus conversion strategy, targeting buyers who are actively evaluating analytics options and need a clear reason to choose one platform over alternatives.
Progressive Two-Step Trial Form
Step one of the signup form asks only for work email and number of active dispensary locations, keeping the friction low. After submission, step two appears inline and asks for the primary POS system used (Dutchie, Treez, Flowhub, or Other) and markets of operation via multi-select state chips. This structure helps the sales team qualify leads without overwhelming first-time visitors.
Gated PDF Benchmark Report Sidebar
A secondary conversion path sits within the pain-point bento section as a sidebar card. Visitors not yet ready for a trial can download a static PDF benchmark report gated behind email-only capture. This capture path keeps secondary visitors in the funnel and delivers immediate value without requiring a full trial commitment.
Sticky Call-to-Action Bar
A bottom bar carrying the primary call-to-action activates after forty percent scroll depth. The primary call to action, "Run Your Markets Free for 14 Days," appears three times total: beneath the header dashboard, at the conclusion of the versus table, and inside the sticky bar. Placement at all three scroll milestones ensures the offer is always visible when intent peaks.
Page sections overview
| Section | Purpose |
|---|---|
| Bento Dashboard Header | Demonstrates live cannabis market data visualization with animated KPI cells and scroll-triggered interactions |
| Pain Statistics Grid | Shows five cells of damning cannabis retail data to establish problem urgency |
| Solution Mirror Grid | Crossfades from pain grid to Cannalytics solution modules on scroll |
| PDF Report Sidebar | Secondary email capture path for visitors not ready for a trial |
| Versus Comparison Table | Compares platform against alternatives across twelve feature dimensions |
| Testimonial Final call to action | Single MSO ops director quote, one ROI number, and one trial button |
| Sticky call to action Bar | Persistent bottom bar activating at forty percent scroll depth |
| Linear Footer Row | Single-row footer with minimal navigation and legal links |
Design & branding system
The visual identity follows a Directory and Discovery theme executed in a Monochrome Steel color system. The aesthetic is deliberately industrial, like the inside of a server rack: no warmth, no decorative elements, only machined surfaces and live indicator lights.
- Color palette: deep gunmetal (#1B1F23) as the primary background, brushed steel (#3A4149) for card surfaces and data containers, cold silver (#C9CED3) for secondary text and axis labels, and electric mint (#3DFFC0) reserved exclusively for live data points, active states, and the primary call to action
- Typography: DM Sans for headers and body text; JetBrains Mono for all data values, KPI numbers, and axis labels to reinforce the terminal aesthetic
- Bento cell borders are 1px steel lines that disappear until hovered, keeping the layout clean at rest and interactive on engagement
Mobile & speed optimization
The template is designed desktop-first, reflecting the Bloomberg terminal aesthetic and the reality that VP-level users typically review complex KPI dashboards on workstations. Mobile layout is supported for stakeholders checking performance data on portable devices.
- Images are structured for optimization using standard techniques such as optimizing images and minimizing scripts to support fast page loading
- Server Components handle static layout and content sections, while Client Components power the animated dashboard cells to balance interactivity with load performance
- The progressive form and sticky call to action bar are built to function correctly across screen sizes, keeping the conversion path intact for any device
How this template helps you convert
The entire layout is engineered around one objective: turning a skeptical VP-level buyer into a trial signup. Every design and content decision supports that conversion goal.
- The animated dashboard header delivers immediate business intelligence credibility before any copy is read, setting a high trust baseline that supports customer engagement from the first second on the page
- The problem-to-solution crossfade arc connects the visitor's exact pain points to the platform's solution modules, making the value exchange feel personal and specific rather than generic
- Three placements of the primary call to action, plus the secondary PDF capture path, ensure that visitors at every intent level have a clear and low-friction next step, which supports both revenue growth for the platform and customer retention through progressive qualification
Other information about this template
This template is built for the cannabis industry segment where data density and analytical rigor matter most. It is designed to communicate enterprise-grade business intelligence to buyers who can immediately tell the difference between a real analytics platform and a marketing brochure.
- The template supports the kind of compliance software positioning that addresses compliance risks head-on, including seed-to-sale tracking context and regulatory compliance messaging throughout the pain and solution grid sections
- Customer segmentation signals are woven into the progressive form design: the POS system and market selection steps in step two give the platform meaningful data about buying patterns and operational scale before a single demo call occurs
- The versus table is designed to surface customer insights about why data driven decision making at the KPI level separates high-performing MSOs from those bleeding margin, making the comparison visceral and converting curiosity into intent
- The PDF benchmark report sidebar addresses visitors in an earlier research phase, supporting e-commerce and dispensary website decision-makers who need to understand market trends before committing to a platform
- The template references the projected cannabis industry growth to $49.56 billion by 2029 as context for why sophisticated analytics demand is rising, giving the platform's value proposition a credible macro backdrop
- Happy cabbage analytics positioning and the happy cabbage brand approach to cannabis data are examples of the market context this template is built to stand apart from, demonstrating a more enterprise-grade, KPI-focused alternative
- For cannabis companies evaluating e-commerce platforms and multiple systems simultaneously, the template's versus table and progressive form structure make it easy to communicate how the platform integrates directly with existing POS system infrastructure and scales across multiple locations
Theme
Directory & Discovery
Creative direction
Problem→Solution Arc
Color system
Monochrome Steel
Direction
Comparison/Versus
Page Sections
Animated Bento Grid Dashboard Header
Problem-to-solution Scroll Arc
Head-to-head Versus Comparison Table
Progressive Two-step Trial Signup Form
Gated PDF Benchmark Report Sidebar
Sticky Call-to-action Bar with Three Call to Action Placements
Related questions
What type of cannabis business is this template designed for?
Does this template include the actual analytics dashboard or just the landing page design?
Can I customize the versus table to reflect my platform's real feature set?
How does the two-step signup form help qualify leads?
Is this template suitable for a cannabis brand that sells through e-commerce channels?



