SIEM Landing Page Template | Data Command Hub & Spoke
The Ingest SIEM landing page template is built for API-first security platforms that process billions of log lines per second. It combines a hub and spoke anchor navigation layout with an interactive ingestion cost estimator, architecture diagrams, a detection rule library preview, and a live API sandbox. The result is a dark ops-center experience designed to convert SOC leads, DevSecOps engineers, and MSSPs.
by Rocket studio
Quick summary
This template gives API-first SIEM platforms a purpose-built landing page that feels like a live operations center. Five anchor-nav spokes guide visitors from an interactive cost calculator through architecture diagrams, detection rule previews, and a working API sandbox. Every section is designed to answer the next objection before it forms, moving security teams from curiosity to agent deployment.
Who this template is for
Security-focused product teams need a landing page that speaks the language of the people buying their platform. Generic templates rarely capture the precision that a technical buyer demands. This template is purpose-built for teams selling an API-first SIEM solution to a technically sophisticated audience that scrutinizes every claim.
- SOC leads at mid-market companies who face constant alert fatigue and need a clear cost comparison against existing monitoring tools.
- DevSecOps engineers who want to pipe detection rules directly into CI/CD workflows and need real code examples before they commit.
- MSSPs managing multi-client environments who need to see how a single platform can ingest logs from systems that were never designed to talk to each other.
What problem this template solves
Security operations teams are buried in alerts, fragmented dashboards, and pricing models that punish growth. A generic SaaS template cannot communicate the depth of a platform that must correlate events across firewall logs, cloud trails, and endpoint telemetry simultaneously. Buyers need proof before they deploy an agent, and most landing pages never get past the hero section.
- Alert overload and blind spots leave security teams unable to investigate what matters. The template's interactive calculator and architecture spoke show exactly how the platform eliminates gaps across various sources.
- Pricing uncertainty stalls decisions. The built-in cost estimator lets visitors run their own numbers against incumbents, making the value case concrete before any sales call.
- Technical skepticism blocks deployment. The API sandbox and platform toggle give engineers a working example they can copy and run, removing the friction of a discovery phase.
What you get with this template
You get a fully structured hub and spoke landing page anchored by five distinct content spokes. Each spoke is a self-contained section that deepens commitment in sequence. The page is designed around the Data Command visual theme, using a dark terminal aesthetic that feels immediately credible to the security operations audience it targets.
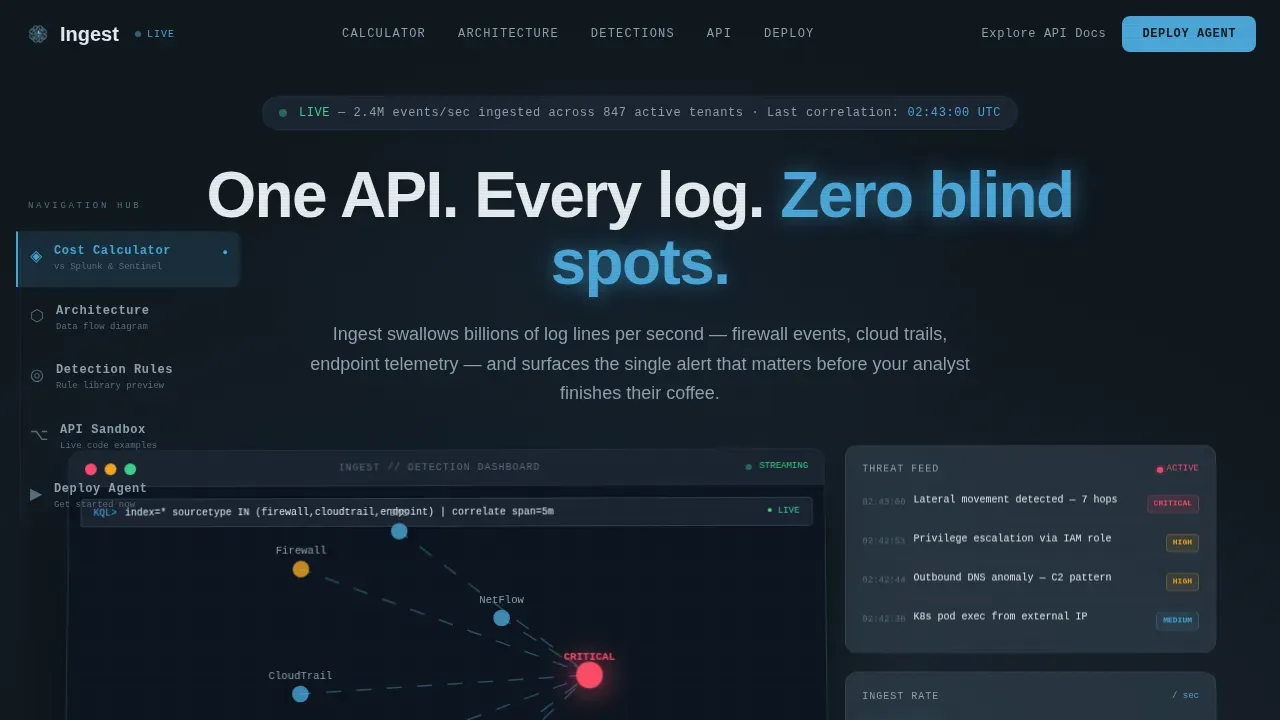
- A hero section featuring a perspective-tilted product screenshot showing a live correlation graph, a floating threat card, and the headline "One API. Every log. Zero blind spots."
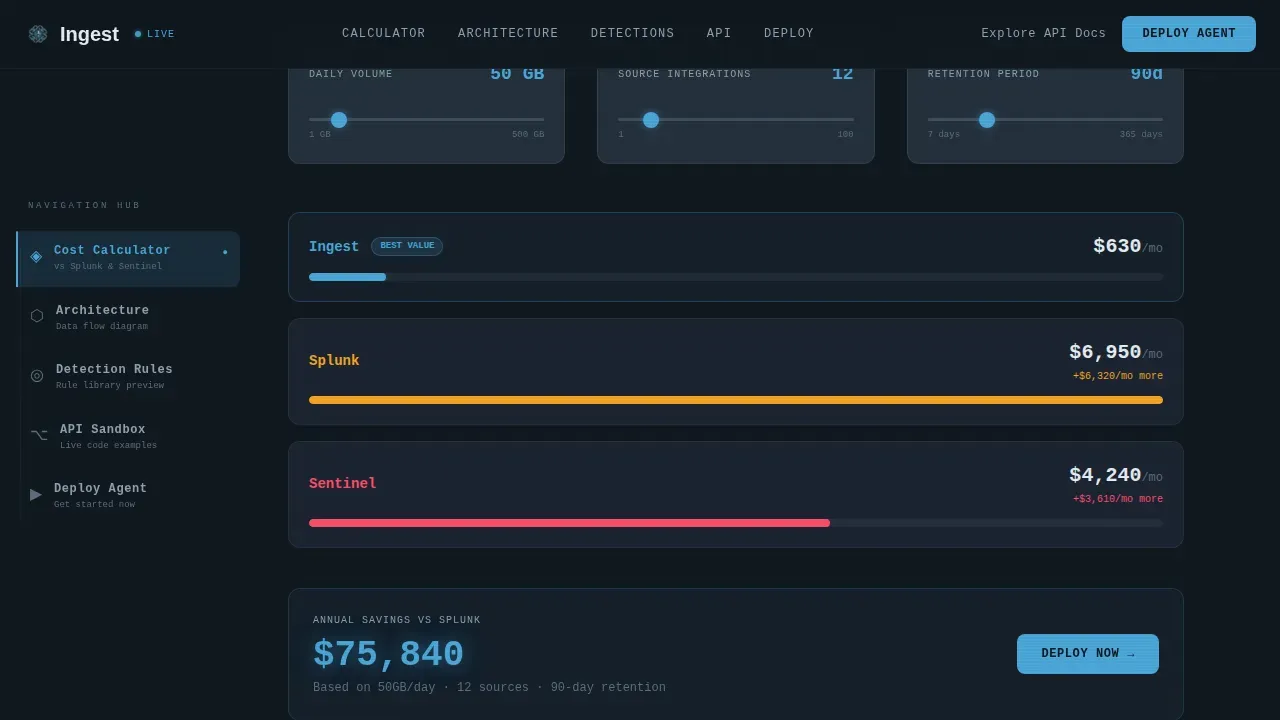
- An interactive ingestion cost estimator with sliders for daily log volume, number of source integrations, and retention period, rendered alongside a comparison column for incumbent platforms.
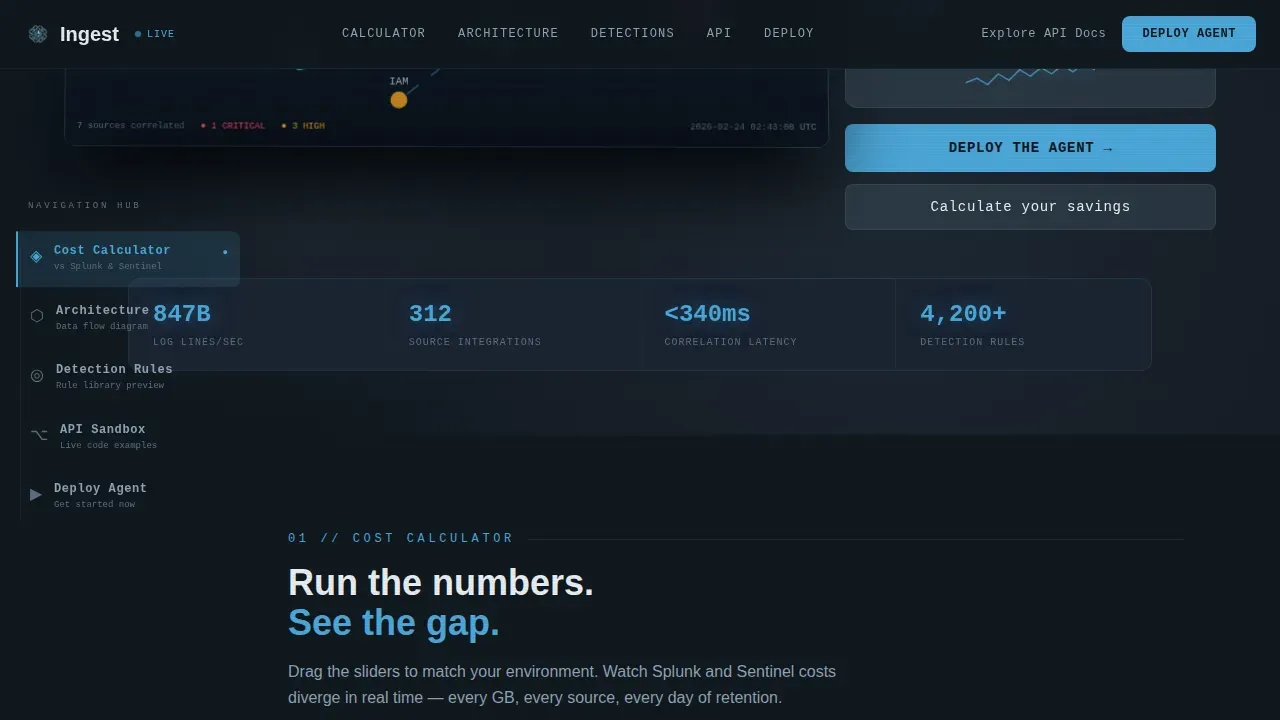
- An architecture spoke, detection rule library preview, API sandbox with platform toggle, and a primary "Deploy the Agent" call to action with install commands for Linux, Docker, Kubernetes, and macOS.
Feature list
This template ships with five content spokes and a visual system designed to earn trust from technical buyers. Every component is grounded in the brief and built to move visitors toward deployment.
Interactive Ingestion Cost Estimator
The calculator spoke is the first section a visitor lands on after the hero. Three sliders control daily log volume in gigabytes, number of source integrations, and retention period in days. As the user adjusts each slider, the tool instantly renders an estimated monthly cost alongside a ghost column showing what the same configuration costs on competing platforms. Seeing their own numbers in real time makes the decision feel personal and data-driven, not sales-driven.
Anchor Navigation Hub and Spoke Layout
A pinned anchor navigation bar serves as the hub, giving visitors direct access to all five spokes without scrolling through sections they are not ready for. The nav uses stratosphere blue active indicators to show which spoke is currently in view. This structure lets a SOC lead jump straight to the detection library while a DevSecOps engineer goes directly to the API sandbox, reducing bounce by matching navigation to intent.
Architecture Data Flow Diagram
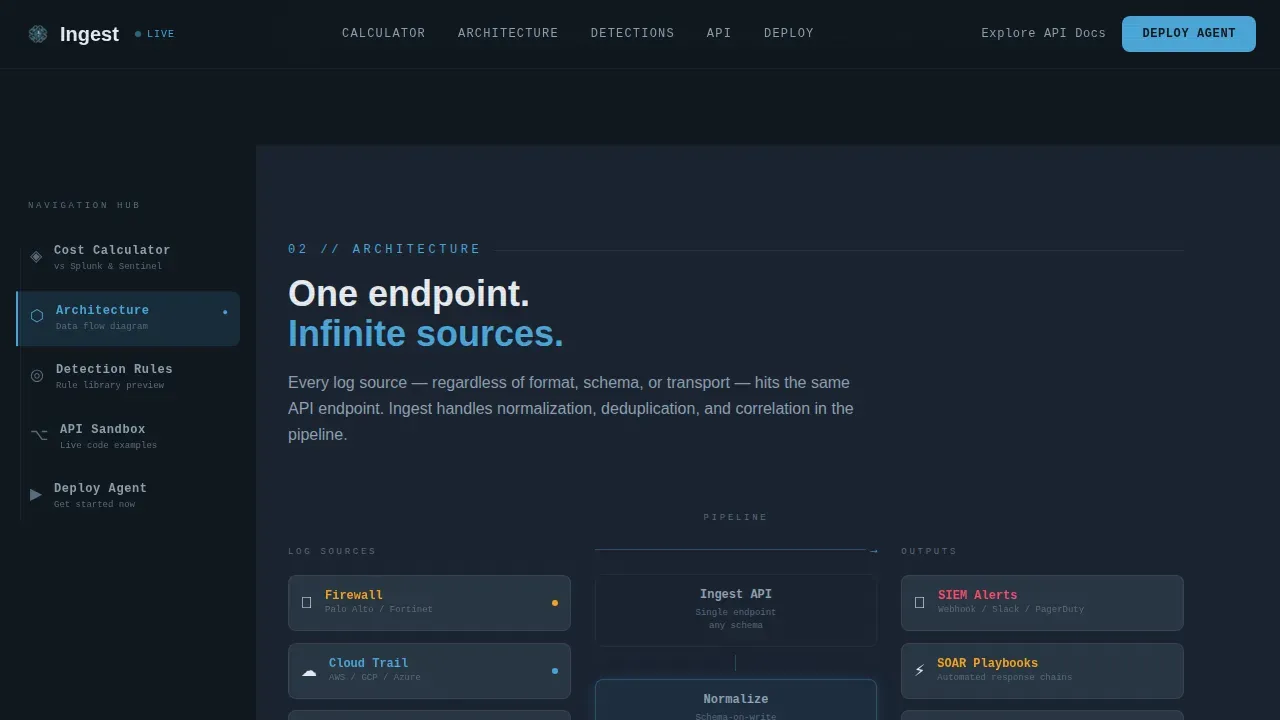
The architecture spoke presents a visual data flow diagram showing how raw logs travel from various sources through the ingest API, into the correlation engine, and out as prioritized alerts. This spoke answers the most common technical objection: how does the platform actually handle my log type at scale? The diagram makes a complex pipeline readable in seconds and builds confidence before a visitor reaches the deployment section.
Detection Rule Library Preview
The detection library spoke shows rule preview cards with KQL query snippets and severity badges. Each card displays a rule name, the log type it targets, and the severity level it generates when triggered. Visitors can see how the platform handles specific scenarios such as lateral movement, credential access events, or a pattern that signals initial access. This preview gives security teams a concrete sense of what detection looks like before they configure anything.
API Sandbox with Platform Toggle
The API sandbox spoke presents ready-to-run code snippets alongside a platform toggle for Linux, Docker, Kubernetes, and macOS. Selecting a platform swaps the one-line install command beneath it. A "Deploy the Agent" primary call to action sits directly below, and a secondary "Explore the API Docs" path captures engineers who want to read before they run. The sandbox removes the distance between reading about the platform and actually running it.
Hero Product Screenshot Section
The hero is a full-width perspective-tilted product screenshot showing the detection dashboard mid-correlation. Seven nodes representing disparate log sources converge on a single critical alert. Severity badges glow in stratosphere blue, and a query bar at the top displays a half-typed KQL filter. A soft slate shadow grounds the screenshot like a monitor on a desk, and a single line of cirrus-white text above it frames the entire value proposition instantly.
Page sections overview
| Section | Purpose |
|---|---|
| Hero Dashboard Screenshot | Establishes platform credibility with a live-feel correlation graph and headline |
| Calculator Cost Estimator | Lets visitors input their own log volume and see projected savings immediately |
| Architecture Flow Diagram | Shows how raw logs move through the ingest API to generate prioritized alerts |
| Detection Rule Library | Previews rule cards with KQL snippets, rule names, and severity badges |
| API Sandbox Toggle | Delivers platform-specific install commands and a direct deploy call to action |
| Footer Single Row | Closes with a linear single-row pattern linking essential nav and compliance details |
Design & branding system
The Data Command theme uses a Slate and Sky color system built for extended monitoring sessions at a workstation. Every color choice reduces eye strain during a twelve-hour shift while keeping data-critical elements immediately visible. The palette feels like a cockpit instrument panel: dark enough to focus attention, with blue telemetry accents that pulse like altitude readings against an endless gray sky.
- Color palette: Deep terminal slate (#1B2432) for backgrounds, gunmetal gray (#3D4F5F) for card surfaces, stratosphere blue (#4DA8DA) on active nav indicators and streaming data accents, and pale cirrus white (#E8EEF2) for body text and axis labels.
- Typography: JetBrains Mono for code blocks, labels, and KQL snippets; DM Sans for all headings and body paragraphs. High-severity alerts are visually distinct with color-coded badges to align with dashboard scanning patterns.
- Animation and interactivity: GSAP scroll reveals, pulsing data stream effects, counter animations on throughput metrics, and live streaming text in the API sandbox section all create a sense of a living, breathing security operations environment.
Mobile & speed optimization
The template is designed desktop-first to serve SOC analysts and engineers who spend their shifts at workstations with large displays. The layout prioritizes the top-left quadrant of each section for the most critical metrics, matching natural scanning patterns. A mobile fallback ensures that visiting the page from a tablet or smartphone during an incident response still delivers a readable and functional experience.
- Desktop-first layout with a mobile-responsive fallback so analysts can monitor critical details from tablets or smartphones when away from their primary station.
- Performance architecture uses server components for all static content sections, reserving client-side rendering for the interactive calculator, platform toggle, and anchor nav. Real-time updates rely on pre-aggregated data and lazy-loading for complex visualizations to keep interactions feeling instant.
- Status indicators such as "Live" labels and "Last Updated" timestamps are built into the dashboard screenshot and data stream components to signal data freshness, building trust with visitors who know exactly what stale data costs during an active incident.
How this template helps you convert
The conversion path is deliberately sequenced. Each spoke answers the objection that the previous step left open, creating a compounding commitment effect rather than a single persuasion moment. By the time a visitor reaches the deploy call to action, they have already done the math, reviewed the architecture, examined real detection rules, and held a working install command in their clipboard.
- The calculator earns the click. Visitors drag sliders to configure their own environment and see projected costs rendered in real numbers. The comparison column for incumbent platforms makes the savings case concrete. Once a visitor has generated their own cost estimate, the friction of downloading an agent drops sharply because they have already made the economic argument themselves.
- The detection library and API sandbox close the technical gap. Seeing a rule name, a matching log type, and a KQL snippet gives security teams a real sense of what detection looks like in practice. The platform toggle and one-line install command in the sandbox section reduce the distance between evaluating the platform and actually running it, turning intent into action.
Other information about this template
This template is specifically designed as an ingest real time data command siem landing page template for API-first SIEM platforms. It is built to showcase how a cloud SIEM collects and normalizes log data from various sources into a common format for rapid search and analysis. The sections and components below reflect the full scope of what teams should know before configuring and deploying this template in their environment.
- Data ingestion architecture: Configuring data ingest is the first step in preparing a SIEM system to correlate events across the environment. The template's architecture spoke can represent ingestion methods such as HTTP Event Collector (HEC) or Webhook, and the data flow diagram can map how raw logs are parsed into key-value pairs, enriched with threat intel, and normalized into a standard schema such as CEF or ECS before alerts are generated.
- Cloud SIEM context: A cloud SIEM automatically normalizes, enriches, and correlates data across multiple data sources into actionable security insights. Ingested records are compared against rules, and if a record matches, a signal is generated containing details about the security event, including ip address, user name, log type, and a timestamp. This template is structured to communicate that pipeline clearly to a technical buyer evaluating a cloud SIEM purchase.
- Compliance and retention: SIEM platforms enable compliance reporting by generating audit reports and enforcing retention policies as required by frameworks such as PCI DSS. The calculator spoke can surface retention period as a variable in cost modeling, making it easier for compliance-focused buyers to see total cost of ownership over a specific time period.
- Detection and threat coverage: Custom rules are among the most important components of a SIEM detection engine. The detection library spoke in this template previews rules mapped to the MITRE ATT&CK framework, including the ATT&CK matrix categories covering lateral movement, credential access, and initial access scenarios. Each rule card displays the rule name, severity badge, and example KQL snippet so buyers can assess detection depth before deploying.
- Google SecOps reference: Google SecOps ingests raw log data, alerts, and other information, normalizing and indexing it for rapid search. Teams evaluating how this template positions a cloud SIEM against established platforms such as Google SecOps will find the calculator's comparison column and the architecture diagram useful for communicating differentiated value.
- Threat hunting and analyst workflows: The page includes a dedicated area for real-time commands where analysts can trigger manual searches or initiate response actions. The search bar in the hero screenshot and the KQL query examples throughout the detection library spoke support threat hunting workflows. A data analyst or senior SOC engineer evaluating the platform can use these examples to assess query depth before committing to a deployment.
- MITRE ATT&CK alignment: Each detection rule in the library preview is designed to reference a specific tactic from the ATT&CK matrix. Coverage includes scenarios such as a failed login attempt that escalates to lateral movement, a successful login from an unexpected ip address, or a pattern consistent with cloud workloads being accessed outside of approved systems. This alignment gives security teams a structured way to identify gaps in their current rule coverage.
- Audit and access controls: Every command submitted through the page is logged for audit purposes, including the user, timestamp, and command details. Authentication is designed to sit behind multi-factor authentication and single sign-on, ensuring only authorized SOC analysts can access and submit commands. This is consistent with how enterprise SIEM environments configure access for security incidents requiring immediate response.
Theme
Data Command
Creative direction
Calculator/Tool First
Color system
Slate & Sky
Style
Hub & Spoke (Anchor Nav)
Direction
App Download
Page Sections
Interactive Ingestion Cost Estimator
Hub and Spoke Anchor Navigation
Architecture Data Flow Diagram
Detection Rule Library Preview
API Sandbox with Platform Toggle
Hero Product Screenshot Section
Related questions
What sections are included in this landing page template?
Can I modify the detection rules shown in the library preview spoke?
How does the cost calculator compare ingestion pricing?
Is this template suitable for MSSPs managing multiple client environments?
Does the template support a 'Deploy the Agent' call to action with multiple platforms?



