Construction Software & SaaS Cost Calculator Website Template
Jobsite is a construction analytics dashboard landing page template built for general contractors, project controls managers, and owners' representatives. It opens with a live project health estimator, flows into a modular insight card grid, and drives visitors into a demo environment. The industrial Slate & Sky design system keeps every element honest, clear, and built for people who read dashboards before they read emails.
by Rocket studio
Quick summary
Jobsite is a single-page, click-through landing page template for a construction analytics SaaS platform. It leads with an interactive project health estimator, followed by a modular card grid of benchmarking insights organized by construction discipline. The design language is deliberately industrial, charcoal, sky blue, and amber, built for superintendents and project controls professionals who want data, not decoration.
Who this template is for
This template is built for construction technology companies and SaaS founders targeting the commercial construction market. It speaks directly to buyers who live in project data every day and need a landing page that earns trust fast.
- General contractors managing eight-figure ground-up projects who need a credibility-first landing experience
- Project controls managers dealing with scheduling exports and cost overruns who want to see benchmarking results immediately
- Owners' representatives and SaaS teams who need to communicate board-level project performance to decision makers
What problem this template solves
Most construction software landing pages lead with a marketing headline and a screenshot. That approach fails with experienced project professionals who are skeptical of polished claims. This template removes the pitch and replaces it with proof.
- Visitors get a working project health score before they see a single testimonial, which removes the trust gap that kills demo conversions
- Unstructured construction data costs real money, and this template frames that cost visibly using stat callouts and discipline-specific insight cards
- The card grid layout lets buyers browse findings at their own pace instead of being pushed through a linear sales funnel
What you get with this template
You get a fully structured, section-complete landing page template ready to adapt for a construction analytics platform. Every section is pre-planned and purposefully sequenced to move a skeptical construction professional toward a demo click.
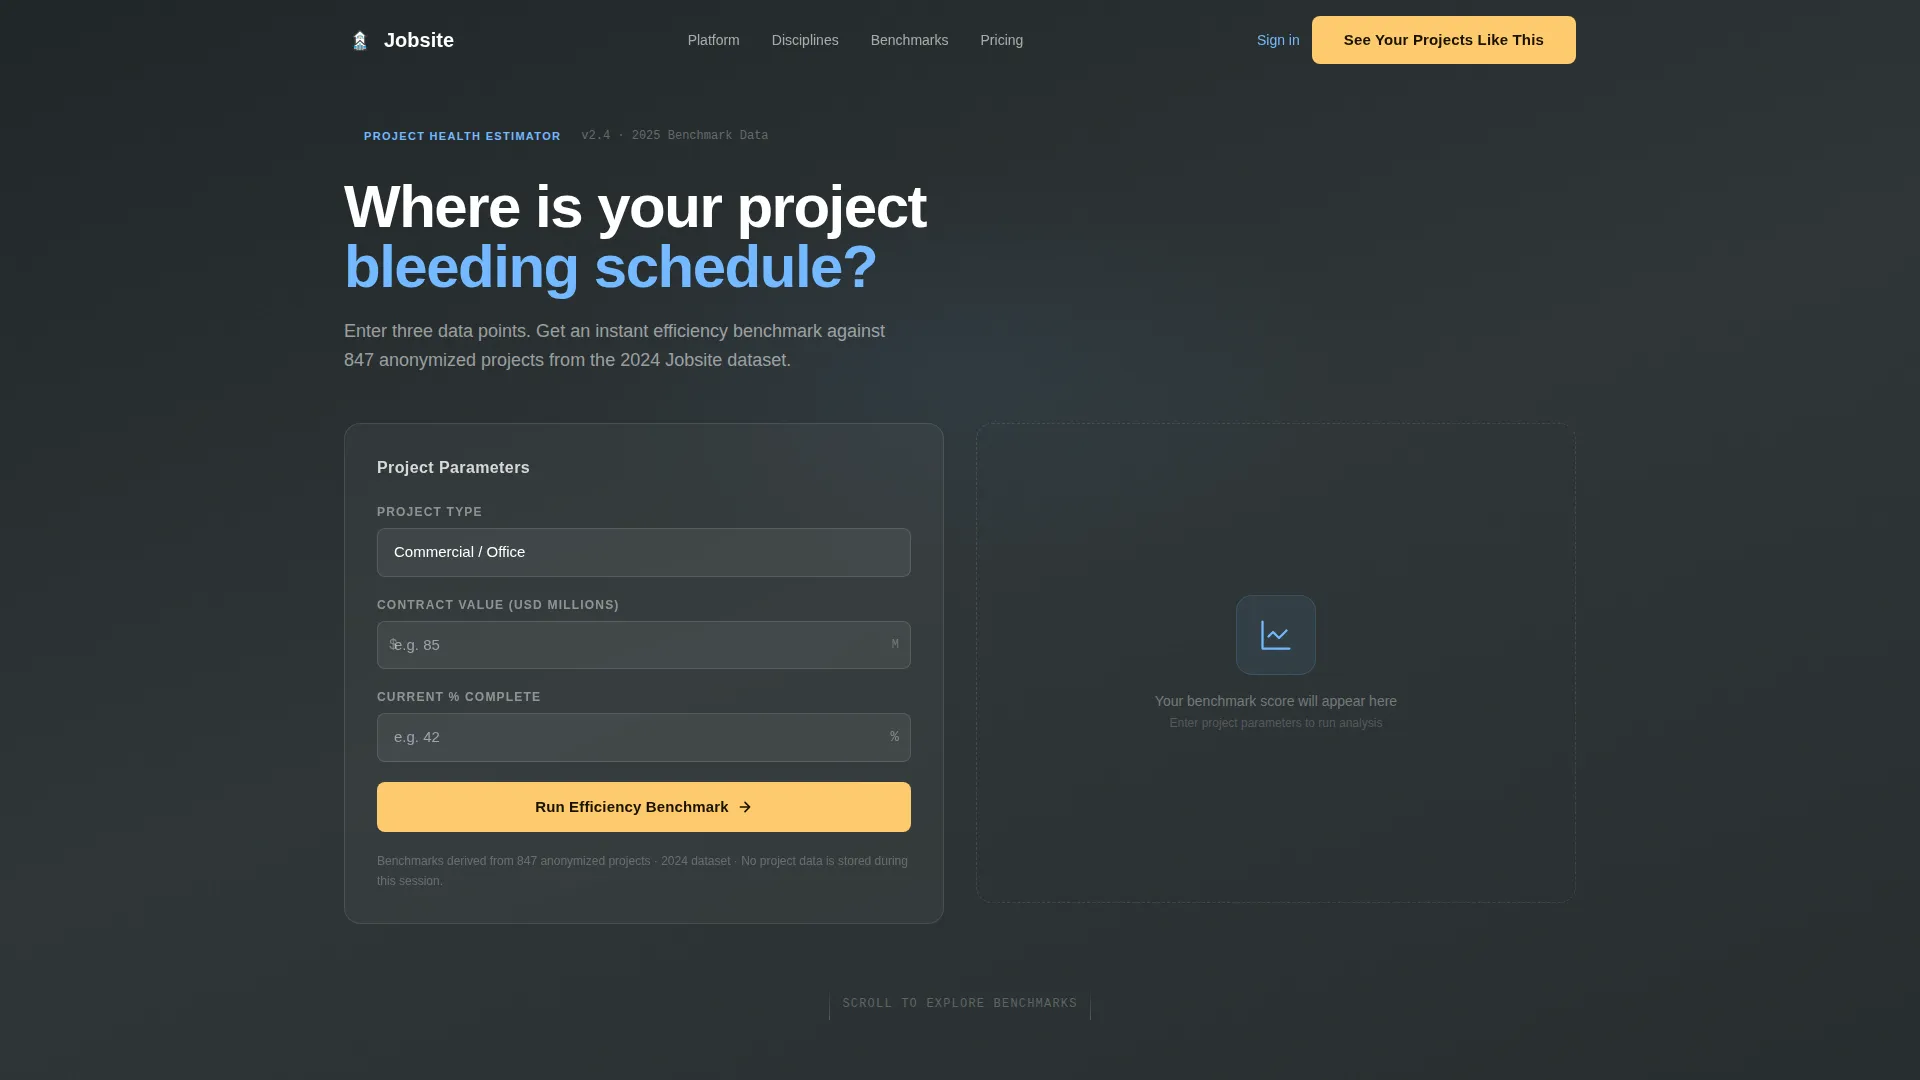
- A hero section built around a live project health estimator with an animated radial gauge, amber and blue segments, and a primary call-to-action that appears immediately after the result renders
- A modular insight card grid with scroll-reveal behavior, card expand overlays with data visualizations, and discipline categories covering scheduling, cost control, labor productivity, and material logistics
- A persistent bottom call-to-action bar, a stat-focused "Cost of Chaos" section, a bento-grid dashboard preview, a testimonial section with role-specific outcomes, and a linear single-row footer
Feature list
This template is built around five purposeful feature areas. Each one connects directly to how construction buyers evaluate software.
Interactive Project Health Estimator
Visitors select project type, input contract value and current percent complete, and receive an instant benchmark score. The result renders as an animated radial gauge using amber and sky-blue segments against a dark slate field. This is the hero element and the primary conversion engine.
Modular Insight Card Grid
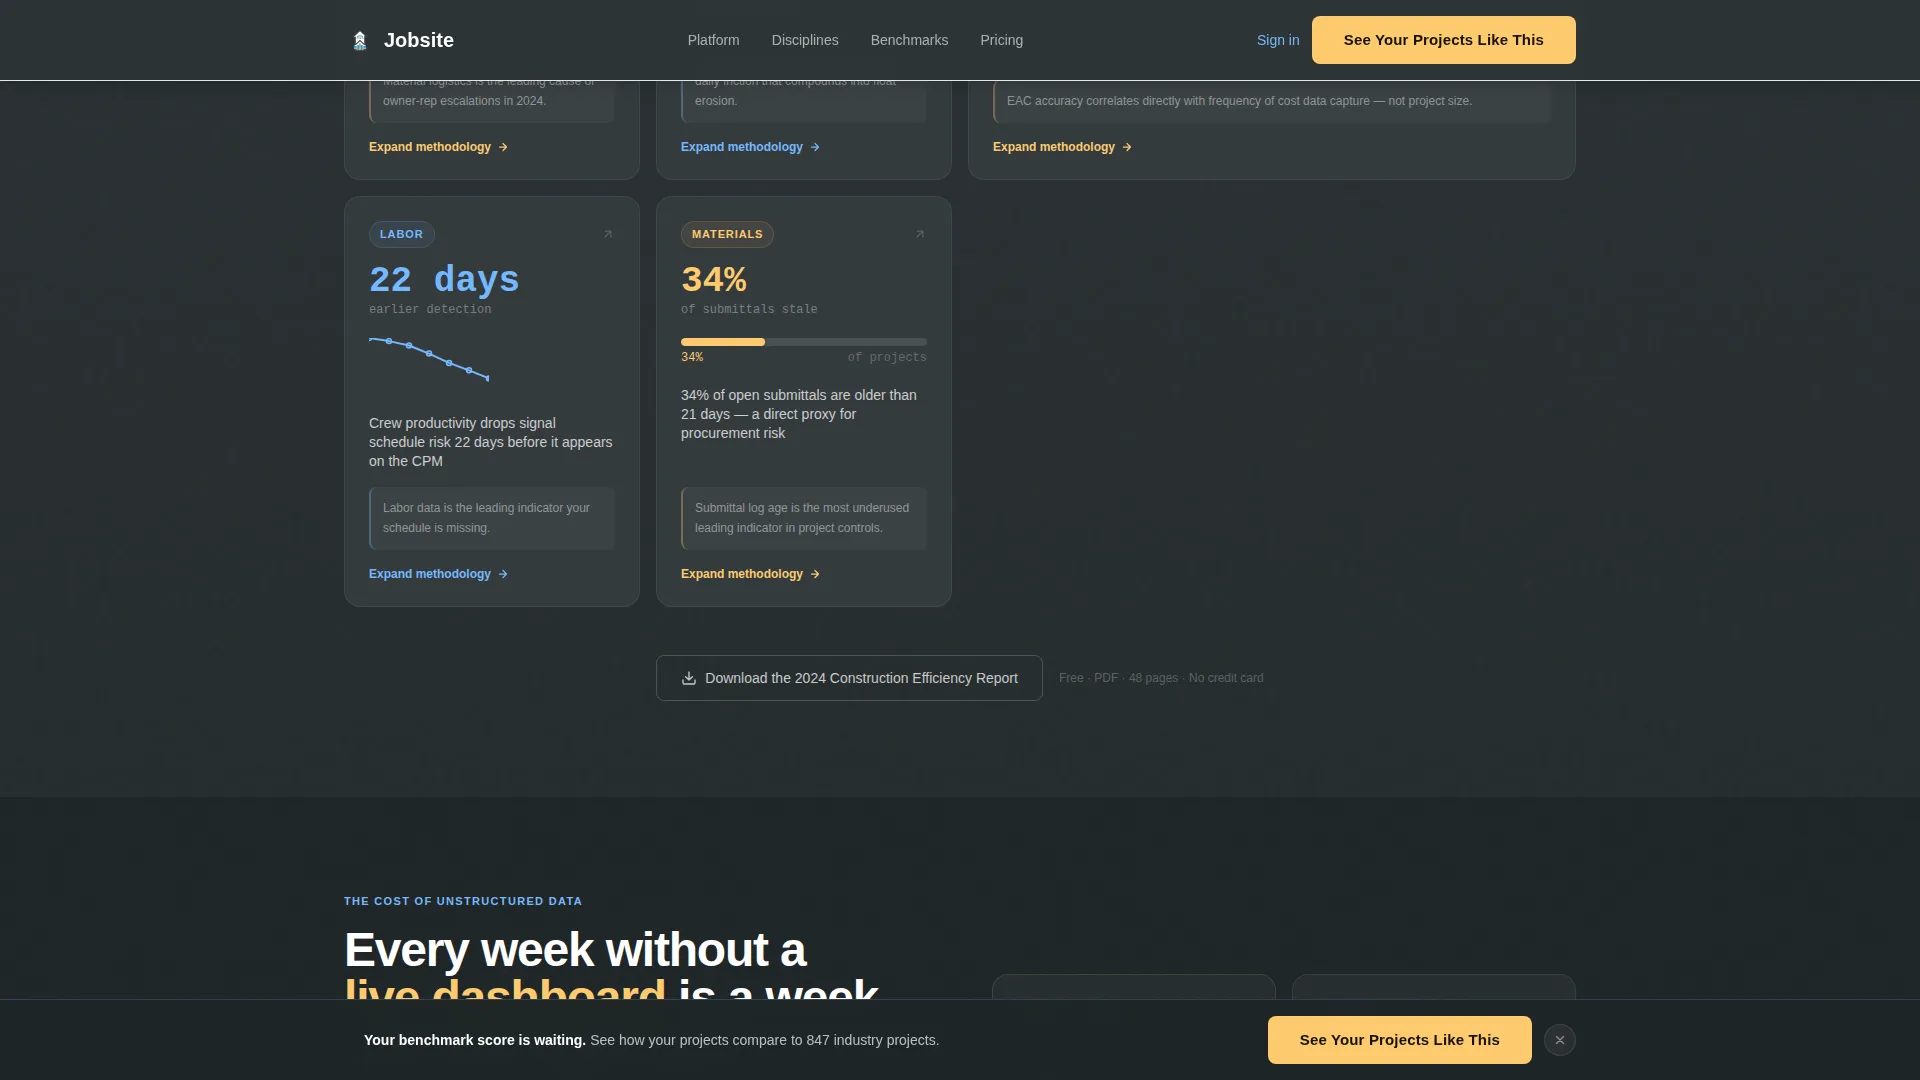
Benchmarking insight cards are organized by construction discipline: scheduling, cost control, labor productivity, and material logistics. Each card shows a single stat, chart thumbnail, or one-line takeaway. Cards scroll-reveal progressively and expand into overlay panels with deeper methodology and data visualizations.
Persistent Bottom Call-to-Action Bar
After the visitor passes the third card row, a fixed bottom bar activates with the primary "See Your Projects Like This" call-to-action. This keeps the conversion path visible throughout the browsing experience without interrupting the content flow.
Dashboard Preview Bento Grid
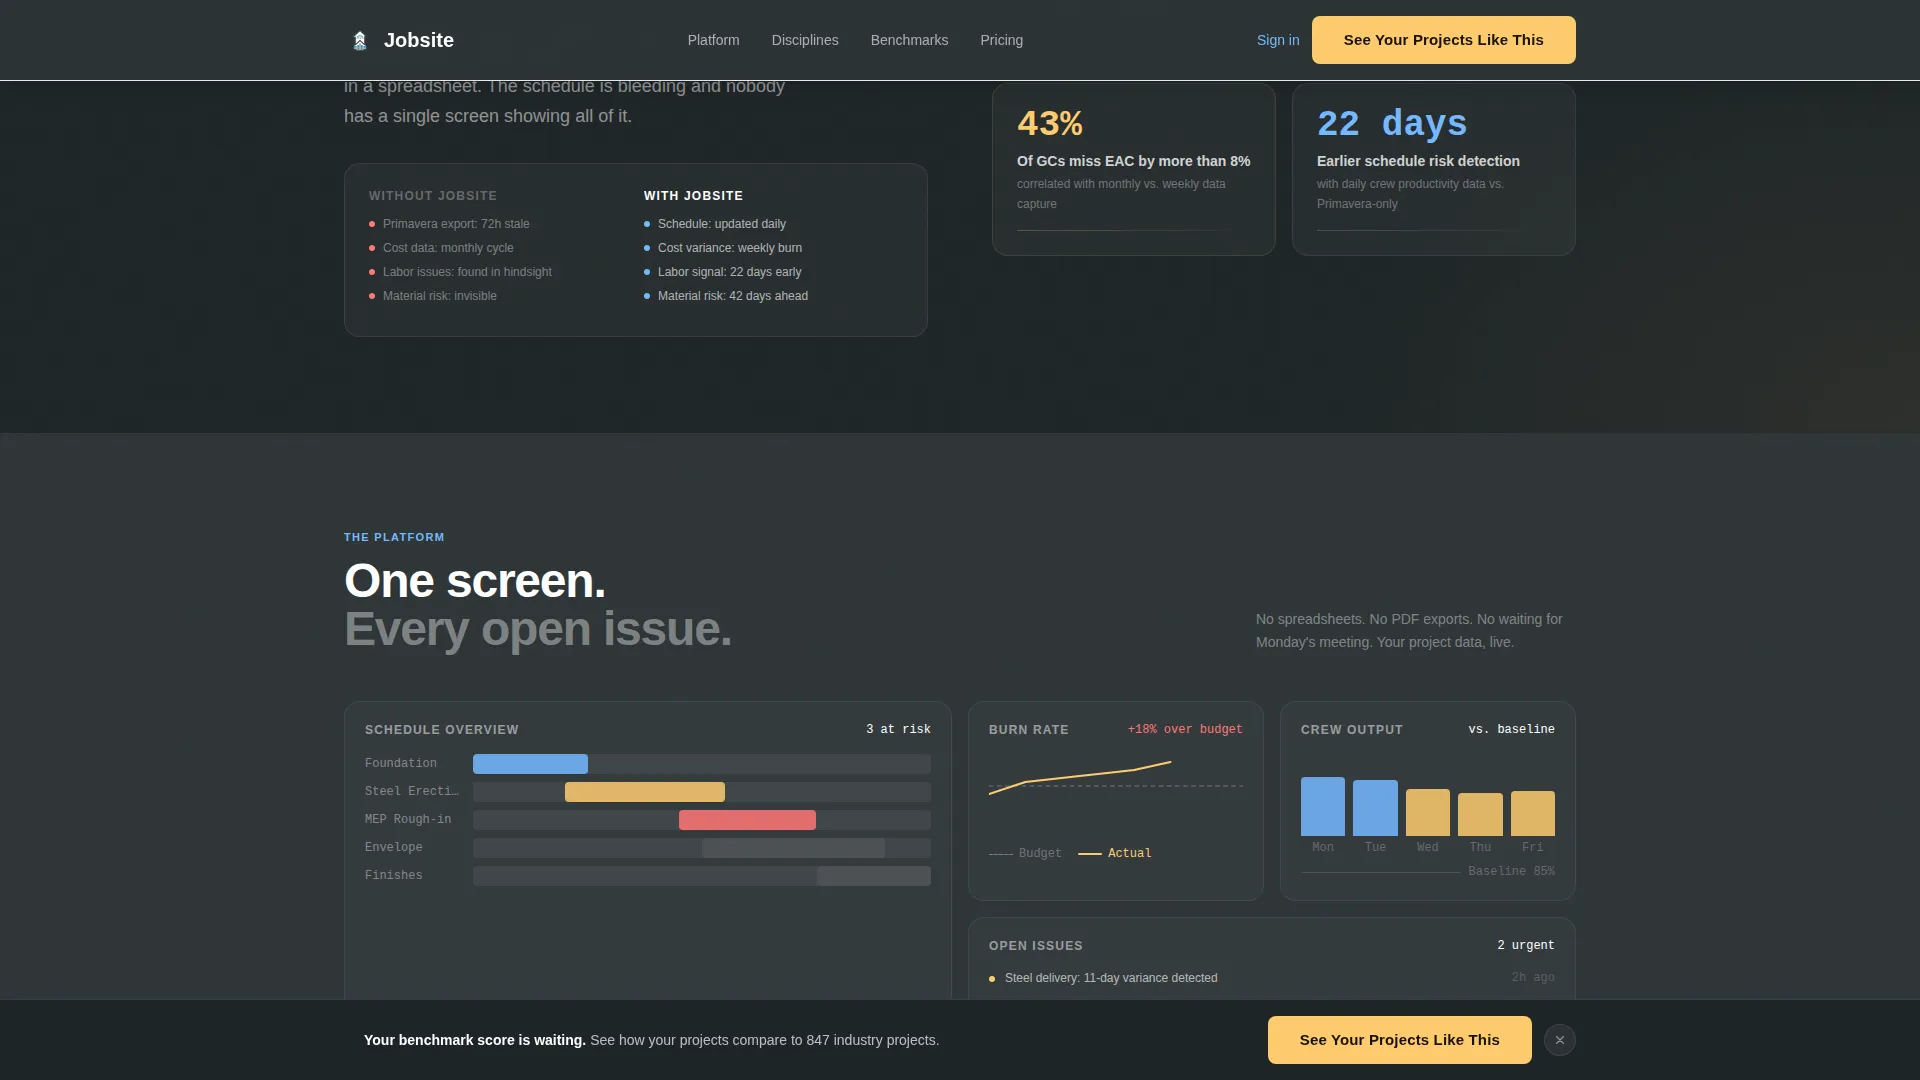
An asymmetric bento grid section displays actual product screen mockups. It gives visitors a visual preview of the dashboard interface before they enter the demo environment, reducing uncertainty at the click-through moment.
Dual Conversion Path Design
The primary call-to-action routes directly to a guided demo sandbox pre-loaded with sample project data. A secondary text link offers a gated PDF report download, capturing email addresses from visitors who are not yet ready to click through.
Testimonial Section with Project-Specific Outcomes
Social proof cards include named roles, eight-figure project values, and specific efficiency outcomes. This format mirrors the industry report aesthetic and reinforces credibility with the exact audience the platform serves.
Page sections overview
| Section | Purpose |
|---|---|
| Hero Estimator | Interactive project health scorer with animated gauge and primary call-to-action |
| Insight Card Grid | Discipline-organized benchmarking cards with scroll-reveal and expand overlays |
| Cost of Chaos | Large stat callouts quantifying the dollar impact of unstructured project data |
| Dashboard Preview | Asymmetric bento grid of actual product screen mockups |
| Social Proof | Role-specific testimonial cards with project values and a report download link |
| Footer | Linear single-row footer with minimal navigation |
Design & branding system
The visual identity follows a Slate & Sky color system with a Directory & Discovery theme. The aesthetic is intentionally industrial, no stock photography, no decorative illustration, just structured data laid clean.
- Core palette uses deep charcoal (#2D3436) for backgrounds, rebar gray (#636E72) for secondary text, open-sky blue (#74B9FF) for all interactive states including hover, progress bars, and active filters, and safety-vest amber (#FDCB6E) reserved exclusively for alerts, calls-to-action, and data spikes
- Cards float on #F5F6FA with subtle 1px borders, creating visual separation without adding weight to the slate-dominant layout
- Typography uses DM Sans for display and body text, and JetBrains Mono for all data values and numerical outputs, reinforcing the dashboard aesthetic throughout
Mobile & speed optimization
The template is built desktop-first, reflecting the reality that its primary users open laptops and tablets on job sites. It remains fully mobile-responsive for all sections.
- Server Components handle all static sections to keep initial load lean, while Client Components are scoped to the interactive estimator and card overlay elements
- Animation scope is purposeful: the radial gauge animates on result render, cards stagger into view on scroll, and the bottom call-to-action bar slides in after the third card row without blocking content
How this template helps you convert
The conversion architecture is built around a single insight: showing construction professionals their own benchmark score creates more urgency than any headline could.
- The estimator delivers a personalized project health result before asking for anything, making the value of the full platform immediately tangible and giving visitors a specific reason to want their real data inside the tool
- The persistent bottom call-to-action bar and the discipline-organized card grid work together to hold attention across the full page, so visitors who do not convert at the estimator have multiple natural re-entry points before reaching the footer
Other information about this template
This template is designed specifically for the construction analytics SaaS market and works well for companies targeting the general contractor, project controls, and owner's representative segments. It is built to reflect the Industry Report creative direction and the Click-Through landing page structure from the matched intersection context.
- The template style is Card Grid (Modular), making it straightforward to add or remove discipline categories as a product's feature set evolves
- Localization defaults are set for the United States market: USD currency, MM/DD/YYYY date formatting, and imperial measurements throughout
- Animation intensity is high by design, with the staggered card grid, animated gauge, and persistent bar all working together to create a living-dashboard feel that mirrors the product itself
- The template is categorized under Technology and Construction Software and SaaS, making it relevant for construction project management platforms, field analytics tools, and scheduling intelligence products

Theme
Directory & Discovery
Creative direction
Industry Report
Color system
Slate & Sky
Style
Card Grid (Modular)
Direction
Click-Through
Page Sections
Interactive Project Health Estimator
Modular Discipline Card Grid
Persistent Bottom Call to Action Bar
Dual Conversion Path
Dashboard Preview Bento Grid
Role-specific Social Proof Cards
Related questions
Can I adapt this template for a different construction software product?
Does the estimator work out of the box, or does it need custom development?
Is there a contact form included on this landing page?
Who is the intended audience for this template?
What typography and color settings come with this template?



