Cloud & DevOps Professional Website Template
Kube is a dark-themed, dashboard-style landing page template built for container orchestration platforms. It features a three-tab interactive header, animated live-metric counters, an incident timeline, a self-healing demo section, and a CLI install block with clipboard copy. The design uses a Tech Glass aesthetic with void black, toxic green, and electric cyan to mirror a live production environment.
by Rocket studio
Quick summary
Kube is a single-page landing page template designed for container orchestration tools. It opens with an interactive Feature Tab Switcher showing Deploy, Observe, and Scale views. A Stats-First scroll flow leads visitors through animated metrics and data stories. The primary call to action drives Command Line Interface (CLI) app downloads with a one-click copy block and a hosted sandbox link.
Who this template is for
This template is built for teams and individuals who ship, monitor, and scale containerized infrastructure for a living. It speaks directly to the people who are on-call when things break and who need a product page that earns trust fast.
- Platform engineers debugging cascading failures across multi-cluster environments
- DevOps leads managing dozens of microservices across multiple cloud providers
- Site Reliability Engineers (SREs) who need to communicate uptime and recovery credibility quickly
What problem this template solves
Container orchestration tools are powerful, but their landing pages often look generic. They fail to communicate real capability to technical audiences who can spot shallow marketing instantly. Kube solves that gap by making the interface the product shot.
- Generic tech pages lose platform engineers within seconds because they feel like brochures
- Metrics without evidence feel like noise to SREs who live inside monitoring dashboards all day
- A weak call-to-action flow fails to convert visitors who need to see the tool work before they install it
What you get with this template
You get a fully structured, single-page landing page built around a dashboard-first experience. Every section is purposefully sequenced to move a skeptical technical visitor from curiosity to download.
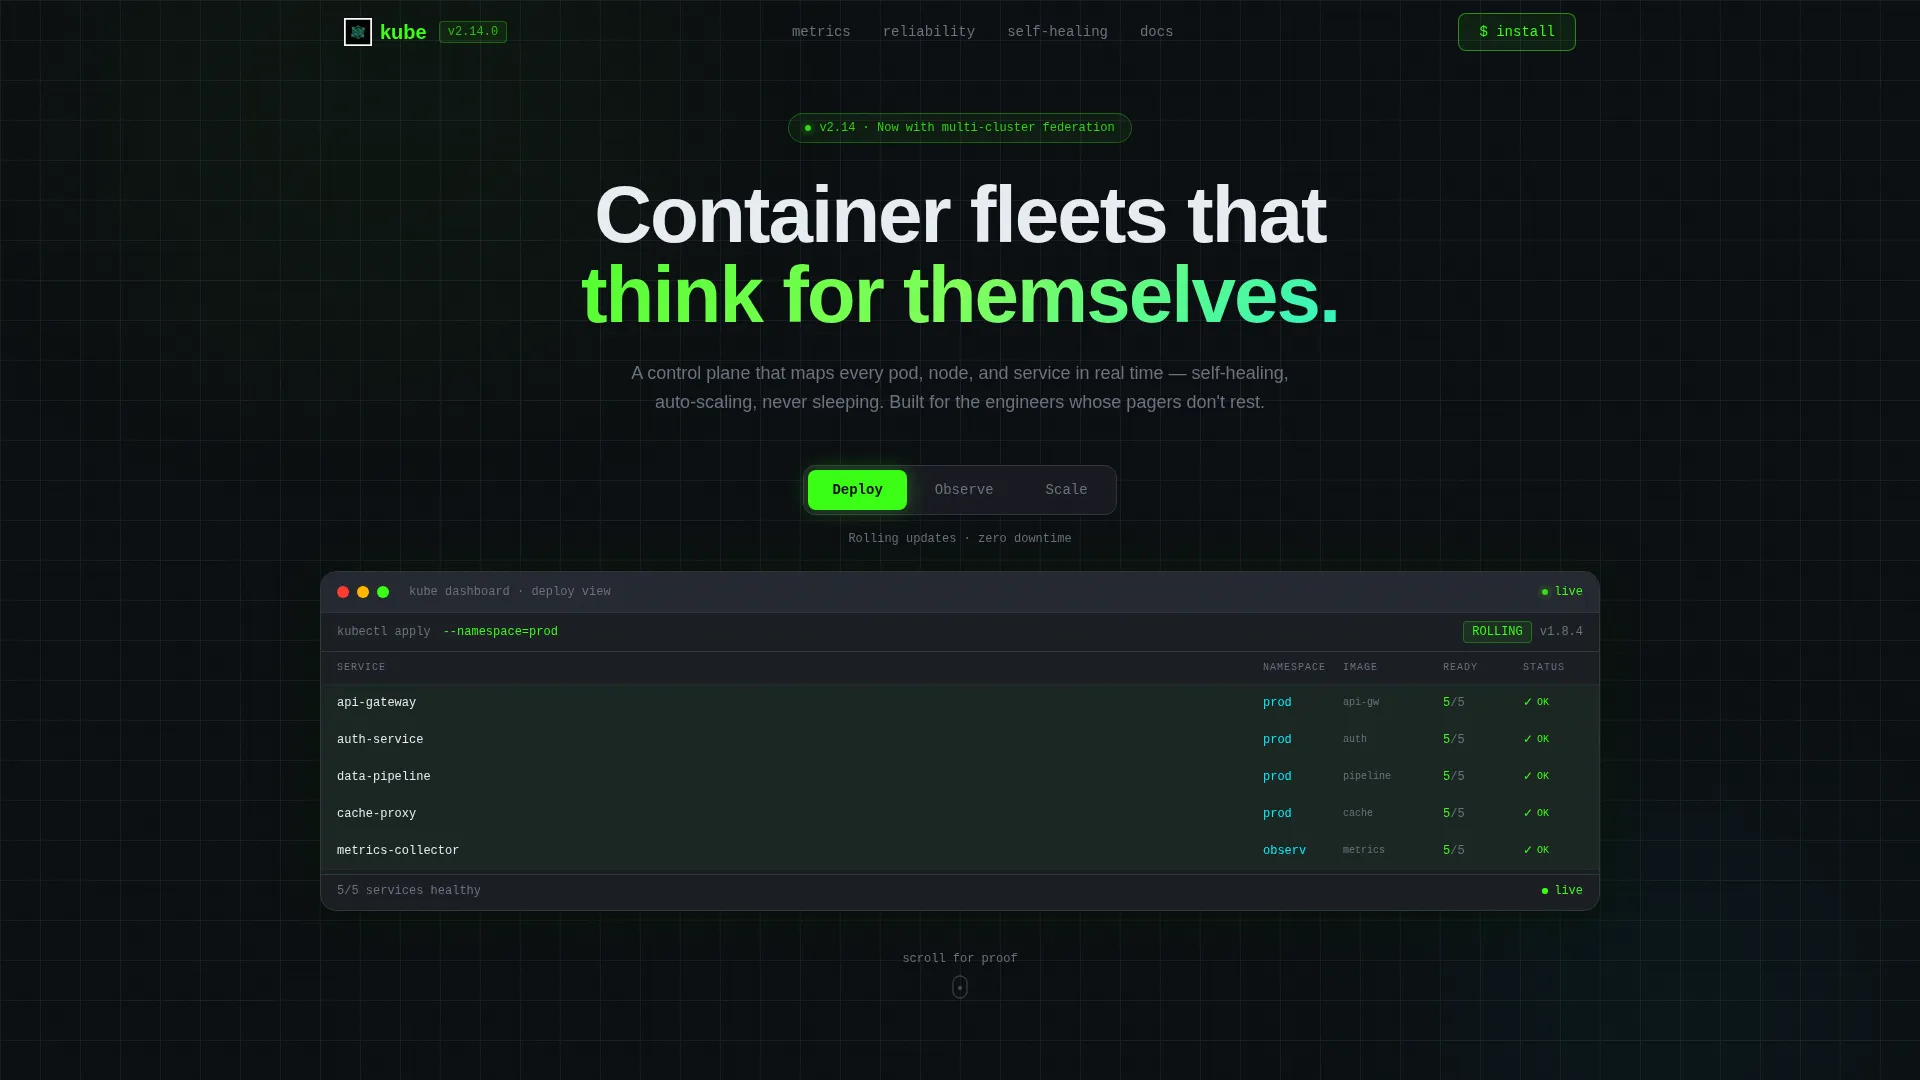
- An interactive three-tab header mockup showing Deploy, Observe, and Scale views with animated state transitions
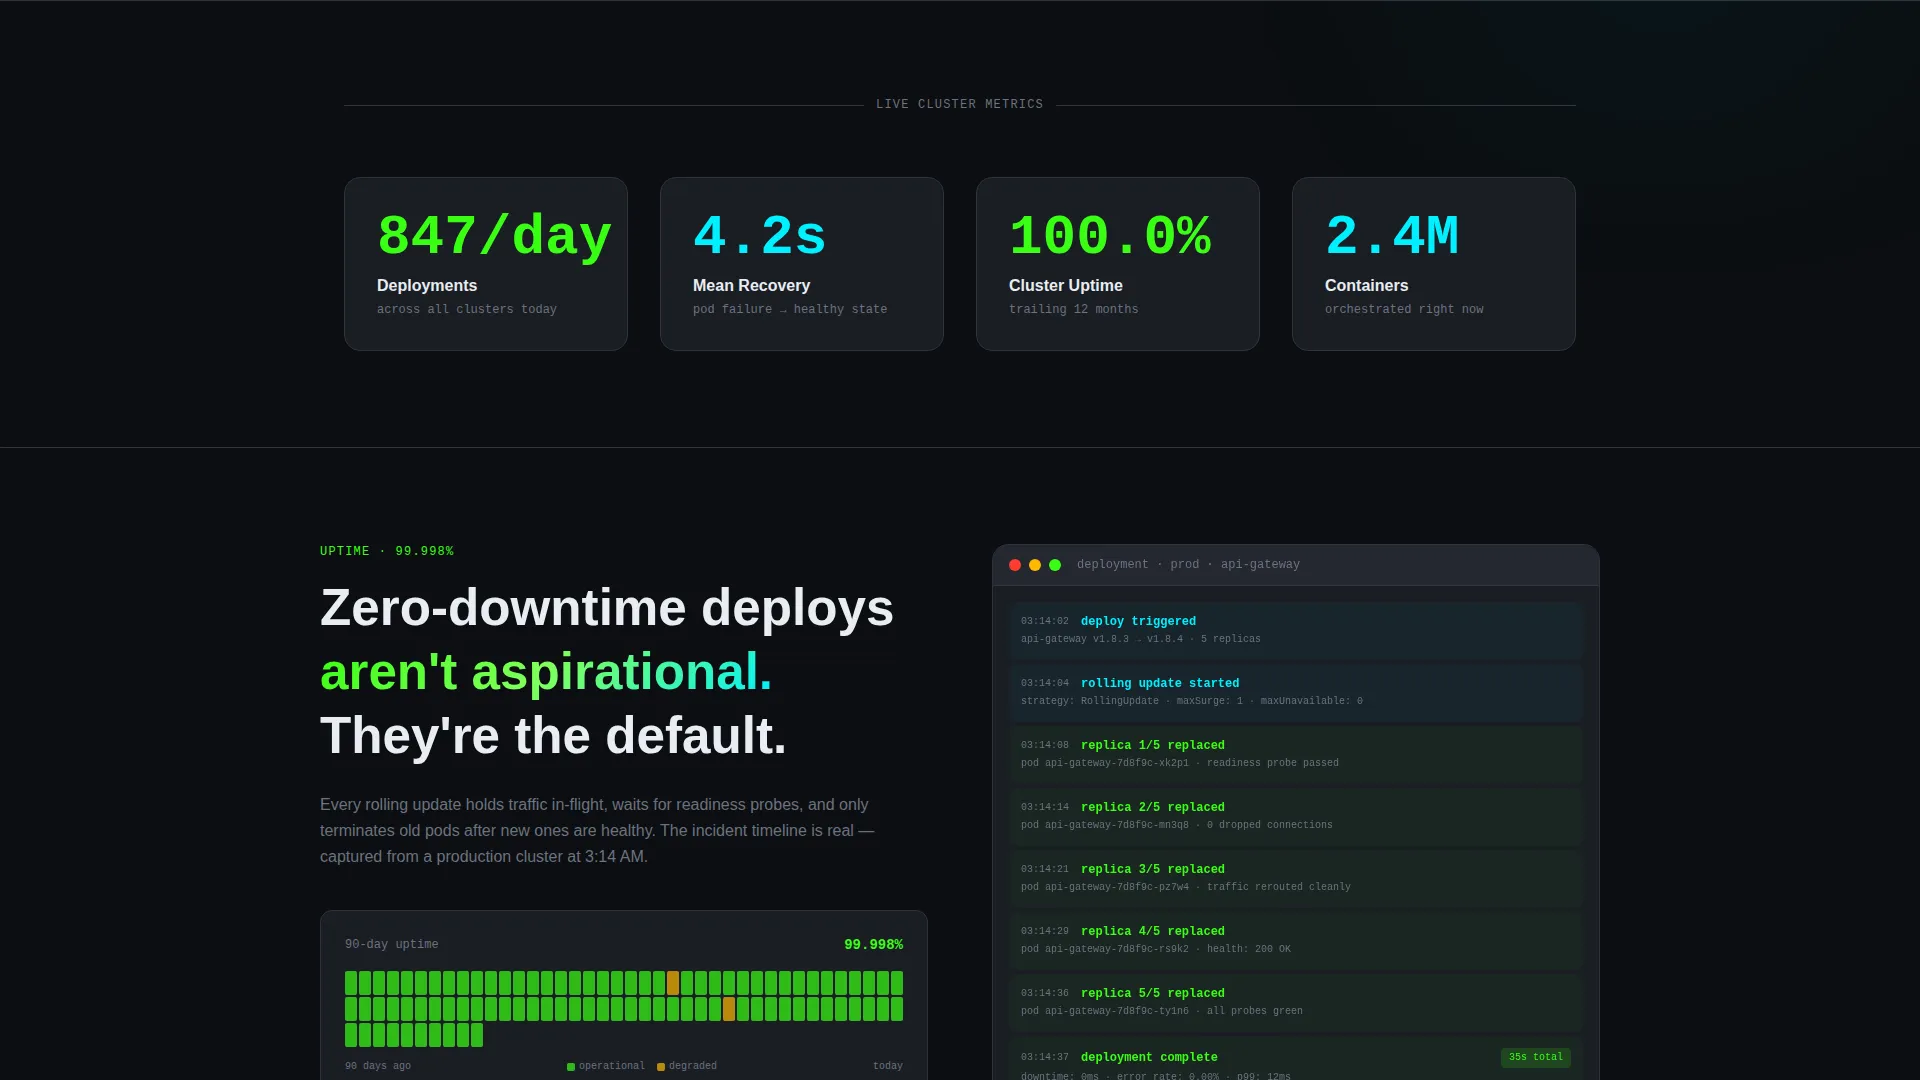
- A Stats-First scroll sequence with four animated counters for deployment frequency, mean recovery time, cluster uptime, and containers orchestrated
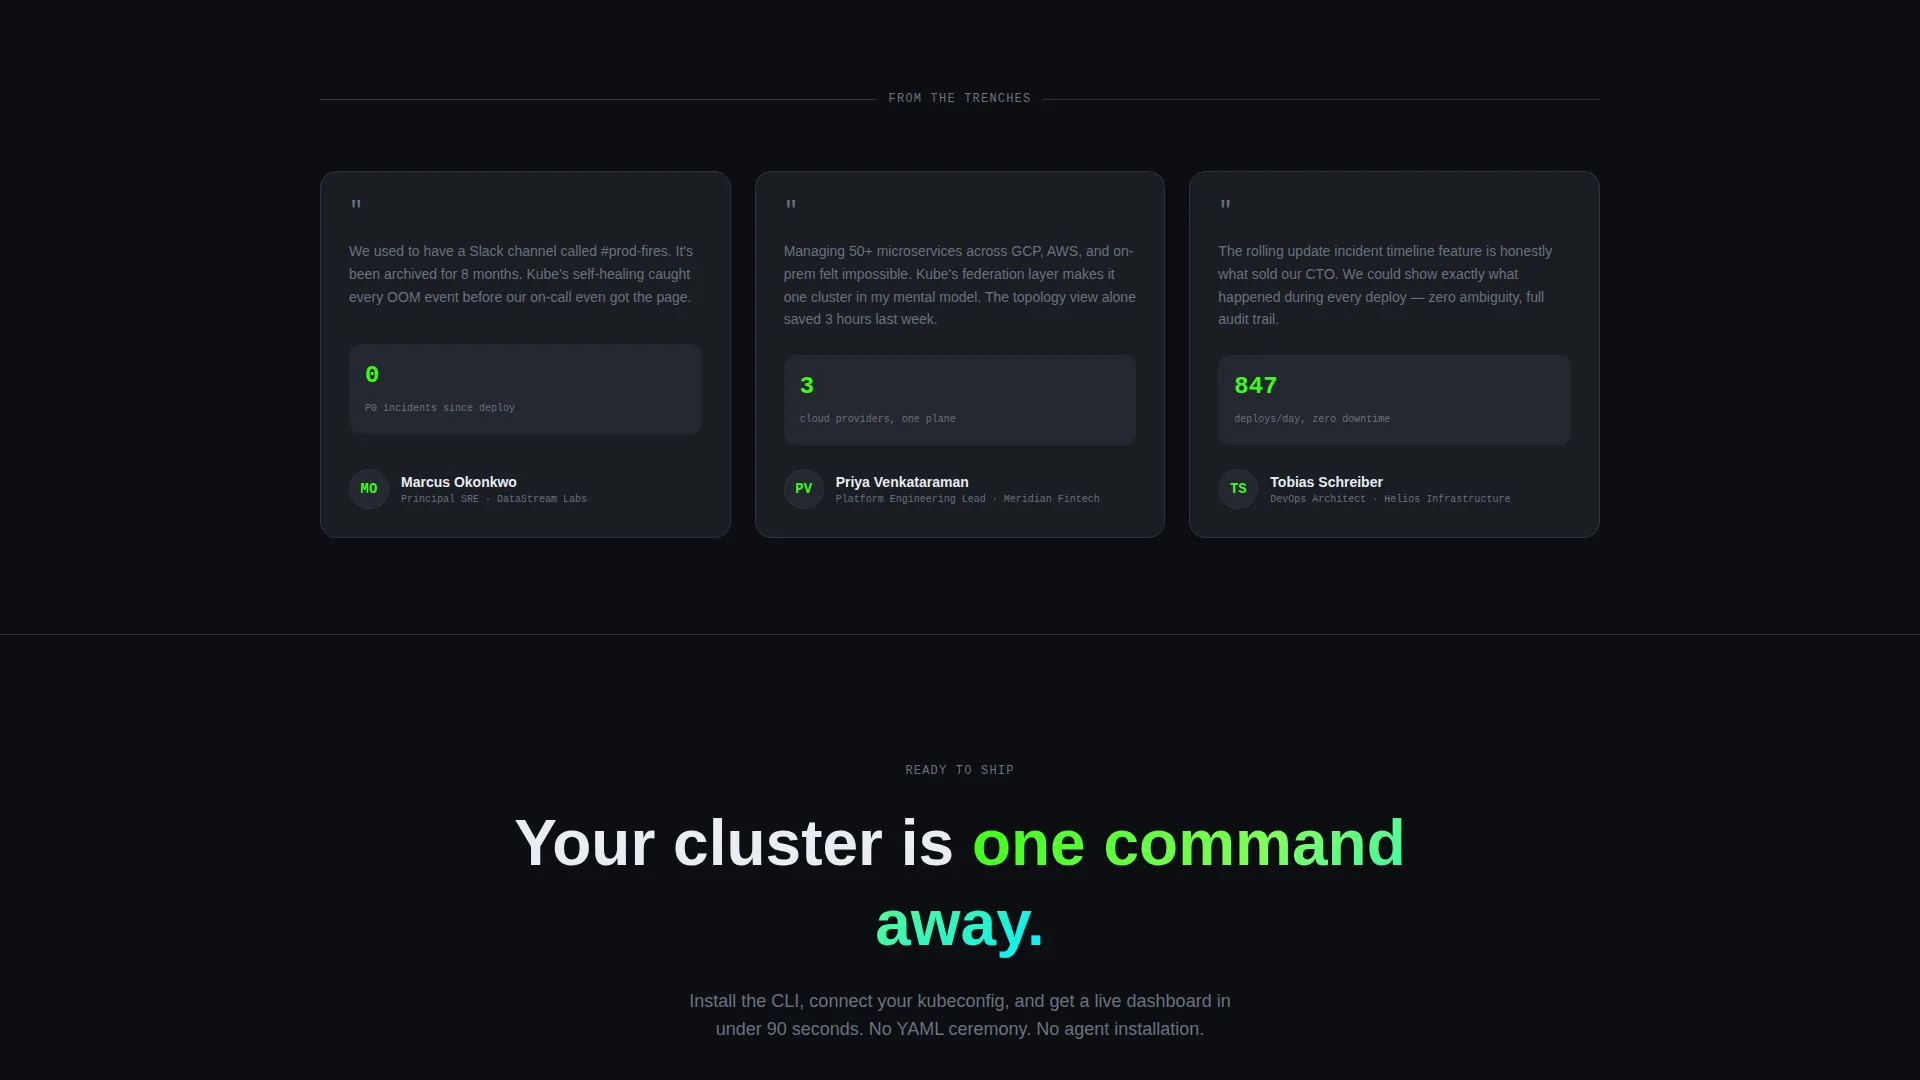
- A CLI install block with platform toggle (macOS, Linux, Windows), a one-line terminal command, and a clipboard-copy button that confirms with a green flash
Feature list
This template delivers a focused set of interactive and visual components. Each one is grounded in the dashboard-first design philosophy described in the brief.
Interactive Feature Tab Switcher
The header contains three clickable tabs labeled "Deploy," "Observe," and "Scale." Each tab renders a distinct dashboard state: a rolling deployment with replica counts climbing, a topology map with latency heatmaps, and an auto-scaling graph with pod spawn animations. The interface mockup is the hero visual.
Animated Stats Counter Row
Four large metric numbers sit immediately below the fold. Each counter animates from zero on scroll-enter using an easing curve that mimics a live monitoring wall ticking upward. The metrics cover deployment frequency, mean recovery time, cluster uptime percentage, and containers orchestrated.
Data Story Sections
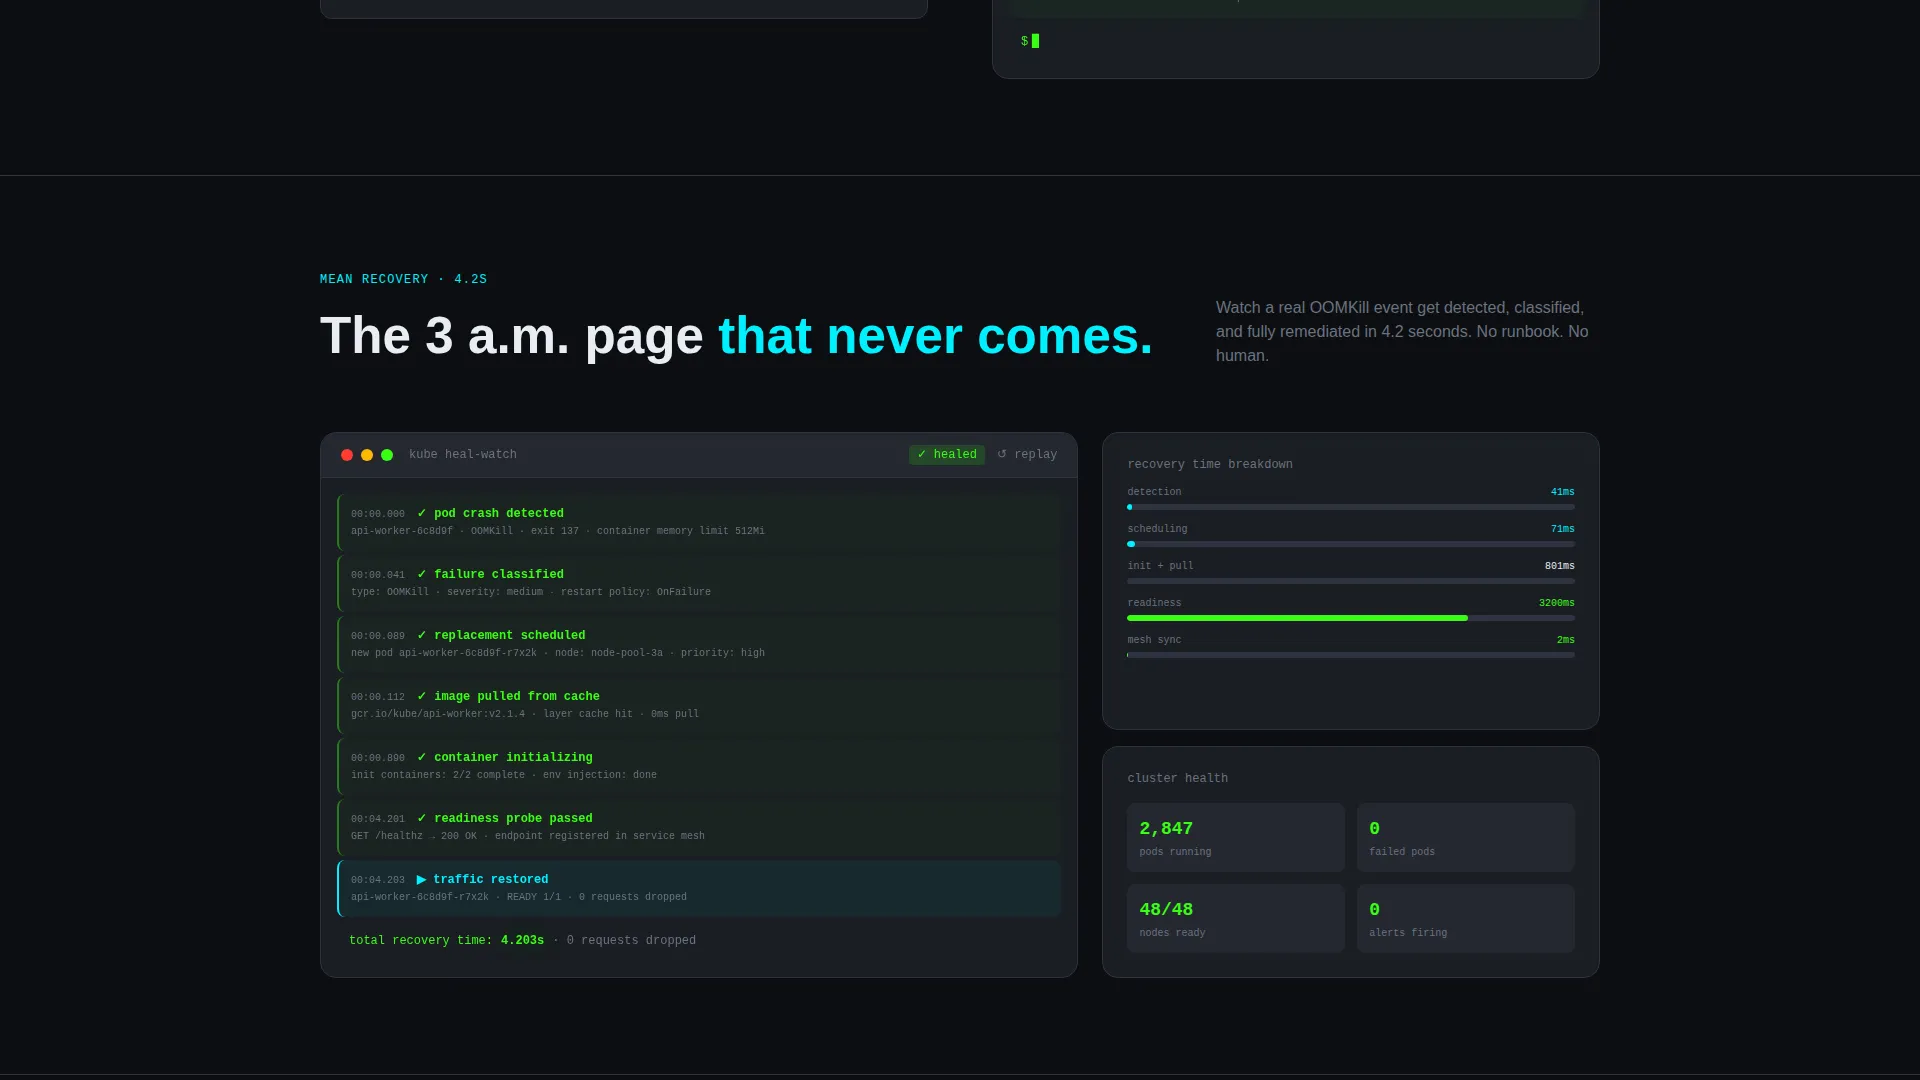
Each stat expands into a full evidence section as the visitor scrolls. The uptime number opens into a zero-downtime incident timeline. The recovery metric reveals a failure-injection demo with self-healing steps visualized one by one. Every section leads with the number, then backs it up.
CLI Install Block with Platform Toggle
The primary call-to-action section includes a platform selector for macOS, Linux, and Windows. Selecting a platform renders the correct one-line install command inside a styled terminal code block. A copy button confirms the clipboard action with a green flash.
Hosted Sandbox Secondary call to action
Below the primary CLI block, a secondary call to action links visitors to a hosted sandbox environment. This gives visitors who are not ready to install a low-friction path to experience the product.
Tech Glass Dashboard Aesthetic
The visual system uses monospace typography, tight data grids, and no decorative imagery. Card surfaces in deep graphite float over a void-black background. Toxic green status indicators and electric cyan hover states make the page feel like a live server rack, not a marketing site.
Page sections overview
| Section | Purpose |
|---|---|
| Feature Tab Header | Showcases Deploy, Observe, Scale views interactively |
| Animated Stats Row | Anchors credibility with four live-style metric counters |
| Uptime Story Section | Expands the uptime stat into a zero-downtime incident timeline |
| Recovery Demo Section | Visualizes self-healing with a failure-injection walkthrough |
| CLI Install Block | Drives app download with a platform-aware terminal command |
| Sandbox Secondary call to action | Offers a hosted trial path for visitors not ready to install |
Design & branding system
The visual identity follows a Tech Glass theme built on an Acid Digital color palette. Every design decision reinforces the feeling of a live, healthy production environment viewed through a rack-mounted server room at 2 a.m.
- Void black (#0B0E11) as the primary background, reading like an open terminal with nowhere to hide
- Toxic green (#39FF14) for live-state indicators and primary data highlights that pulse like a health-check heartbeat
- Electric cyan (#00F0FF) on secondary metrics and interactive hover states, with deep graphite (#1A1D23) for card surfaces and panel borders that feel like frosted glass
Mobile & speed optimization
The template is structured for responsive display across device sizes. The dashboard-first layout adapts so that the interactive tab switcher and data grids remain readable and functional on smaller screens.
- Monospace typography and tight grid layouts scale cleanly without breaking the terminal-window feel
- Animated counter sections use scroll-enter triggers, keeping heavy transitions off-screen until needed
- The CLI copy block and platform toggle are touch-friendly and sized for comfortable use on mobile viewports
How this template helps you convert
Kube is built around a proof-first narrative. Visitors interact with the product before they reach the call to action, which dramatically reduces friction at the download step.
- The tab switcher in the header puts a working dashboard simulation in front of every visitor before they scroll, establishing product credibility immediately
- The Stats-First scroll sequence pairs every bold metric with a data story section, so by mid-page the visitor has already seen the evidence behind each claim
- The CLI install block with platform toggle and clipboard copy removes the final friction point, turning "I want to try this" into a single command copied in one click
Other information about this template
This template is categorized under Technology, Cloud and DevOps, and Container Orchestration. It is designed as a single-page landing page, not a multi-page website. The Tech Glass theme and Acid Digital color system are purpose-built for developer and infrastructure audiences who expect precision, not decoration.
- The template style is Dashboard and Data Grid, meaning visual components double as both user interface demonstration and marketing content
- The creative direction is Stats-First Impact, a scroll narrative where every section earns the metric it leads with
- The header concept is a Feature Tab Switcher, which is a proven pattern for showing multi-mode products without requiring multiple pages
- The landing page direction is App Download, meaning all conversion paths point toward CLI installation or sandbox trial, not a contact form or pricing page
Theme
Tech Glass
Creative direction
Stats-First Impact
Color system
Acid Digital
Style
Dashboard/Data Grid
Direction
App Download
Page Sections
Interactive Feature Tab Switcher
Animated Stats Counter Row
Proof-driven Data Story Sections
CLI Install Block with Platform Toggle
Hosted Sandbox Secondary Call to Action
Tech Glass Dashboard Aesthetic
Related questions
Who is the primary audience for this template?
Does the template include actual CLI or backend functionality?
Can I change the color palette or swap the metric values?
Is this template suitable for a SaaS product page or only for open-source tools?
What makes this different from a generic tech landing page template?



