Cloud & DevOps Cost Estimator Website Template
Mesh is a dark-themed, dashboard-style service mesh landing page template built for developer infrastructure platforms. It features a live Latency and Cost Estimator hero, an animated topology map, a before-and-after metrics panel, and a terminal deploy block. The Carbon Fiber color system and mission-control aesthetic give SRE and platform engineering audiences an immediate sense of technical credibility.
by Rocket studio
Quick summary
Mesh is a single-page, dashboard-style service mesh landing page template designed for B2B developer infrastructure products. It combines a live ROI calculator hero, an animated service topology map, a before-and-after metrics panel, and a terminal deploy block into one high-momentum scroll experience. The Carbon Fiber color system and Data Command theme speak directly to SREs and platform engineers who manage complex microservice networks every day.
Who this template is for
This template is built for teams shipping service mesh platforms, control plane products, or microservice networking tools to a technical audience. It assumes your buyers already know what a service mesh does and need proof that yours is worth deploying.
- SREs and platform engineers managing dozens or hundreds of services in Kubernetes who need to see real latency and cost data before committing to a tool.
- CTOs and VP Engineering who are evaluating zero-trust security posture and want a clear narrative around network traffic encryption and compliance.
- Developer infrastructure founders and product teams who want a conversion-optimized landing page that proves value through live interaction, not marketing copy.
What problem this template solves
Platform teams promoting a service mesh product face a specific challenge: their audience is deeply skeptical of vague claims. SREs want numbers, not narratives. A generic landing page full of feature bullets and stock photography loses these users in seconds.
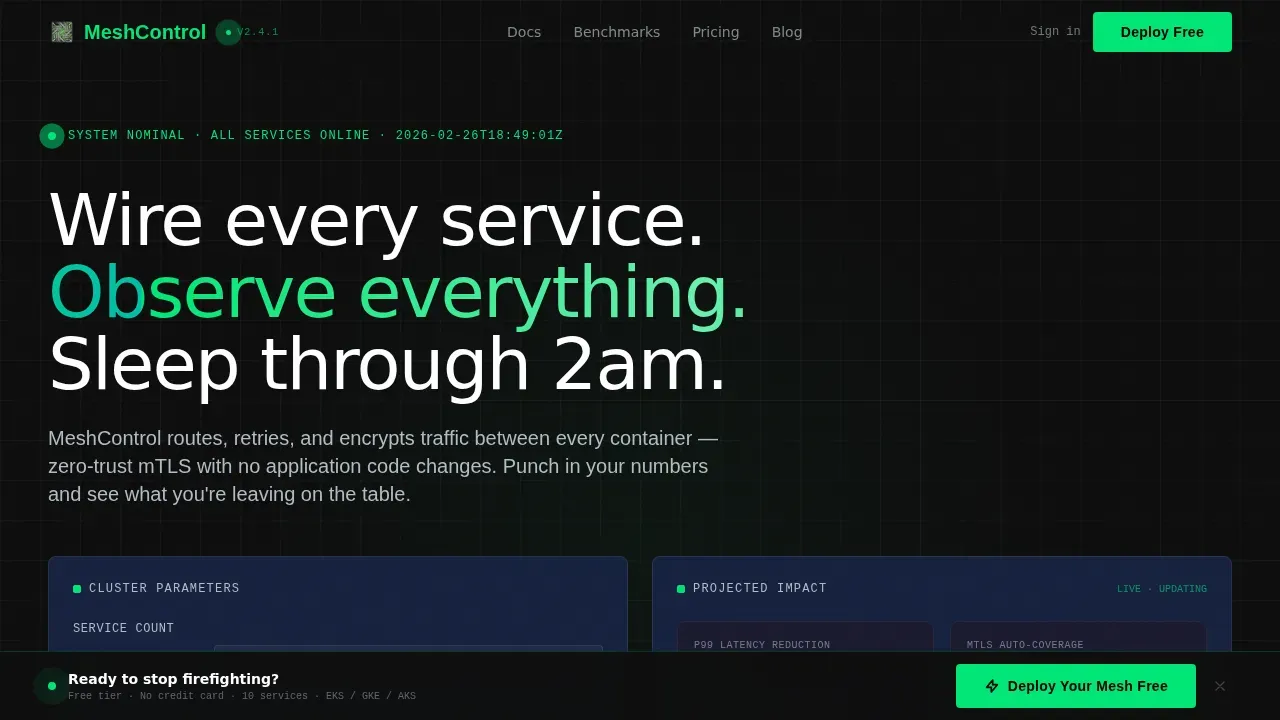
- No proof, no trust. This template solves the credibility gap by making the hero section a live Latency and Cost Estimator. Visitors input their service count, requests per second, and cloud provider, and the data grid immediately renders projected results.
- Slow scroll momentum. Most technical landing pages feel flat after the hero. Mesh uses a Launch Energy pacing model, where each section feels like another system coming online, building toward a complete, connected control plane.
- High friction sign-up flows. The freemium call-to-action requires no credit card. A two-step flow handles GitHub or SSO sign-in, then cluster selection, keeping the path from curiosity to a running mesh as short as possible.
What you get with this template
You get a fully structured, ready-to-customize service mesh landing page with every section built and sequenced. The layout is desktop-first, reflecting the monitor-heavy workflows of the SRE and platform engineering audience this template targets.
- Five purpose-built page sections covering the calculator hero, topology map, metrics panel, terminal deploy block, and social proof, plus a linear single-row footer.
- Carbon Fiber visual system with deep cockpit black (#0D0D0D) backgrounds, woven carbon gray (#1A1A2E) panels, signal green (#00E676) accents, and titanium silver (#B0BEC5) secondary text, all pre-configured and consistent across every component.
- High-interactivity components including a live calculator with real-time animated output, a persistent bottom call-to-action bar, scroll-triggered section reveals, topology SVG path animations, and a terminal typewriter block, all built in from the start.
Feature list
This template includes purpose-engineered sections and components that map directly to how technical buyers evaluate a service mesh product.
Live Latency and Cost Estimator Hero
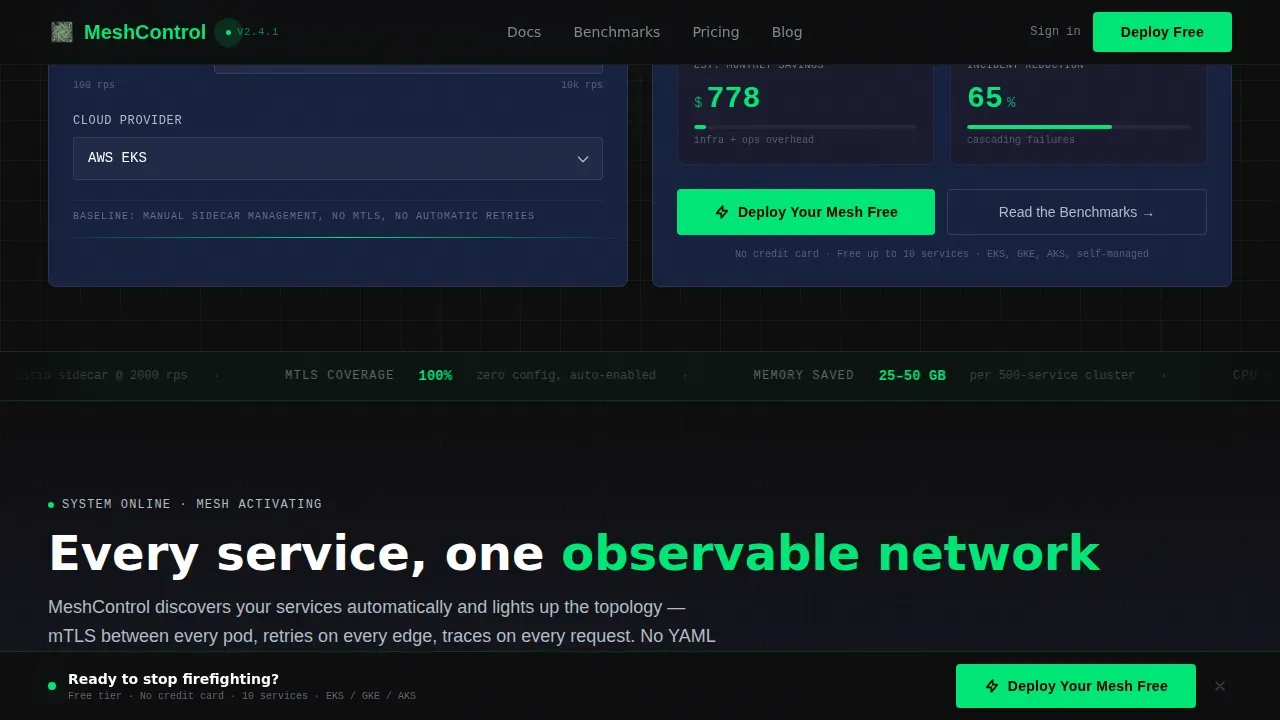
The hero section is an interactive data grid, not an image. Visitors enter their current service count, average requests per second, and cloud provider. The calculator instantly renders projected p99 latency reduction, mutual TLS (mTLS) coverage percentage, and estimated monthly savings versus manual sidecar management. Numbers animate upward in signal green as inputs change, mimicking a live telemetry feed. This approach lets the template prove value before a visitor reads a single paragraph of body copy.
Animated Service Topology Map
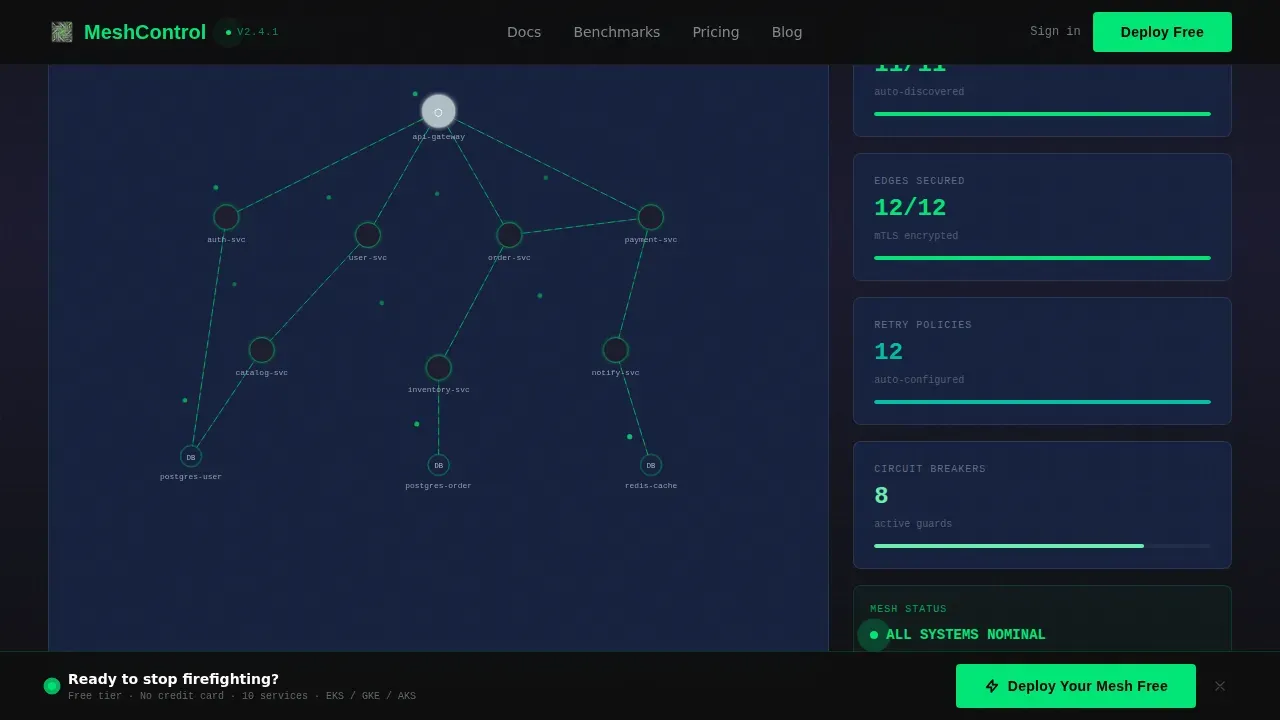
After the calculator section, an animated topology map lights up connections between services as the mesh comes online. This visual reinforces how a service mesh architecture links every microservice into a single observable network, handling service to service communication, east west traffic between pods, and connections to external networks. The animation runs on scroll trigger, giving the section a satisfying reveal cadence that matches the Launch Energy pacing of the full page.
Before and After Metrics Panel
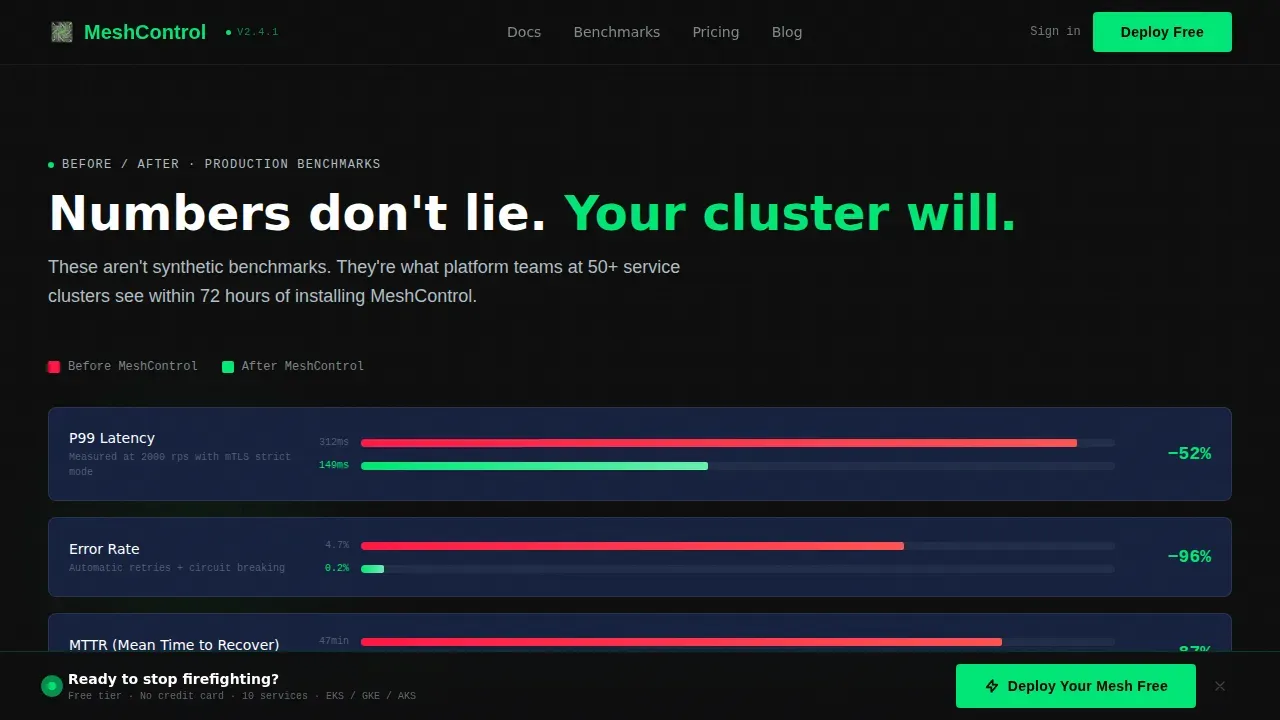
A dedicated metrics panel shows concrete before-and-after comparisons for error rates, p99 latency, and mTLS coverage. This section addresses the core value of a service mesh data plane: the data plane intercepts all packets in a request and handles routing, load balancing, authentication, and authorization automatically. Named engineer testimonials with company and role context accompany the metrics, grounding the numbers in real-world deployment outcomes rather than vendor projections.
Terminal Deploy Block
The deployment section renders a live terminal block showing a meshctl install following command. The timeline compresses what typically takes a week of manual configuration into a single command line interaction. This section communicates a foundational truth about service mesh architecture: operators issue mesh data commands through the control plane, and the data plane handles everything else, so teams never need to touch application code to get full traffic management capabilities deployed.
Persistent Freemium Call-to-Action Bar
A sticky bottom bar appears after the first scroll and stays visible throughout the session. The primary call-to-action reads "Deploy Your Mesh Free" in signal green on carbon black. Clicking opens a two-step sign-up flow: first, GitHub or SSO authentication; second, a cluster selector covering EKS, GKE, AKS, and self-managed environments, plus a namespace count field. No credit card is required at any point. The calculator already addressed the ROI question, so the call-to-action only needs to remove the remaining friction.
Social Proof with Concrete Metrics
The social proof section uses named testimonials from SREs and engineers, paired with specific benchmark numbers such as a 40% cost reduction and 163ms latency improvement. Generic quotes from anonymous users do not build trust with a technical audience. Concrete, attributed proof points give platform engineering buyers the confidence to move from evaluation to deployment.
Page sections overview
| Section | Purpose |
|---|---|
| Hero Calculator | Live estimator renders projected p99 latency, mTLS coverage, and monthly cost savings in an animated data grid |
| Topology Map | Animated SVG graph lights up service connections as the mesh comes online, showing east west traffic paths |
| Before/After Metrics | Side-by-side panel compares error rates and latency before and after the service mesh is deployed |
| Terminal Deploy | Live terminal block shows the meshctl install command with a compressed deployment timeline |
| Social Proof | Named engineer testimonials with specific cost and latency benchmarks build credibility with technical users |
| Footer | Linear single-row footer with navigation links and the persistent call-to-action |
Design & branding system
The visual identity is built on a Carbon Fiber color system that feels engineered rather than decorated. Every color decision reinforces the Data Command theme: dark backgrounds absorb light, accents fire like status LEDs, and text renders in silver tones that read clearly without softening the technical precision of the layout.
- Color palette: Deep cockpit black (#0D0D0D) for page backgrounds, woven carbon gray (#1A1A2E) for panel surfaces, signal green (#00E676) for all interactive elements and healthy-state data readouts, and titanium silver (#B0BEC5) for secondary text and grid lines.
- Typography: JetBrains Mono for all code, data outputs, and terminal content; Plus Jakarta Sans for headings and body paragraphs. The combination keeps data-heavy sections readable while maintaining a strong technical character.
- Motion and interactivity: Counter animations on calculator outputs, SVG path draws on the topology map, a typewriter effect in the terminal block, and scroll-triggered section reveals throughout. Every interactive element, including toggles, buttons, and hover states, uses signal green to confirm active states.
Mobile & speed optimization
The template is built desktop-first, reflecting the large-monitor workflows typical of SRE and platform engineering audiences. Responsive layout is accounted for in the design structure, ensuring the dashboard grid and data panels remain readable as viewport width changes.
- Component architecture: Static sections use Server Components for fast initial rendering. Interactive sections, including the live calculator and topology animation, are built as Client Components so they load and hydrate independently without blocking the rest of the page.
- Animation efficiency: Scroll-triggered reveals, SVG path draws, and counter animations are scoped to their respective sections. Animations activate only when the relevant section enters the viewport, keeping the experience smooth without unnecessary resource overhead.
How this template helps you convert
Every design and sequence decision in this template is built around a single conversion goal: get a technical buyer from skeptical visitor to deployed mesh trial user with as little friction as possible.
- The calculator does the selling first. Before the visitor reads any marketing copy, they have already entered their own numbers and seen a personalized data grid showing projected savings and latency improvements. That self-generated data is more persuasive than any claim the page could make on its own.
- The scroll sequence builds commitment. The topology map, metrics panel, and terminal block each add a layer of evidence, reinforcing the value of a properly configured service mesh control plane section by section. By the time a visitor reaches the call-to-action, they have seen the product working across multiple formats.
- The two-step sign-up removes the last barrier. No credit card field, no long form. GitHub or SSO authentication plus a cluster and namespace selector is all it takes to go from landing page visitor to active mesh user.
Other information about this template
This template is designed specifically for service mesh platform products where the audience already understands microservice networking fundamentals. The content and component structure reflect how a service mesh architecture actually works, making it easier to populate the template with accurate, technical copy.
- A service mesh typically consists of a control plane and a data plane. The control plane manages service discovery, health checking, policy enforcement, and configuration distribution. The data plane, through a sidecar proxy injected alongside each workload, handles all data plane traffic between services, including routing, load balancing, authentication, and authorization. Applications remain oblivious to the data plane's existence because service proxies are transparently inserted, meaning no changes to service code are required.
- Service mesh architectures typically employ three networking planes: data, control, and management. The data plane intercepts all network traffic and processes every request. The control plane transforms a set of isolated, stateless proxies into a coordinated service mesh by pushing configuration and policy. Operators issue commands through tools or YAML configurations, and the mesh propagates those changes across every enrolled service instance.
- Traffic management capabilities in a service mesh include round robin load balancing by default, with support for least requests and other load balancing pool strategies. Virtual services define routing rules evaluated in order to send traffic to specific destinations. Destination rules configure what happens to traffic after virtual service routing rules are applied. Version labels on service deployments allow traffic to be split across different versions of the same service, enabling canary deployments, blue-green deployments, and A/B testing without modifying application code.
- The service mesh handles east west traffic between services inside the cluster boundary, as well as ingress gateway traffic entering from external networks. Service entries extend traffic management to services running outside the mesh by adding them to the service registry. This means the mesh can manage a virtual machine workload alongside containerized services with a consistent control plane configuration.
- Security in a service mesh centers on strict mTLS between every enrolled service. The mesh can automatically generate an SSL certificate for each service and its instances, providing added security without manual certificate management. Authentication and authorization policies define which services are allowed to communicate with which other services, supporting a zero-trust security model across cloud environments.
- Observability features in a service mesh provide mechanisms for handling telemetry, including metrics, distributed tracing, and logs. The automated collection of latency, error rates, and traffic volume maps to what the observability community calls golden signals. Health checking determines which service instances are ready to handle traffic and removes unhealthy instances from the load balancer rotation automatically.
- The istio system is a widely referenced service mesh implementation that uses virtualservice metadata and destinationrule metadata resources to configure traffic behavior. A virtualservice metadata resource defines routing rules for a host name or set of host names. A destinationrule metadata resource defines subsets and policies applied after routing. Operators can use a yaml copy of these resources to configure the mesh through the command line or apply them to a default namespace in a kubernetes cluster.
- Service mesh patterns like circuit breaking prevent cascading failures by stopping requests to unhealthy services before the failure propagates. Retries handle transient failures automatically, though they should be configured carefully to avoid retry storms. Rate limiting protects services from being overwhelmed. Timeouts prevent any request from waiting indefinitely and should be set based on service-level objectives. These patterns are best tested in staging before being applied to production workloads.
- The Mesh data command service mesh landing page template is a ready-to-deploy starting point for any team building a service mesh product landing page. Whether your product targets platform engineers managing a large kubernetes cluster or development teams just getting started with microservice networking, this template provides the structure, visual language, and interactive components to communicate your value clearly and convert technical visitors into trial users.
Theme
Data Command
Creative direction
Launch Energy
Color system
Carbon Fiber
Style
Dashboard/Data Grid
Direction
Freemium/Trial
Page Sections
Live ROI Calculator Hero
Animated Topology Map
Before and After Metrics Panel
Terminal Deploy Block
Persistent Freemium Call-to-action Bar
Carbon Fiber Design System
Related questions
What is the primary audience for this template?
Does the calculator section require a backend to function?
Can I use this template for a product that is not a service mesh?
How does the sign-up flow work in the template?
Is this template suitable for desktop and mobile users?



