Certified Accounting Firm Software Professional Website Template
Ledger is a dashboard-style landing page template built for accounting firm fleet management platforms. It leads with live fleet metrics in dark glass panels, walks visitors through data-driven sections like Gantt-style lease timelines and mileage scatter plots, and closes with a clear app download call to action. The design feels precise, calm, and authoritative, exactly right for a financial operations audience.
by Rocket studio
Quick summary
Ledger is a single-page, stats-first landing page template for fleet operations platforms serving accounting firms. It opens with oversized real-time figures, moves through diagnostic data visualizations, and drives toward an app download. The dark charcoal and sky blue color system gives it the feel of a perfectly reconciled workpaper, every section balanced, every number purposeful.
Who this template is for
This template is built for software teams and founders who serve the accounting side of fleet management. If your platform helps firms track mileage reimbursements, depreciation schedules, lease compliance, or Internal Revenue Service (IRS)-qualified business use percentages, Ledger was designed for your audience.
- Managing partners at mid-size CPA firms running fifteen to sixty company vehicles across multiple locations
- Fleet coordinators reconciling fuel cards against client billing codes inside messy spreadsheets
- Office managers tracking staff lease expirations and fielding urgent renewal calls
What problem this template solves
Accounting-focused fleet platforms face a specific sales problem: the people who need them most are buried in spreadsheets and skeptical of software promises. A generic SaaS landing page does not earn their trust. Ledger solves this by letting the data make the case before any marketing copy does.
- Fleet managers do not respond to feature lists; they respond to numbers that confirm what they already suspect
- Lease deadlines, cost leakage, and depreciation gaps need to be visible before a visitor will take any action
- A vague demo-request call to action loses the audience that wants a direct, low-friction path to the product
What you get with this template
You get a complete, production-ready landing page layout that sequences data visualizations and conversion elements in a deliberate, diagnostic order. Every section is built to surface a problem and reward the visitor for reading further.
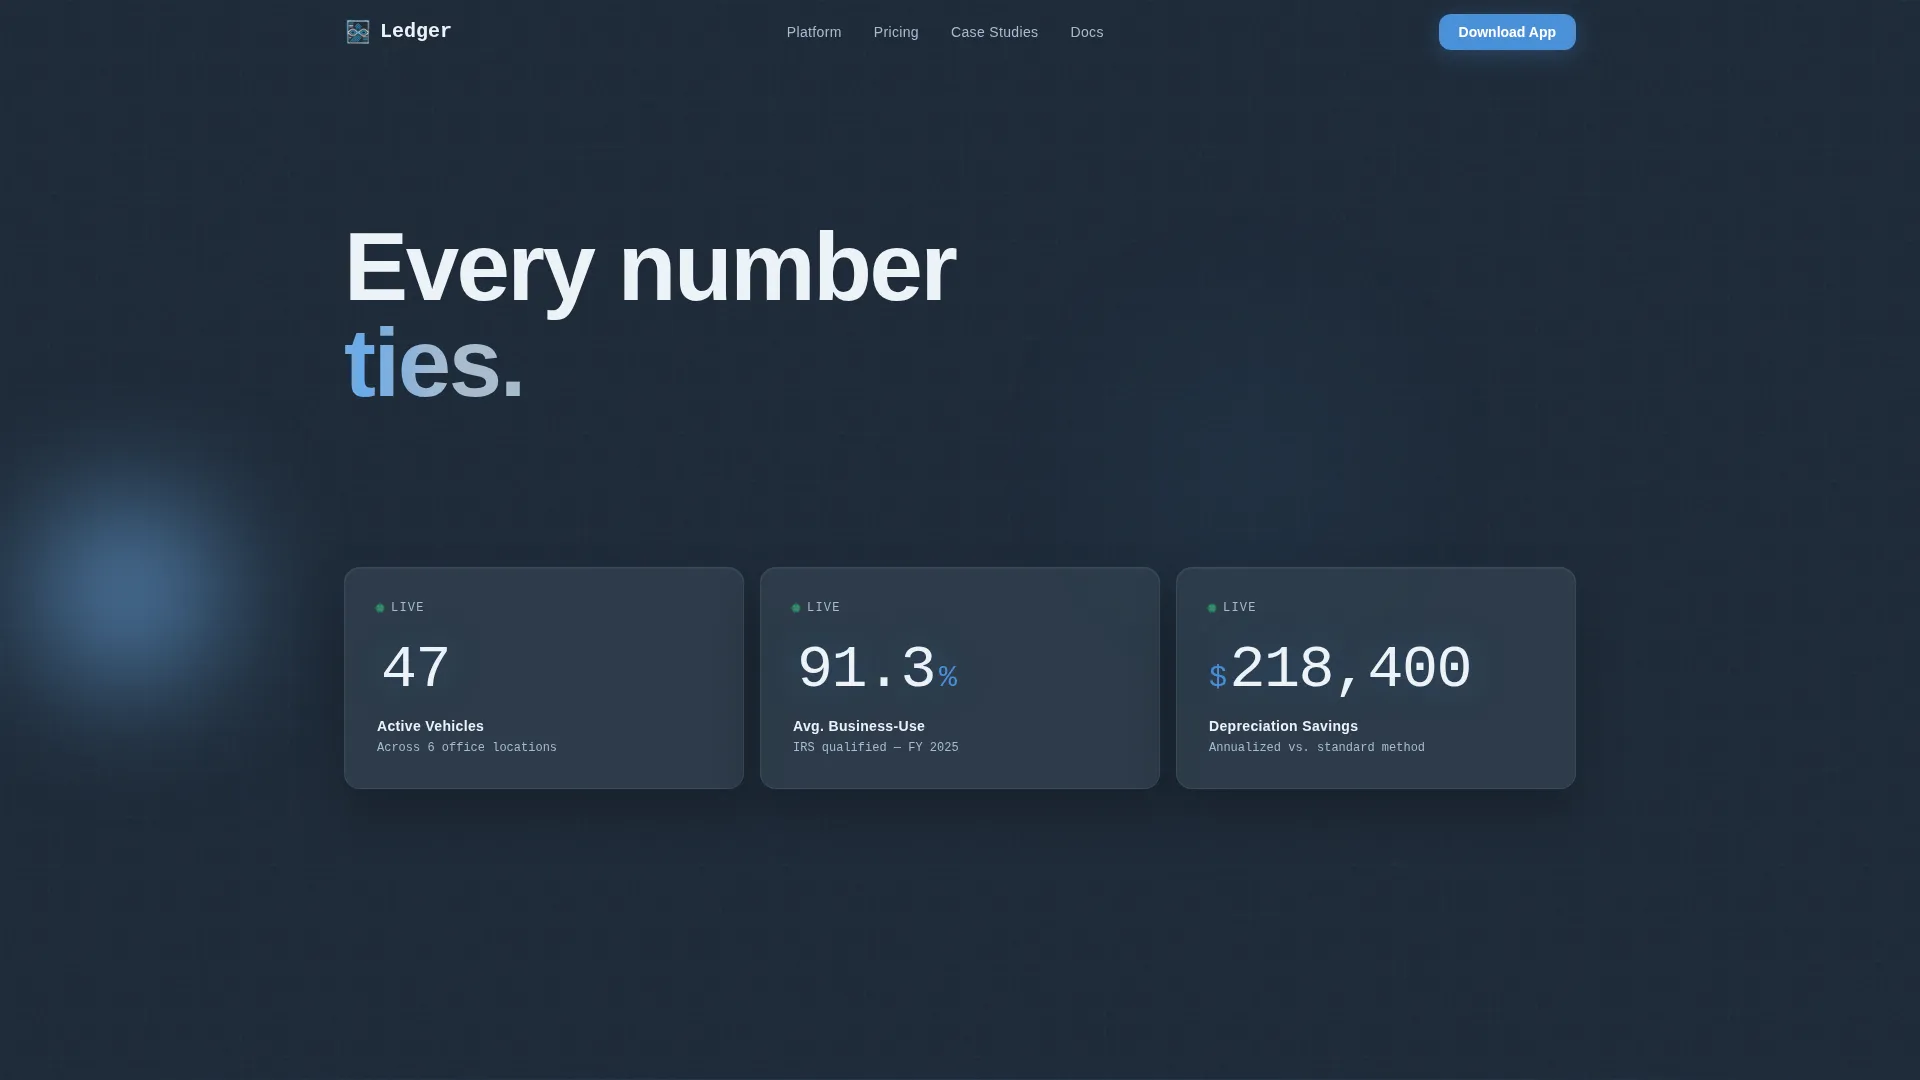
- A dark glass panel header with three oversized fleet metric cards displaying total active vehicles, average business-use percentage, and annualized depreciation savings
- A horizontal fleet health grid, a Gantt-style lease expiration bar chart, and a mileage-versus-reimbursement scatter plot section
- A dual-path conversion footer with a primary app download block and a secondary gated PDF report offer
Feature list
This section covers the core layout and design capabilities included in the Ledger template.
Dark Glass Panel Header
Three frosted-glass metric cards float against a deep charcoal slate background. Each card renders a single oversized figure first, total active vehicles, average business-use percentage, and annualized depreciation savings, with label text fading in beneath. No photography or illustration is used; data is the visual hero.
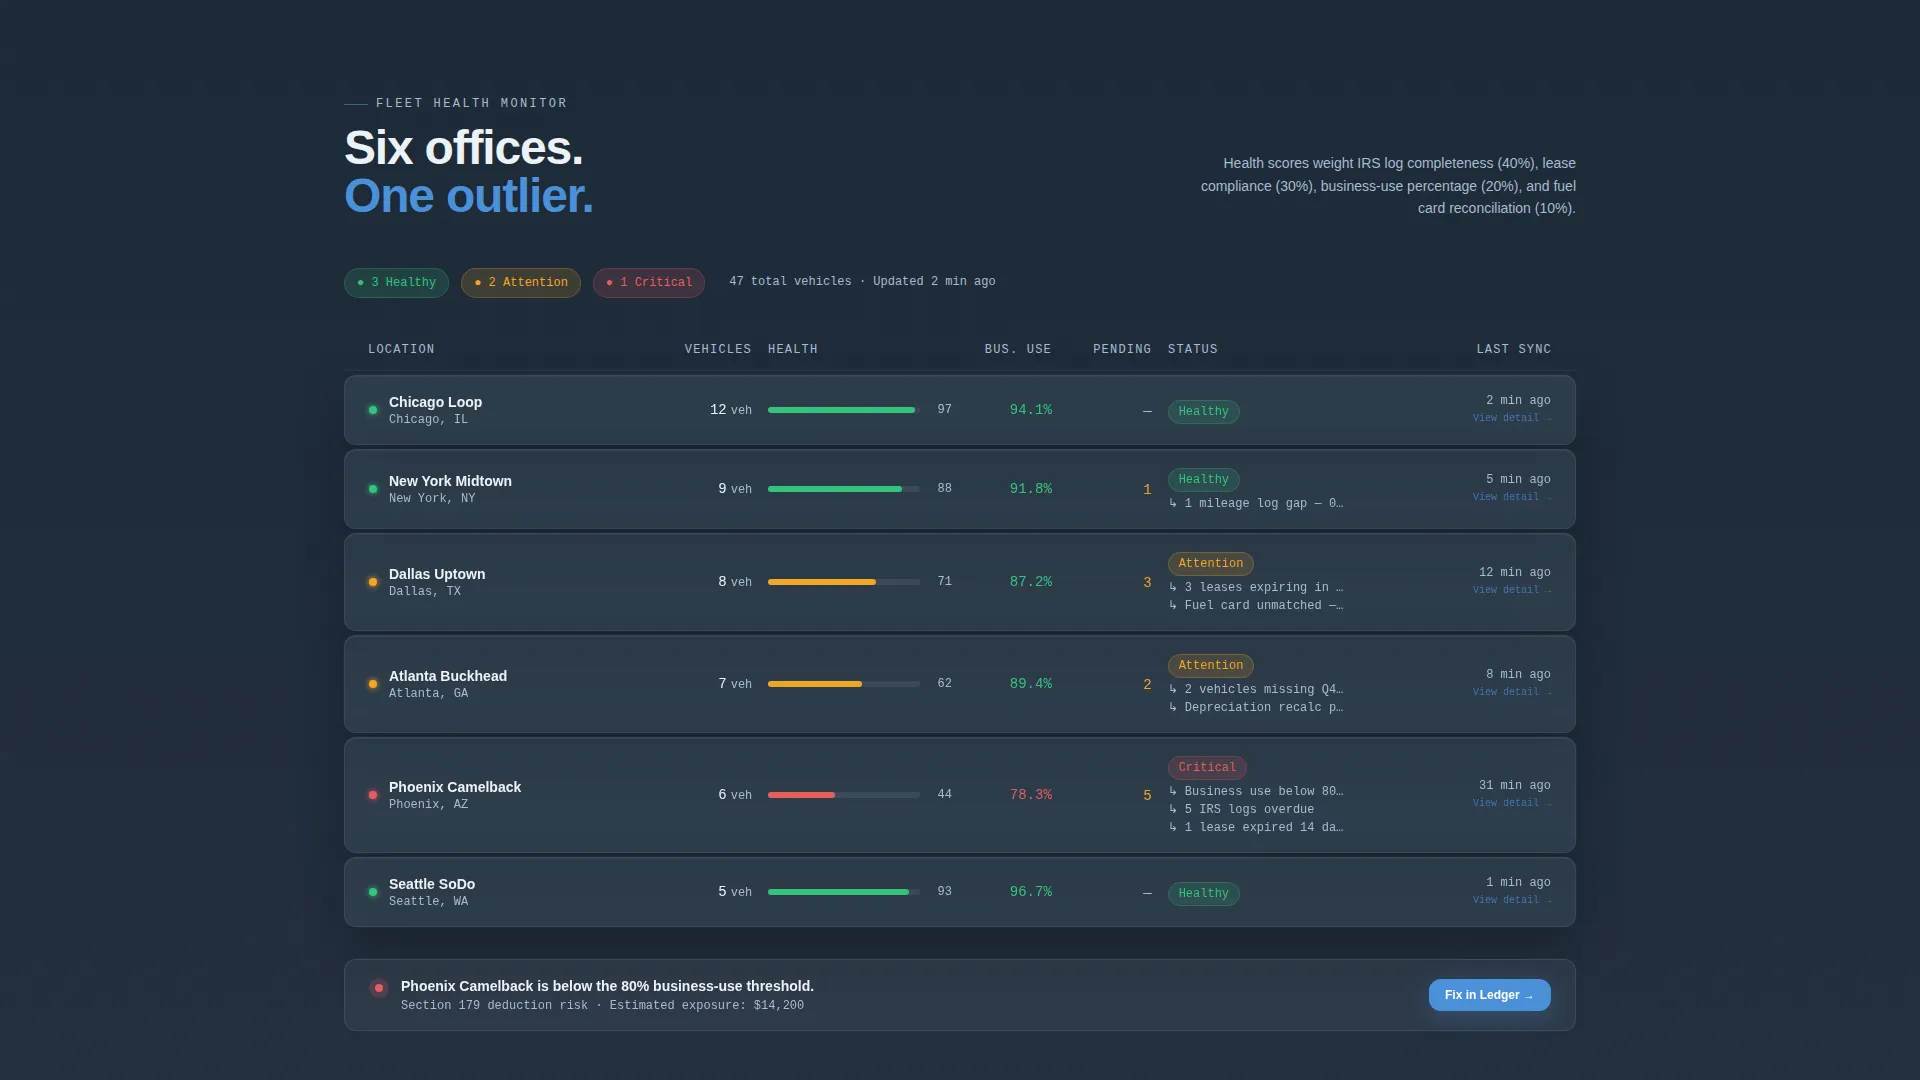
Fleet Health Grid
A horizontal data grid maps fleet health scores by office location using green, amber, and red status indicators. Visitors scan the grid instinctively, spotting the outlier location before reading a single line of descriptive text. The layout rewards the analytical reader immediately.
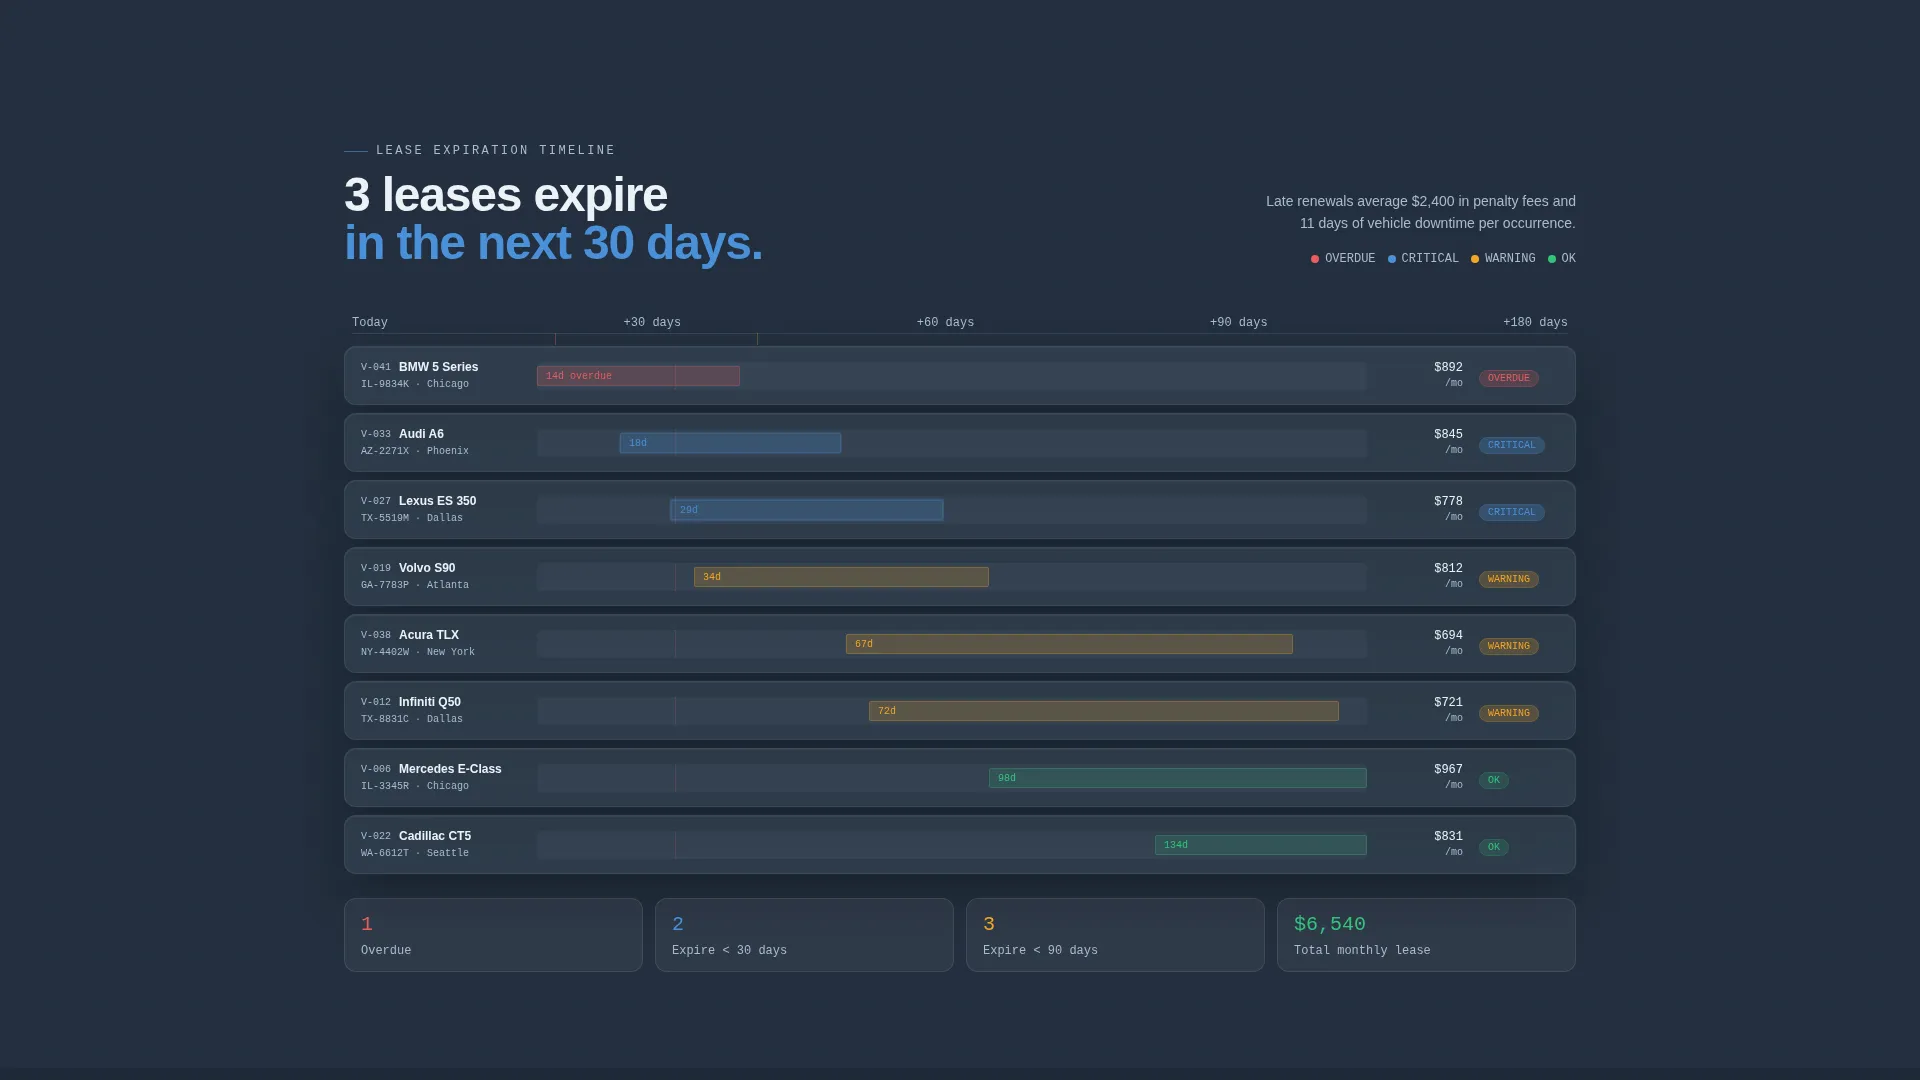
Gantt-Style Lease Timeline
Vehicles stack chronologically in a bar chart that visualizes lease expiration dates across the fleet. Overdue units pulse in sky blue to draw the eye. The section makes urgency concrete without requiring any explanatory paragraph.
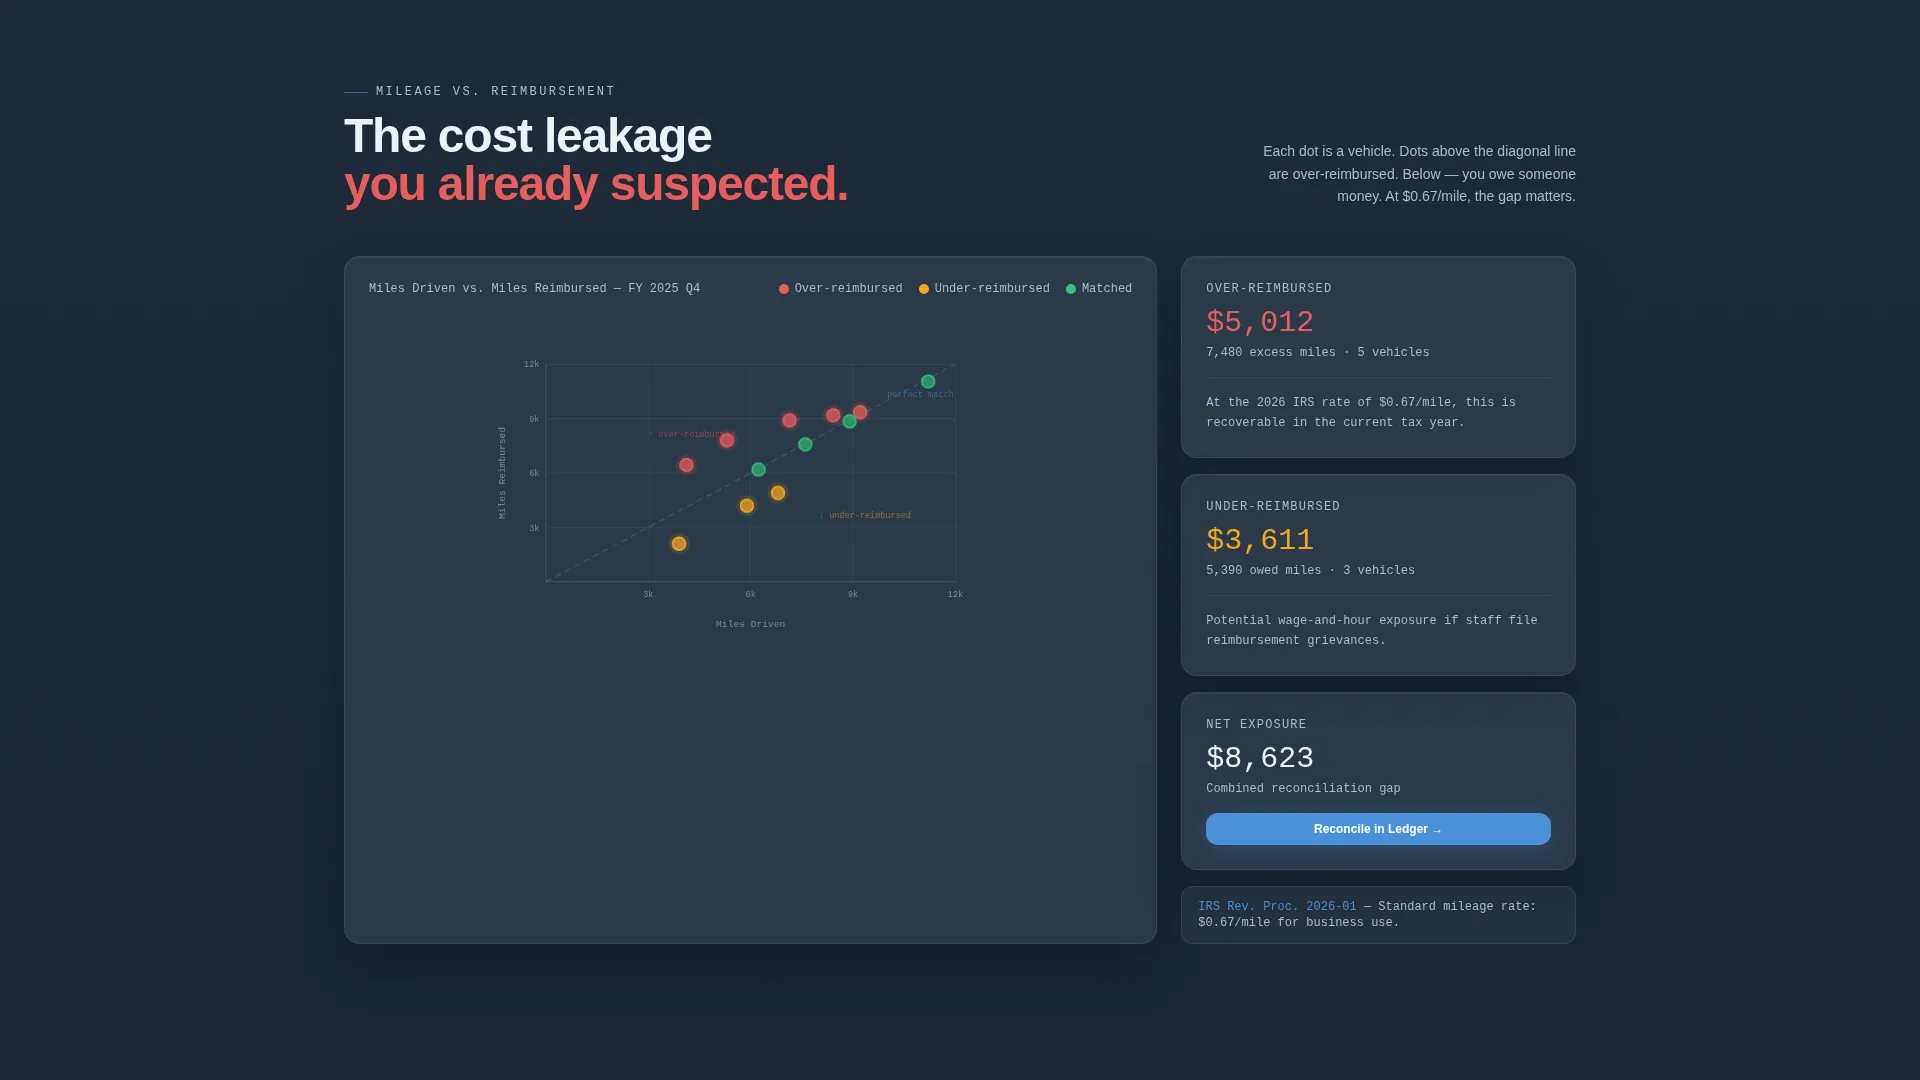
Mileage and Reimbursement Scatter Plot
A scatter plot section maps logged mileage against reimbursement amounts to make cost leakage visually obvious. The diagnostic framing means the visitor identifies the problem themselves before any copy names it. This builds credibility faster than a feature list ever could.
App Download Conversion Block
The primary call to action offers a "Download the Fleet Dashboard" button paired with App Store and Google Play badges. A single phone number input field lets visitors request a direct download link by text. The low-friction design removes the barrier between interest and install.
Device Frame Screenshots
Four live-data screenshots inside device frames show the exact screens the visitor will own after downloading. Each screenshot represents a real workflow view from within the platform. Seeing the actual interface before downloading shortens the decision cycle.
Page sections overview
| Section | Purpose |
|---|---|
| Dark Glass Header | Display three key fleet metrics in oversized figures |
| Fleet Health Grid | Show office-by-office vehicle health at a glance |
| Lease Expiration Timeline | Visualize upcoming and overdue lease deadlines |
| Mileage Scatter Plot | Surface reimbursement cost leakage visually |
| App Download Block | Drive primary conversion via app store download |
| Gated PDF Offer | Capture work email with a sample fleet report |
Design & branding system
Ledger uses a Slate and Sky color system that feels like a downtown office tower at blue hour. Deep charcoal slate dominates the primary panels, open-sky blue activates data highlights and interactive states, and pale cirrus white provides breathing room between dense data rows.
- Deep charcoal slate (#1E2A38) for primary panel backgrounds, mid-tone graphite (#3D4F5F) for card surfaces, open-sky blue (#4A90D9) for active states and live data callouts
- Pale cirrus white (#EDF2F7) for background fields and negative space, keeping dense data rows from feeling cramped
- No stock photography or illustration; the visual language is entirely typographic and data-driven, using tabular figures and status color coding
Mobile & speed optimization
The template layout is structured to present dense data clearly across screen sizes. Data grids, chart sections, and device frame screenshots are laid out to remain readable and scannable on smaller viewports.
- Oversized tabular figures in the header remain legible as viewport width decreases, preserving the stats-first impact on mobile
- The app download block with its phone number input field and badge row is designed to be the natural thumb target at the bottom of a mobile session
- Device frame screenshots are sized and spaced to display cleanly without crowding on compact screens
How this template helps you convert
Ledger is built around a diagnostic narrative engine. Each scroll step surfaces a problem the visitor already suspects, quantified precisely enough that ignoring it feels costly. Conversion follows naturally from that sequence.
- The dark glass header opens with hard numbers, 47 active vehicles, 91.3% business-use, $218,400 in depreciation savings, so the visitor immediately calibrates the platform's scope before reading any marketing copy.
- The diagnostic data sections (fleet health grid, lease timeline, scatter plot) make the visitor's own operational problems visible on screen, creating a felt need that the app download resolves directly.
Other information about this template
Ledger suits any fleet operations platform that targets financial professionals and wants to lead with data credibility rather than feature claims. The Directory and Discovery theme and Stats-First Impact creative direction make it well suited for software products where numbers are the primary proof point.
- The template follows a Directory and Discovery theme, making it a strong fit for platforms that organize and surface structured operational data
- The Stats-First Impact creative direction means every scroll increment opens with a number before its explanation, which mirrors the way accounting professionals read workpapers
- Template style is Dashboard and Data Grid, meaning the layout borrows visual conventions from financial software interfaces rather than generic SaaS marketing pages
- The secondary conversion path, a gated PDF requiring only a work email, gives visitors who are not ready to download the app a low-commitment next step
Theme
Directory & Discovery
Creative direction
Stats-First Impact
Color system
Slate & Sky
Style
Dashboard/Data Grid
Direction
App Download
Page Sections
Dark Glass Panel Header
Fleet Health Grid by Location
Gantt-style Lease Timeline
Mileage Versus. Reimbursement Scatter Plot
App Download Conversion Block
Device Frame Screenshots
Related questions
Who is the primary audience for this landing page template?
What conversion actions does this template support?
Can I adapt the fleet metric figures shown in the header?
Does this template include the chart and data visualization sections?
What makes this template different from a generic SaaS landing page?


