Real-Time SaaS Analytics Dashboard Landing Page Template
Metric is a real-time SaaS analytics dashboard landing page template built for founders, RevOps leads, and finance teams who need one canonical number instead of ten open tabs. The live MRR, churn, and LTV estimator activates on page load, a filterable feature matrix replaces every integration spreadsheet, and frictionless download calls to action close the deal before doubt sets in.
by Rocket studio
Quick summary
Metric is the metric real time saas analytics dashboard landing page template designed for SaaS teams that are done stitching exports together. The dashboard loads pre-filled with realistic data, proves value in seconds, and drives an immediate app download with no email gate. Every section is engineered so visitors understand the product before they ever touch a call to action.
Who this template is for
This dashboard template speaks directly to the people who refresh revenue tools at odd hours and still leave meetings without a single agreed number. It serves saas founders, finance leads, and RevOps professionals who need one reliable source of truth.
- Startup founders monitoring monthly recurring revenue and churn rate in real time
- VP of Finance teams preparing board decks with cohort retention and customer lifetime value models
- RevOps leads who need one canonical saas metrics dashboard view when leadership asks for a business update
What problem this template solves
Most saas companies track analytics across disconnected tools. Marketing pulls from one source, finance exports from another, and the CEO gets a different number from each. This dashboard template eliminates that gap by presenting a single, live command center.
- Scattered data sources force teams to spend hours reconciling numbers before every meeting
- No single view of key metrics like churn rate, customer acquisition cost, or total revenue means slow, reactive decision making
- Founders and operators lack a user friendly interface that shows real time data without requiring a data team to build it
What you get with this template
This landing page template delivers a complete, production-ready design system for a saas analytics dashboard product. The template is structured to communicate value instantly and guide visitors toward downloading the app.
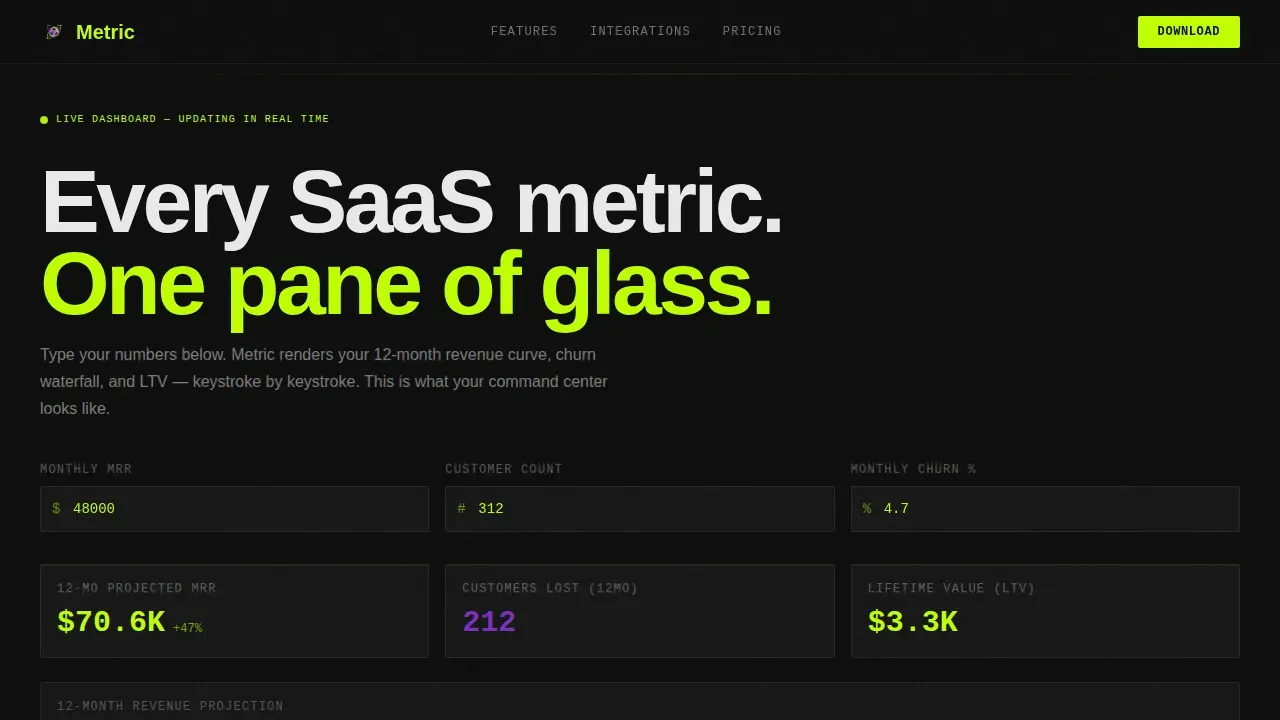
- A live calculator hero section pre-filled with $48K MRR, 312 customers, and 4.7% churn, rendering a 12-month projection chart on load
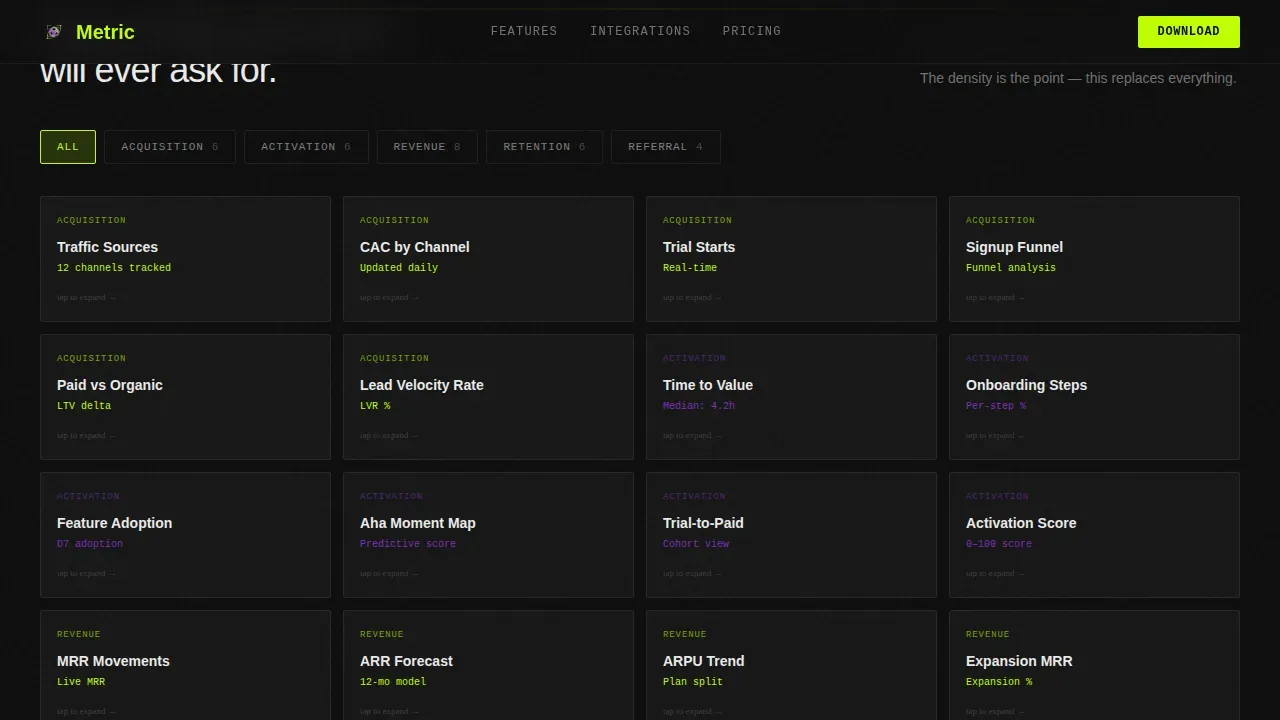
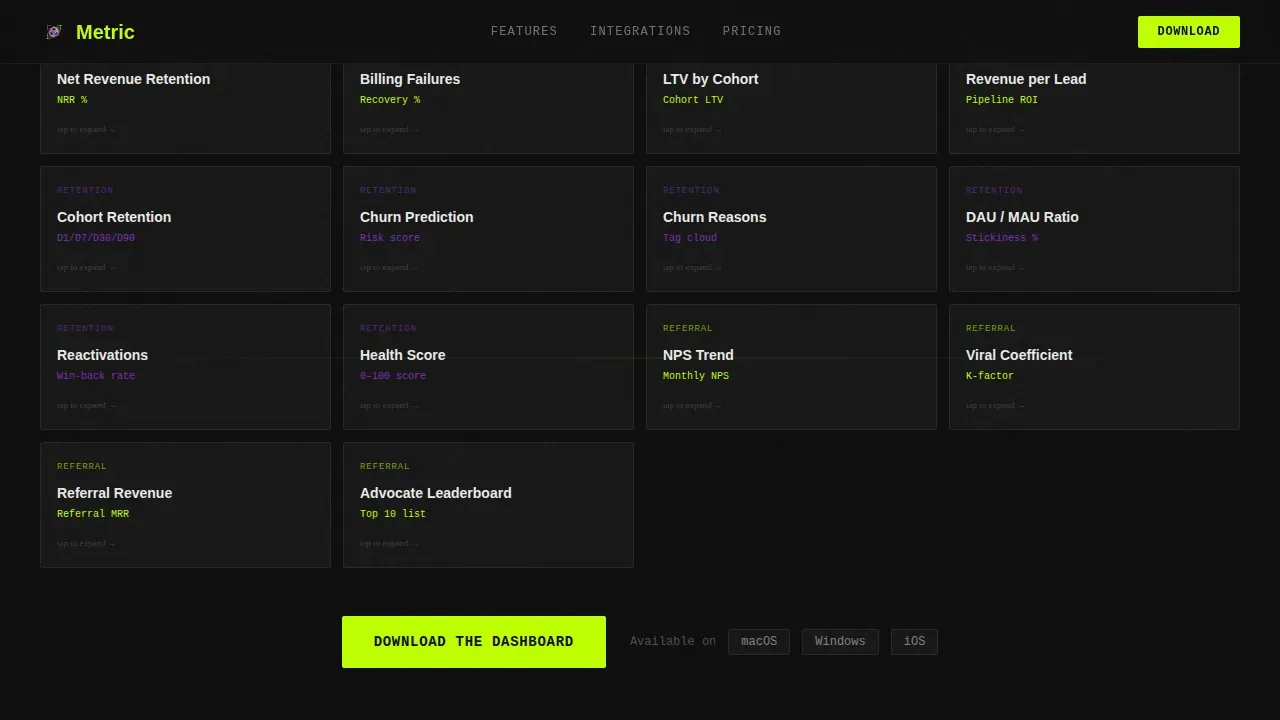
- A dense, filterable feature matrix organized by Acquisition, Activation, Revenue, Retention, and Referral workflow columns with expandable tile demos
- Platform-specific download calls to action for macOS, Windows, and iOS, plus a secondary "Try in Browser" path for hesitant visitors
Feature list
This template's key features are built around one goal: turning a first-time visitor into a confident downloader. Each section earns trust before asking for a click.
Live MRR and LTV Estimator
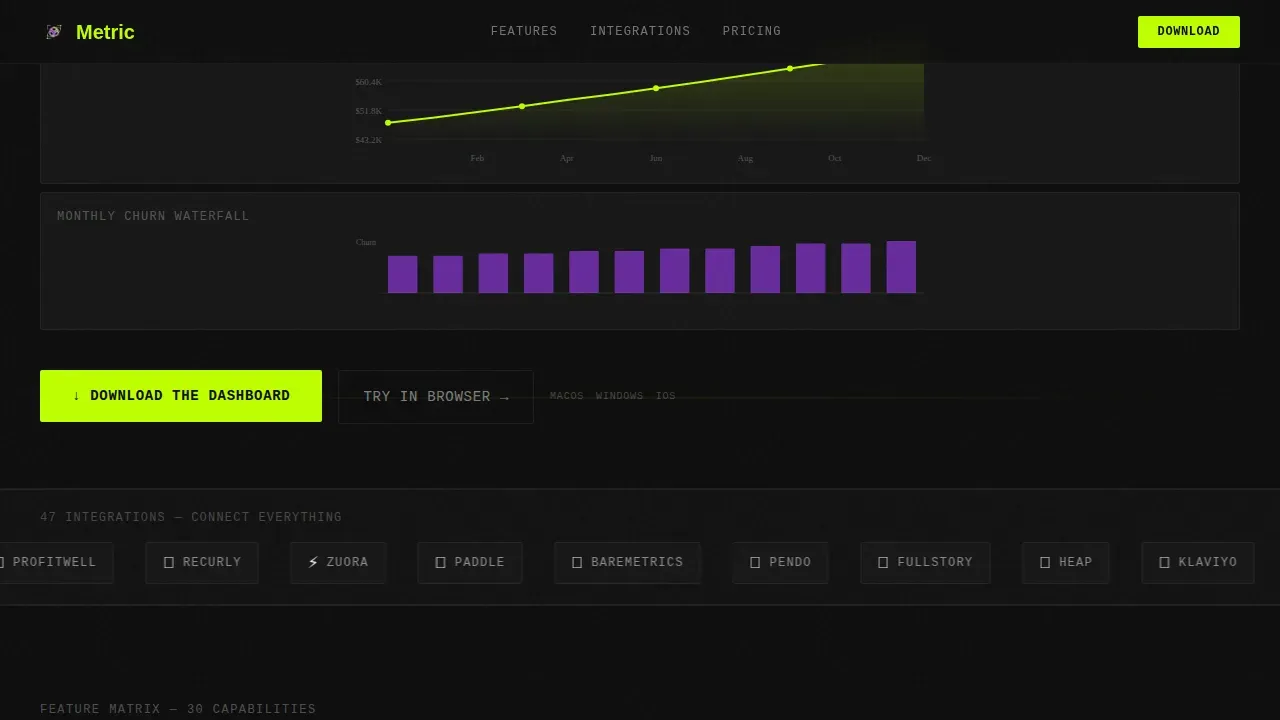
The hero section functions as a working calculator. Visitors enter their monthly recurring revenue, customer count, and average churn rate into three glowing input fields. The saas dashboard instantly renders a 12-month revenue curve, a churn waterfall chart, and a live customer lifetime value figure that updates keystroke by keystroke. Real time data updates mean the dashboard is already demonstrating value before anyone scrolls.
Filterable AARRR Feature Matrix
Scrolling past the estimator reveals a dense, browsable grid of every integration and capability. Columns map to the Acquisition, Activation, Revenue, Retention, and Referral framework. Each cell is a clickable tile that expands into a mini-demo screenshot with one explanatory line. The sheer density of supported data sources communicates breadth and replaces the need for a feature list page.
Scrolling Integration Marquee
A continuous marquee section displays integration logos immediately below the hero. This row provides visual social proof of the dashboard's breadth at a glance. It reinforces the promise that the saas analytics dashboard connects to the data sources teams already use.
Role-Tailored Dashboard Layout Options
The template includes structured sections that demonstrate different dashboard layout views suited to specific roles. A CFO-focused revenue view shows total revenue trends and customer acquisition cost cac breakdowns. A Customer Success view surfaces customer retention and churn risk signals. These previews help every visitor type recognize their own workflow inside the product.
Metrics Proof Section
A before-and-after section contrasts spreadsheet chaos with Metric's clean saas dashboard view. Three founder quotes with specific growth figures anchor social proof. This section converts skeptics by showing business performance outcomes rather than feature lists.
Frictionless Download calls to action
The primary call to action, "Download the Dashboard," appears at the hero, mid-grid, and footer. Platform icons for macOS, Windows, and iOS appear beside each instance. No email gate delays the action. A secondary "Try in Browser" option keeps conversion rates high by offering a lower-commitment path.
Page sections overview
| Section | Purpose |
|---|---|
| Hero Estimator | Live MRR, churn, LTV calculator with 12-month projection charts |
| Integration Marquee | Scrolling logo row proving data source breadth |
| Feature Matrix Grid | Filterable AARRR capability tiles with expandable mini-demos |
| Metrics Proof | Before-and-after with founder quotes and growth figures |
| Download call to action | Platform icons and frictionless app download with browser fallback |
| Footer | Single-row linear footer with navigation and secondary links |
Design & branding system
The visual identity uses an Acid Digital color system that feels like a terminal window glowing in a dark room. Void black (#0D0D0D) dominates every background surface, making the data feel like the only light source in the room.
- Electric chartreuse (#BFFF00) fires on live metrics, active states, and primary calls to action; UV purple (#7B2FBE) marks secondary data categories, graph fills, and hover states
- Phosphor white (#EAEAEA) handles all body text and axis labels for clean readability without harshness
- JetBrains Mono handles all data labels and numeric readouts; Manrope covers body copy and headings; interactive toggles snap from purple to chartreuse on activation
Mobile & speed optimization
The template is designed desktop-first to honor the command center aesthetic, but responsive design ensures the layout adapts cleanly across all screen sizes. The filterable matrix and charts reflow for smaller viewports without losing easy navigation or readability.
- Static sections use server components for fast initial render; the calculator, charts, and filter matrix load as client components to keep interactivity smooth
- Responsive design ensures the dashboard layout reads clearly on mobile, with touch-friendly tile expansion and readable charts at all screen sizes
How this template helps you convert
An effective saas analytics dashboard landing page must immediately convey value. This template sequences each section so the visitor's confidence grows with every scroll, and the download feels like a natural next step rather than a leap.
- The live estimator in the hero section delivers actionable insights before any call to action appears, so the visitor already trusts the product by the time they see "Download the Dashboard"
- The feature matrix lets visitors self-identify their specific pain point among hundreds of supported saas applications and metrics, making the purchase feel personal and relevant
- Three download call to action placements with no email gate remove every point of friction, and the "Try in Browser" fallback ensures conversion rates stay high for hesitant visitors
Other information about this template
Choosing the right saas dashboard template matters for any saas business operating in a competitive business environment. This template is built to be scalable, user friendly, and ready to adapt to unique business needs without requiring a redesign from scratch.
- The template is built with Tailwind CSS, making it straightforward to restyle colors, spacing, and typography; material ui patterns inform the ui components structure for predictable dashboard layout customization
- Tailwind CSS utility classes keep the codebase lean and the dashboard template easy to maintain as the saas business grows
- Saas dashboard templates like this one save time by eliminating manual data combination and simplifying structured data visualization for non-technical stakeholders
- Free saas dashboard templates often lack the depth of a role-specific, real-time design; this template is a premium starting point for saas products that need to communicate analytical power immediately
- Saas admin dashboards and executive views benefit from the template's metric grouping approach, which surfaces key kpis without overwhelming users
- The template supports saas companies that want to communicate data visualization quality to potential customers before the first install
- Teams can use the integrated saas dashboard structure to align strategic objectives across sales performance, marketing, and customer satisfaction reporting in one coherent view
Theme
Directory & Discovery
Creative direction
Feature Matrix
Color system
Acid Digital
Style
Dashboard/Data Grid
Direction
App Download
Page Sections
Live Mrr, Churn, and LTV Calculator Hero
Filterable AARRR Feature Matrix
Scrolling Integration Marquee
Role-tailored Dashboard Layout Previews
Metrics Proof and Social Proof Section
Frictionless Multi-platform Download Ctas
Related questions
What key metrics does this dashboard template showcase?
Does the live estimator actually calculate real numbers?
Is this template suitable for desktop and mobile users?
Can I customize the feature matrix columns and tile content?
Does downloading require an email address or account?



