High-Performance Architecture Landing Page Template
A hub-and-spoke landing page built for a microservices research lab. It opens with a live architecture estimator, then cascades through stat-first benchmark sections covering latency, failure modes, and mesh comparisons. The dark carbon fiber design and animated orange counters give platform engineers and CTOs the evidence they need to make confident distributed systems decisions.
by Rocket studio
Quick summary
This template is a single-page, anchor-navigated landing page for a microservices benchmarking and stress-testing research lab. It leads with an interactive architecture estimator, then delivers research evidence section by section. Each spoke opens with a massive data point rendered in ignition orange before expanding into methodology and interactive charts. The destination is a benchmark suite download flow.
Who this template is for
This template is built for technical teams who make hard architectural decisions and need real data to back them up. It speaks the language of engineers and technical leaders, not marketing generalists.
- Platform engineers and DevOps leads debugging cascading failures who need real latency and failure-isolation numbers
- CTOs leading monolith-to-microservices migrations who need cost and performance projections to justify roadmap decisions
- Developer tools and research labs that want to present benchmarking data with credibility and visual authority
What problem this template solves
Engineering teams evaluating distributed systems architecture often face a wall of vendor marketing and no objective data. They need a presentation layer that matches the rigor of the research itself.
- No compelling way to show raw benchmark data without it looking like a dry report or a forgettable data dump
- No interactive hook that makes visitors feel the relevance of the research to their own system before they scroll
- No conversion path that moves a skeptical technical audience from curiosity to downloading a benchmark suite
What you get with this template
You get a fully structured, dark-theme landing page that puts your data front and center from the first scroll. Every section is designed to earn trust through evidence, not assertion.
- A live architecture estimator header where visitors input their own system specs and watch real-time microservice decomposition with animated counters
- Four benchmark spoke sections, each opening with a stat-first impact block, then expanding into methodology, charts, and download prompts
- A persistent contextual bottom bar that resurfaces the download call to action after each section with updated, relevant labels
Feature list
This section covers the core functional and design capabilities built into this template, all drawn directly from the project brief.
Live Architecture Estimator Header
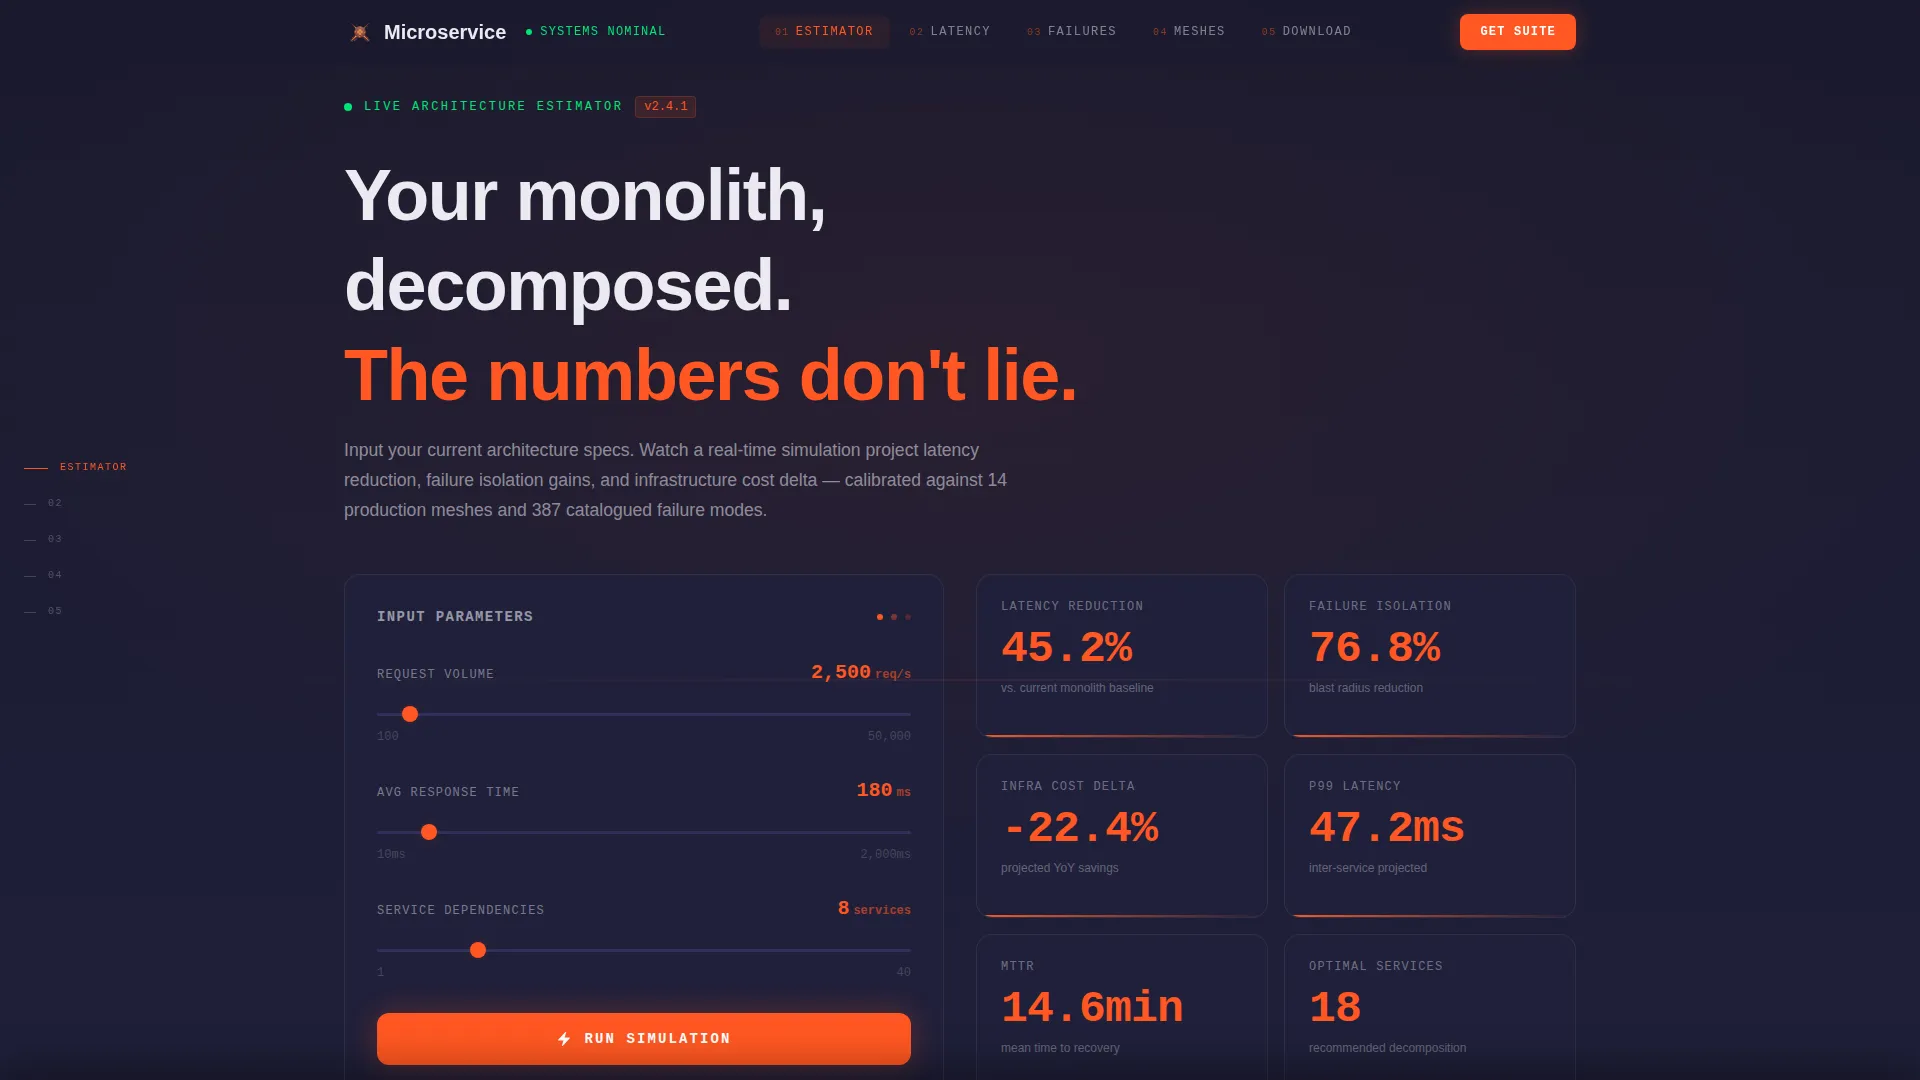
Visitors enter their current monolith's request volume, average response time, and number of service dependencies. The tool then projects latency reduction, failure isolation gains, and infrastructure cost delta in real time. Orange animated digits climb and settle like a stock ticker, making the visitor's own system the subject of the page.
Stat-First Spoke Sections
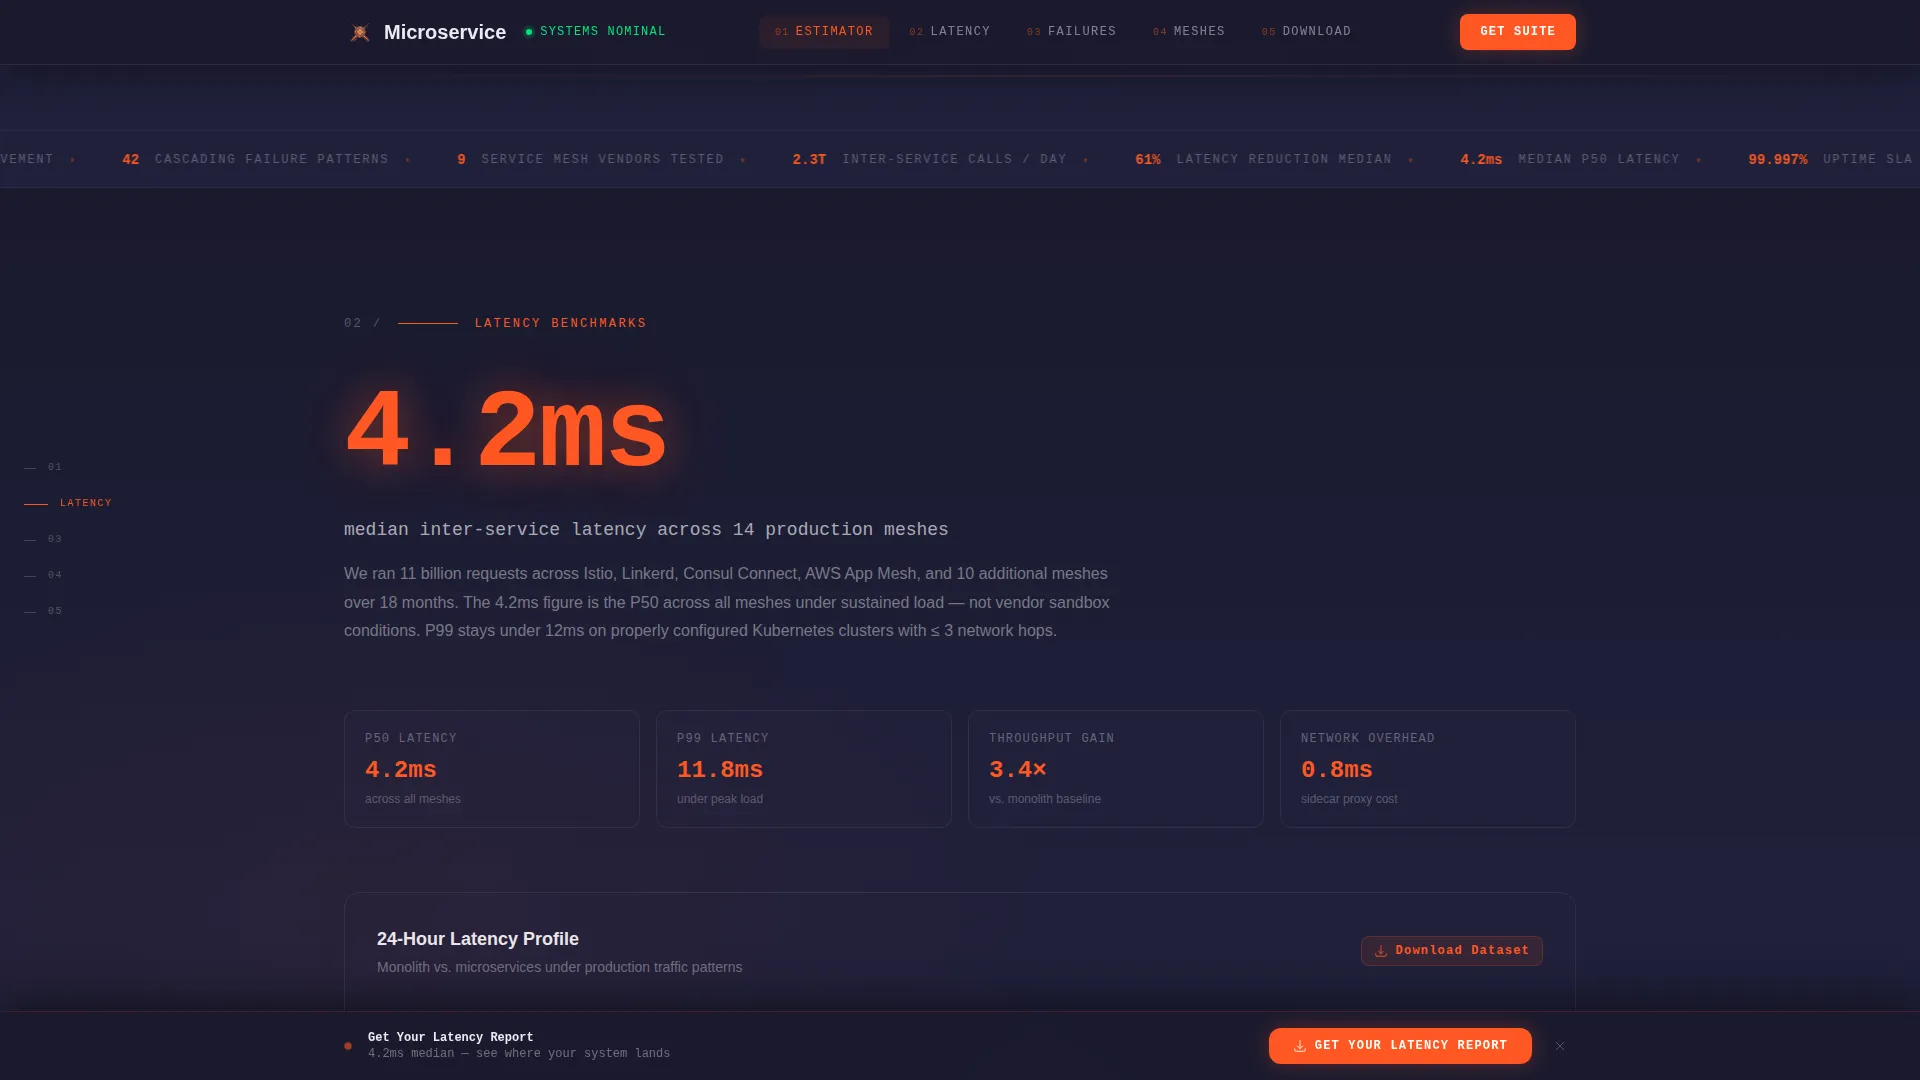
Each of the four research sections opens with a single oversized statistic rendered in ignition orange. Examples built into the layout include figures like 4.2ms median inter-service latency, 387 catalogued failure modes, and 99.997% uptime across 14 benchmarked meshes. The stat stops the scroll; the methodology content that follows earns the trust.
Anchor Navigation Rail
A left-side navigation rail keeps every spoke section labeled and reachable at all times. Visitors can jump between the latency benchmarks, failure catalog, mesh comparison, and download suite without losing their place. The nav anchors update as visitors scroll, reflecting their current position on the page.
Contextual Persistent Bottom Bar
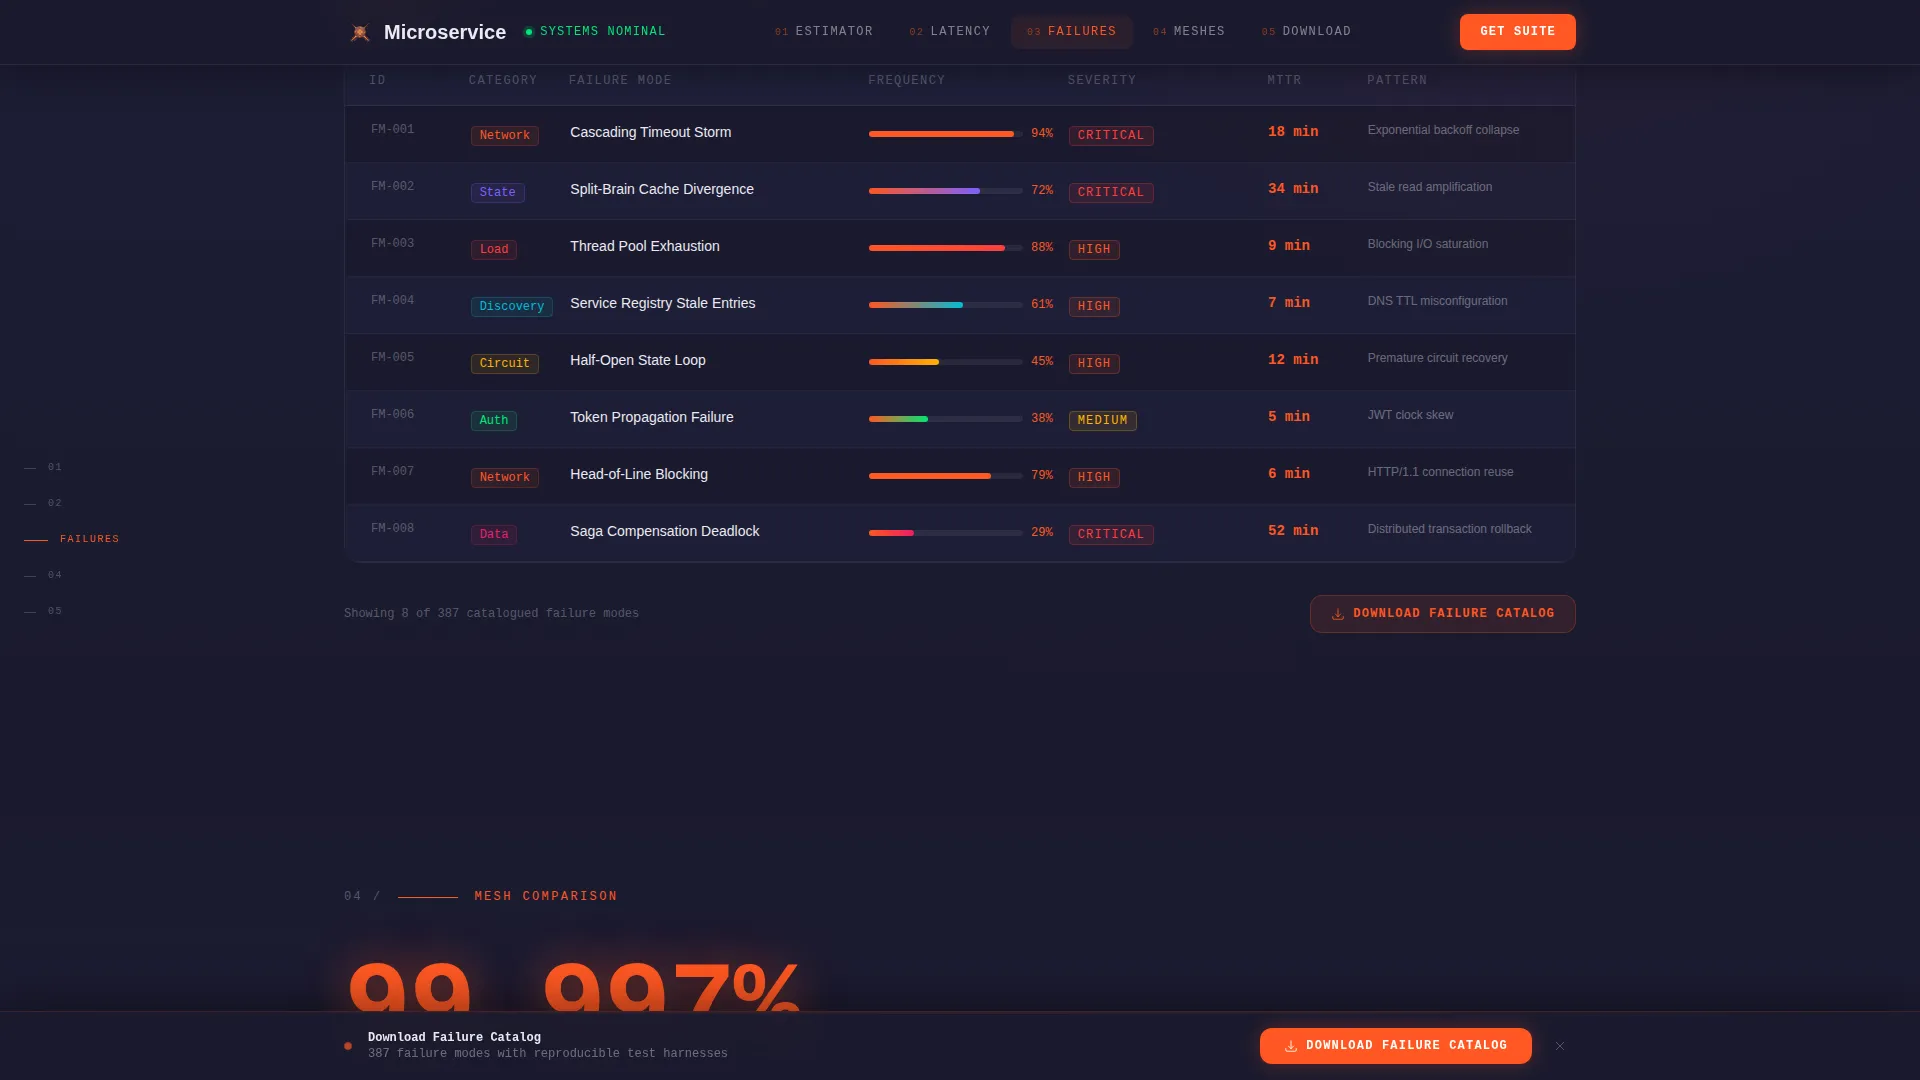
A sticky bottom bar follows the visitor through every spoke section. After the latency section it reads "Get Your Latency Report." After the resilience section it reads "Download Failure Catalog." The label updates contextually but always routes to the same benchmark suite download flow.
Benchmark Suite Download Flow
The download section includes a platform toggle for macOS, Linux, and Docker, a work email input field, and a single checkbox for research update opt-in. The estimator in the header seeds urgency by surfacing which benchmarks match the visitor's inputs before they reach this section.
GitHub Developer Minimal Footer
The footer follows a minimal developer pattern with copyright, Docs, Research, Status, and Privacy links. It keeps the page grounded in technical credibility without adding visual noise to the dark dashboard aesthetic.
Page sections overview
| Section | Purpose |
|---|---|
| Hero Estimator Calculator | Input monolith specs; watch real-time microservice decomposition with animated orange counters |
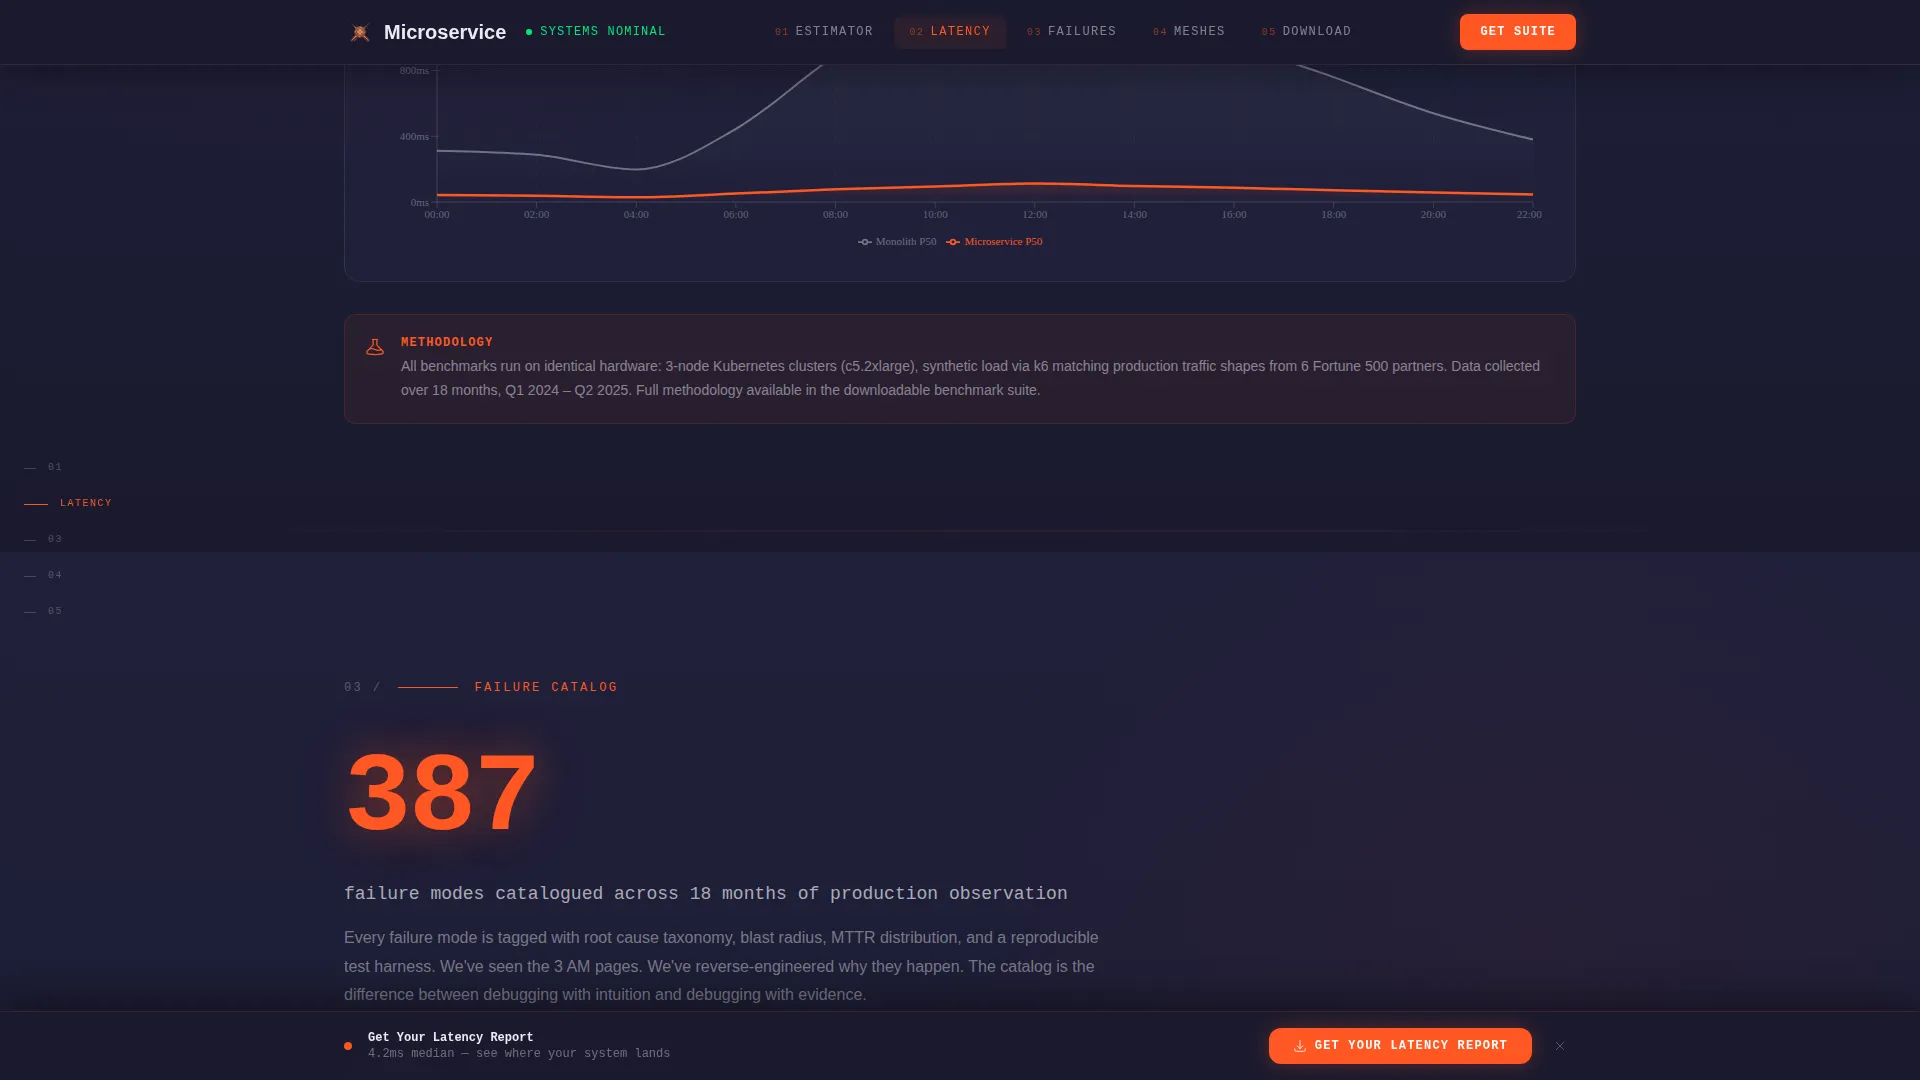
| Latency Benchmark Data | Stat-first impact block at 4.2ms, followed by methodology and interactive chart |
| Failure Catalog Section | Opens with 387 failure modes stat, then expands into resilience data breakdown |
| Mesh Comparison Table | 99.997% uptime across 14 meshes, displayed as a scannable comparison structure |
| Benchmark Suite Download | Platform toggle, work email field, research opt-in checkbox, and download trigger |
| Developer Minimal Footer | Docs, Research, Status, and Privacy links in a clean single-line layout |
Design & branding system
The visual identity channels Startup Velocity energy through a Carbon Fiber color system. The palette is intentionally dark and dense, designed to feel like the inside of a server rack at midnight.
- Color palette: deep graphite black (#1A1A2E) as the primary background, woven carbon gray (#30305A) for surface layers, high-beam white (#EAEAF0) for foreground text, and ignition orange (#FF5722) reserved strictly for data points, counters, and calls to action
- Typography: DM Sans for all body and heading text, paired with JetBrains Mono for all data values, counters, and monospace readouts to reinforce the dashboard aesthetic
- Animation approach: GSAP ScrollTrigger drives animated counters, stock-ticker number animations, and clip-path section reveals to give the page the rhythm of a live deployment dashboard
Mobile & speed optimization
The template is built desktop-first, reflecting the reality that platform engineers and DevOps leads primarily work on large screens. Mobile support is included as a solid fallback rather than the primary experience.
- Desktop-first layout prioritizes the wide anchor nav rail, side-by-side chart and stat blocks, and the estimator calculator at full width
- Static sections use server-rendered components while the calculator, animated counters, and contextual bottom bar use client-side components to keep rendering efficient
- The persistent bottom bar and anchor nav are both touch-friendly for mobile visitors accessing the page from a phone or tablet
How this template helps you convert
The conversion strategy is built around making visitors feel the relevance of the research before they are asked to act. Every interaction moves them closer to the download without pressure.
- The estimator header personalizes the page immediately, so visitors see projected outcomes for their own system within seconds of arriving, creating a direct reason to keep reading and eventually download the matching benchmark data
- The stat-first rhythm across each spoke section builds compounding credibility, so by the time visitors reach the download section they have already absorbed multiple data points that validate the lab's methodology
- The contextual persistent bottom bar keeps the download call to action visible at all times without interrupting the research flow, updating its label to match exactly what the visitor just read
Other information about this template
This template is part of the Technology category, specifically scoped to the Microservices Technology subcategory and the Microservices Research Lab niche. A few additional details worth noting before you use or customize it.
- The template style is Hub and Spoke with Anchor Navigation, meaning each research section is a self-contained spoke that connects back to the central estimator hub
- Localization defaults are set to English, USD currency formatting, and the United States date format
- The project type is B2B, targeting research labs, developer tools publishers, and platform engineering organizations
- Animation complexity is set to high; the template uses GSAP ScrollTrigger for scroll-driven reveals, animated counters, and clip-path transitions throughout
Theme
Startup Velocity
Creative direction
Stats-First Impact
Color system
Carbon Fiber
Style
Hub & Spoke (Anchor Nav)
Direction
App Download
Page Sections
Live Architecture Estimator
Stat-first Spoke Sections
Anchor Navigation Rail
Contextual Persistent Bottom Bar
Benchmark Suite Download Flow
Developer Minimal Footer
Related questions
Who is this landing page template designed for?
What does the header calculator actually do?
Can I customize the benchmark statistics shown in each section?
What platforms does the download flow support?
Is the page suitable for mobile visitors?



