IoT & Hardware Cost Calculator Website Template
Nexus is a scroll-reveal landing page template built for smart city and infrastructure platforms. It features an interactive cost-savings calculator, progressive module reveals for traffic, energy, and water systems, and a high-contrast dark visual identity. The template is designed to turn complex infrastructure data into a compelling case for municipal decision-makers and urban planners.
by Rocket studio
Quick summary
Nexus is a single-page, scroll-driven landing page template for smart city infrastructure platforms. It opens with a live cost-savings calculator, then progressively reveals three core infrastructure modules as visitors scroll. The design uses a deep operations-room color palette that communicates authority and precision from the first pixel.
Who this template is for
This template is built for organizations offering intelligent infrastructure platforms to city governments and public agencies. It speaks directly to the people responsible for making high-stakes urban technology decisions.
- Municipal Chief Information Officers managing legacy supervisory control and data acquisition systems who need to demonstrate measurable ROI to elected officials
- Urban planners modeling population growth corridors and infrastructure capacity through 2040
- Infrastructure directors preparing data-backed justifications for large capital bond programs
What problem this template solves
City technology buyers are skeptical. They need evidence before they commit to a platform, and generic marketing copy does not close a $200 million infrastructure investment conversation. This template is built to bridge that trust gap.
- Visitors arrive without a clear sense of what the platform saves them; the header calculator makes savings tangible immediately
- Decision-makers need to see system-level thinking before they sign up; the progressive scroll reveals each infrastructure module in sequence, building confidence step by step
- Procurement teams need a low-commitment entry point; the freemium trial and gated ROI report offer two paths to conversion without requiring a credit card
What you get with this template
The template delivers a fully structured, scroll-reveal landing page with animated components, a multi-field interactive calculator, and two conversion paths. Every section is designed to reduce friction and build credibility with public-sector buyers.
- An interactive header calculator with a population slider (50,000 to 5 million residents) and toggleable infrastructure modules that animate a real-time cost-savings estimate
- Three progressively revealed feature modules covering traffic intelligence, energy grid optimization, and water network analytics, each with its own data visualization concept
- A sticky bottom conversion bar, a primary trial signup sequence, and a secondary gated report download path
Feature list
This template includes purpose-built components that reflect the operational gravity of smart city platforms. Each section earns attention before asking for it.
Interactive Cost-Savings Calculator
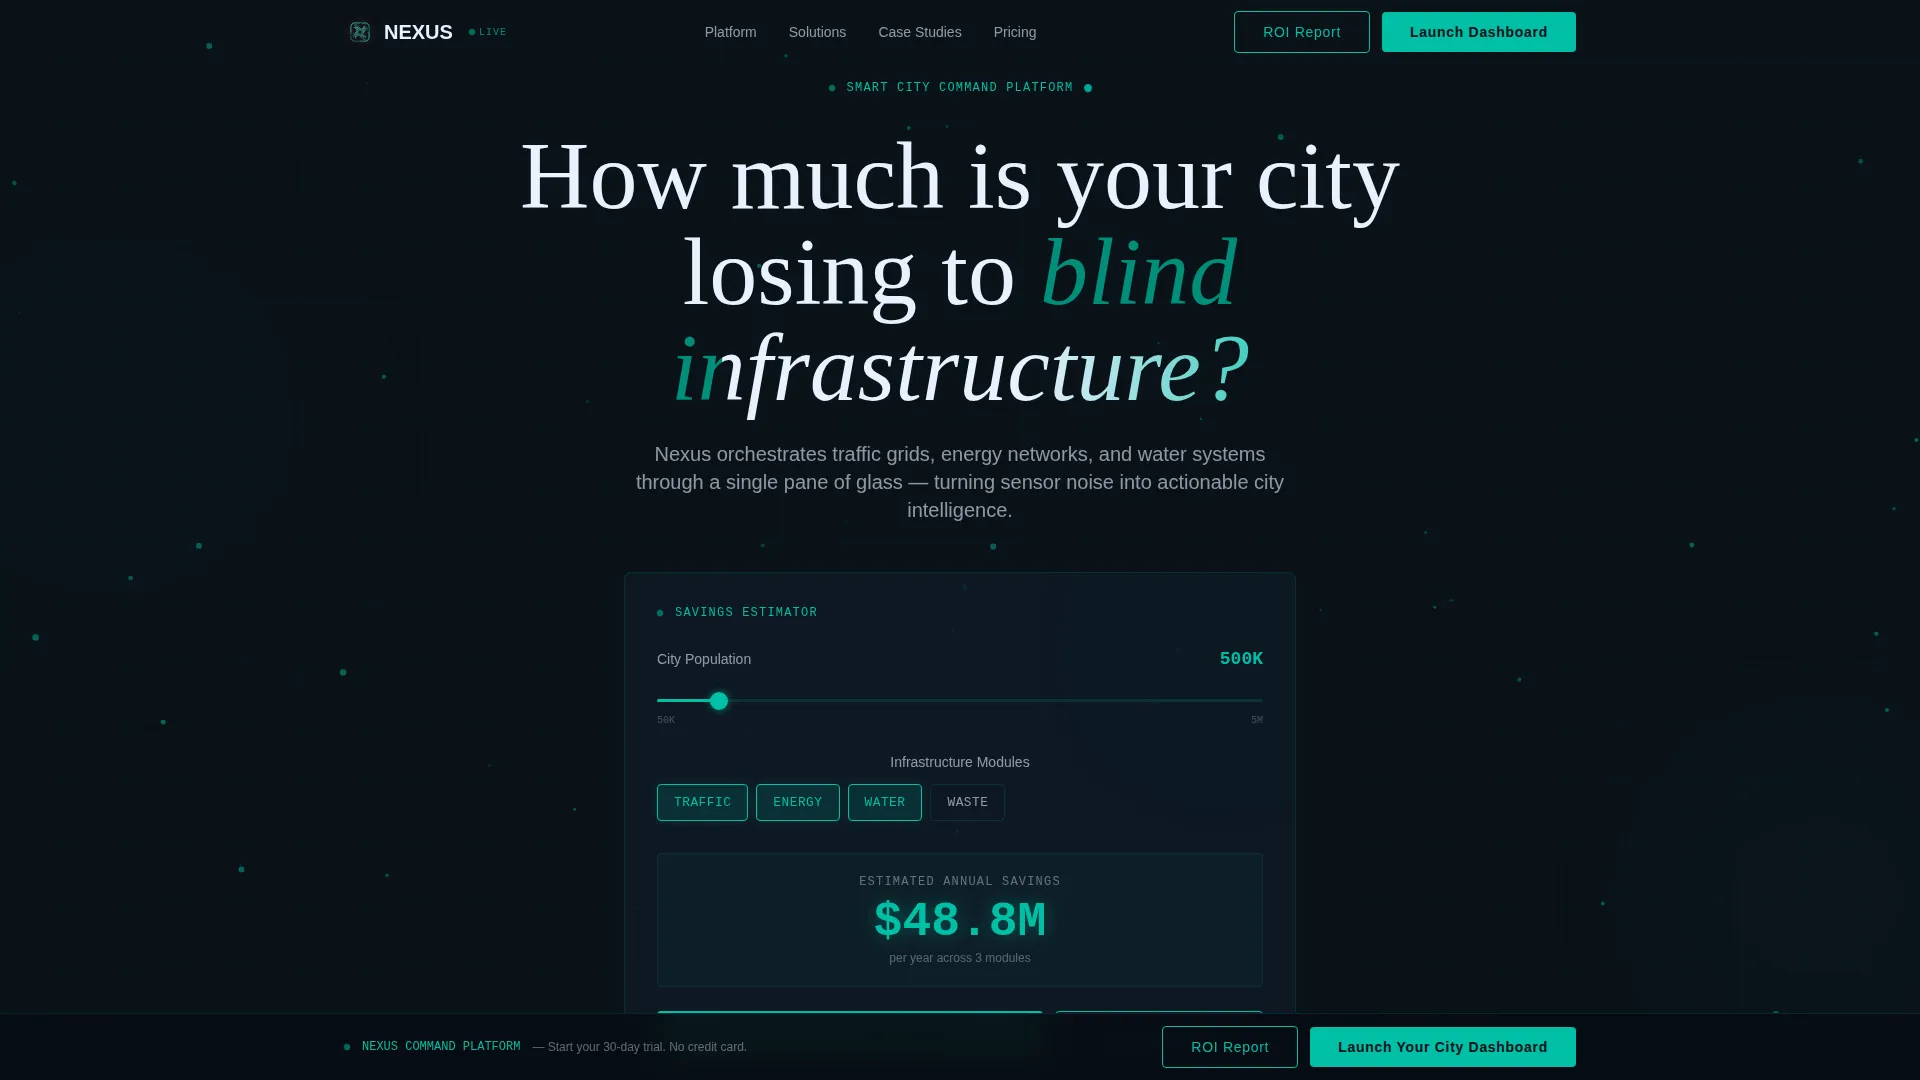
The header calculator lets visitors set a city population range using a slider and toggle individual infrastructure modules on or off. As they adjust inputs, a cost-savings estimate animates upward in real time, like a utility meter running in reverse. This makes the value proposition personal before any marketing copy has to make the case.
Progressive Scroll-Reveal Module System
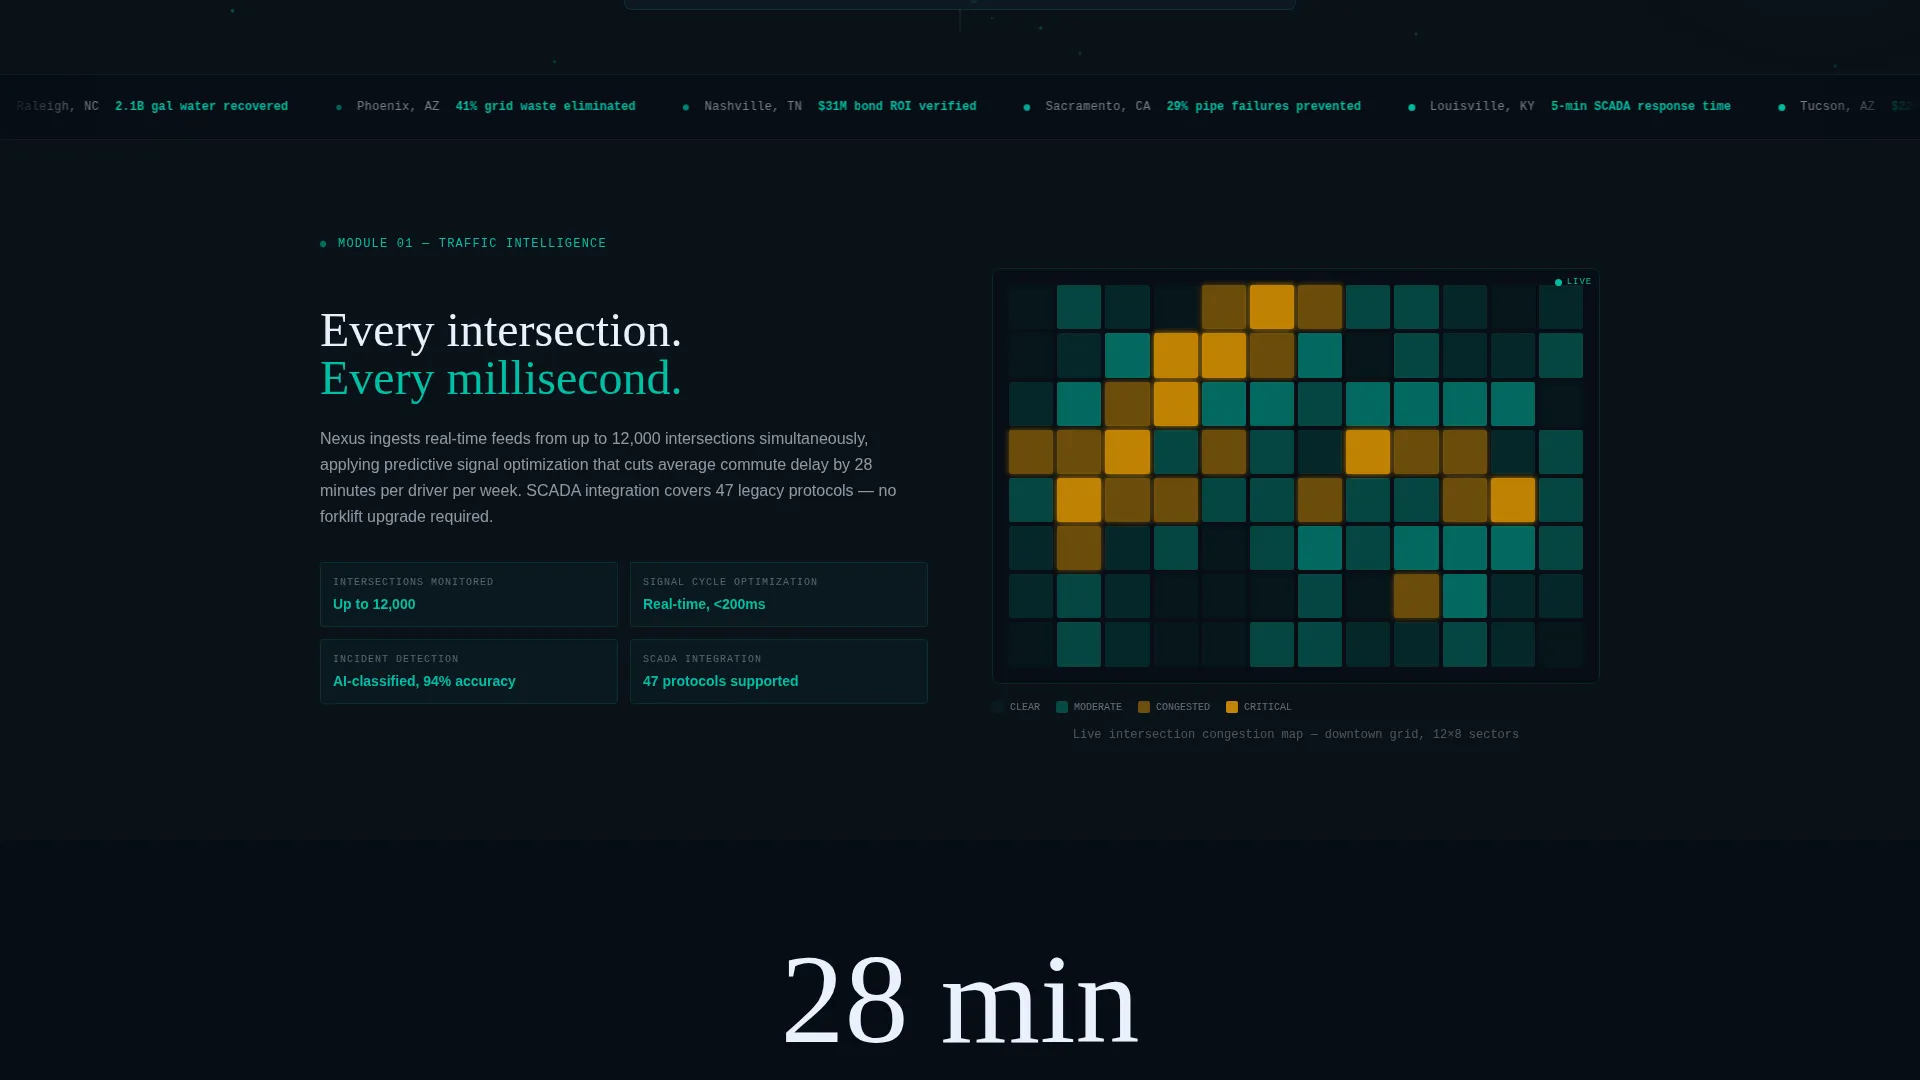
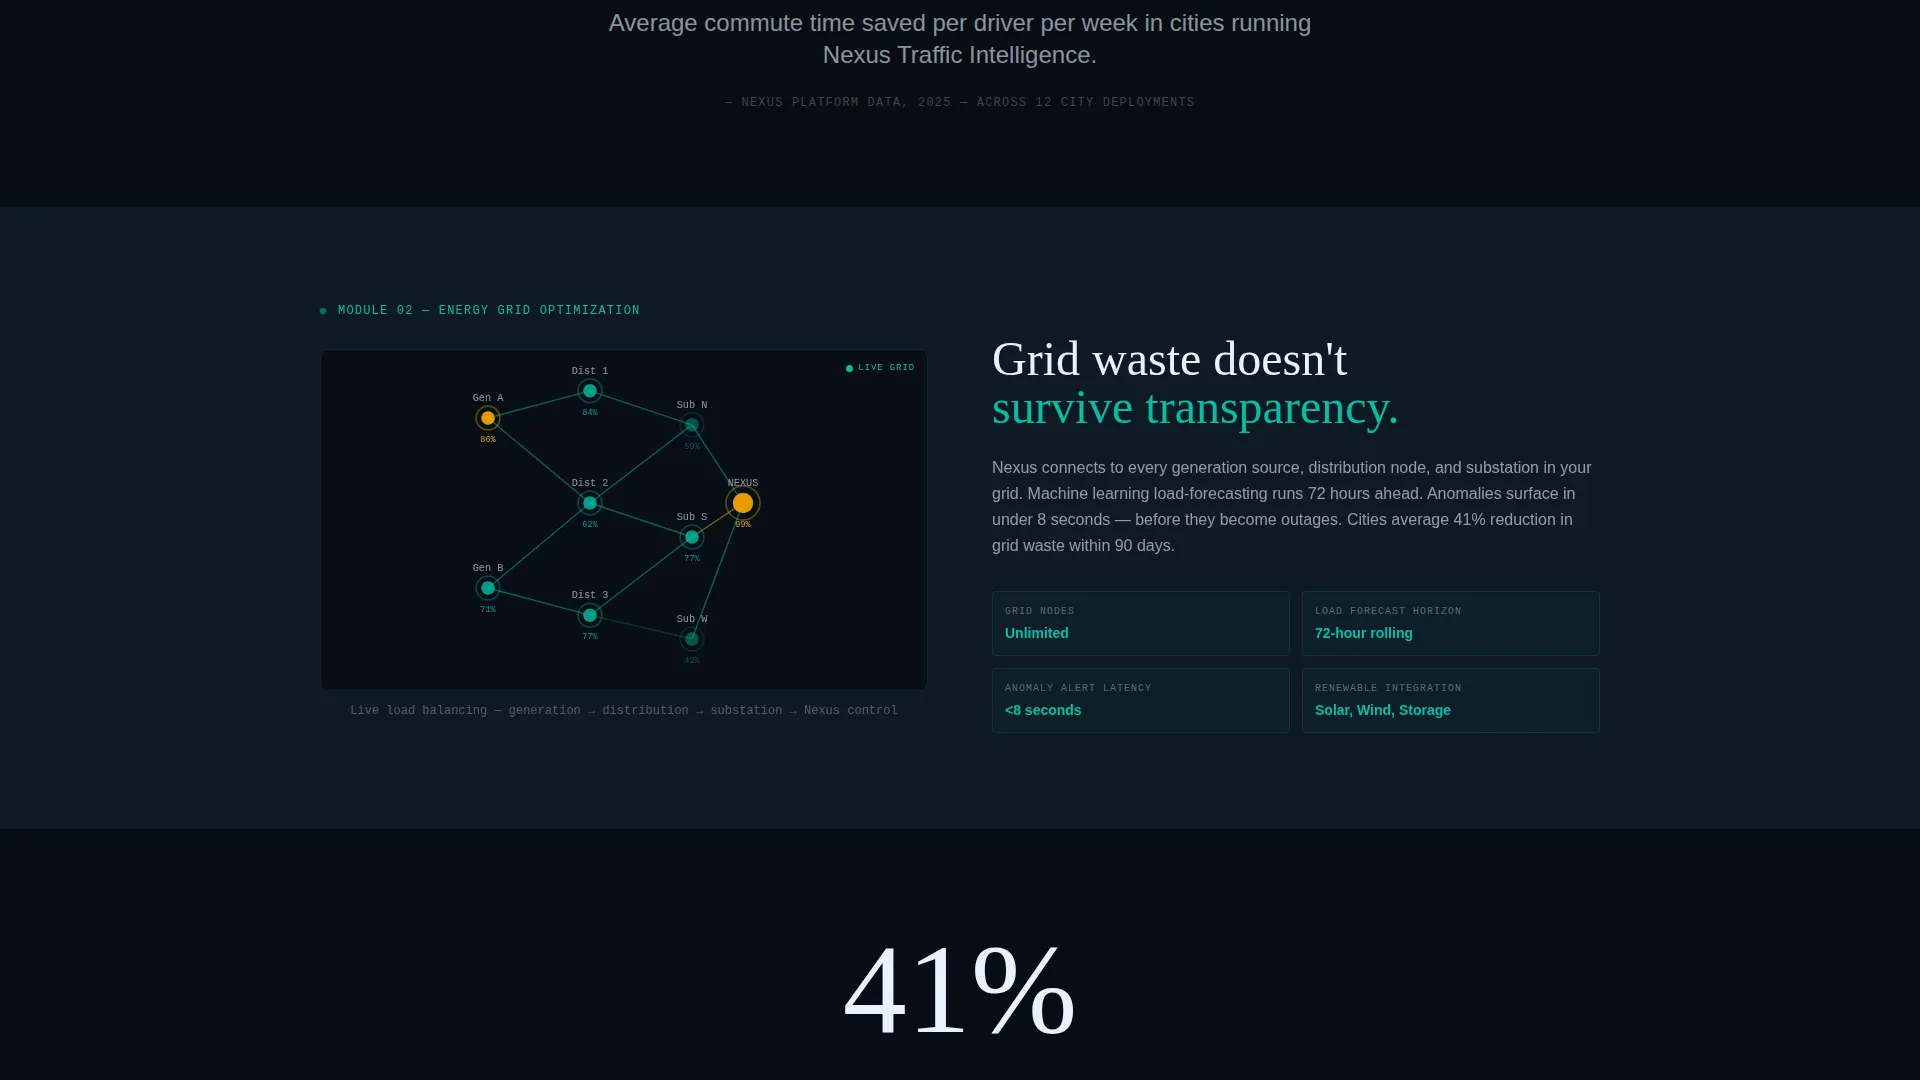
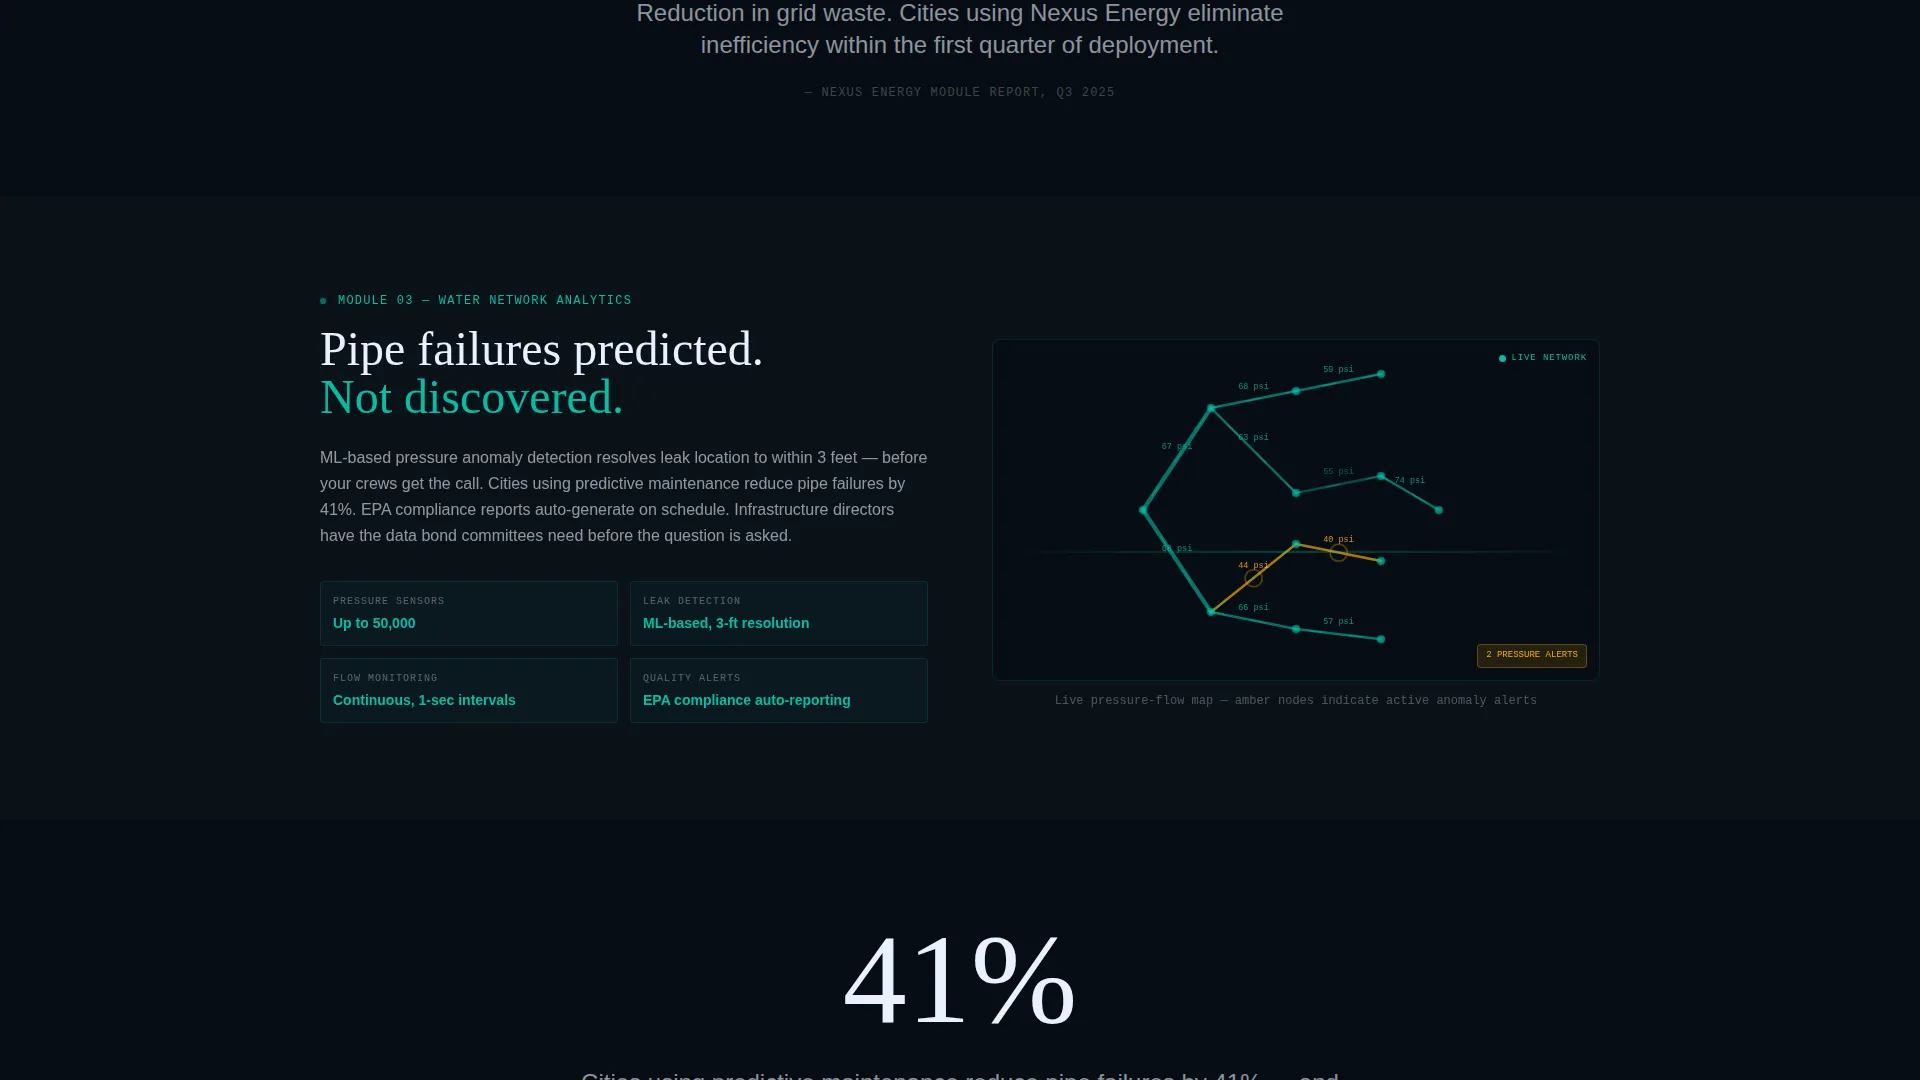
Each infrastructure module is locked behind scroll depth and slides in from the page edges using motion-eased transforms. Traffic intelligence appears first with an animated intersection heatmap. Energy grid optimization follows with a live load-balancing diagram. Water network analytics completes the sequence with a pressure-flow visualization. The scroll experience feels like systems coming online one by one.
Single-Stat Interstitial Sections
Between each feature module, a full-screen interstitial presents one bold statistic in white text on solid black with no decoration. These are deliberately sparse to let the data land hard. One example: "Cities using predictive maintenance reduce pipe failures by 41%."
Two-Path Conversion Flow
The primary conversion path is a three-field trial signup asking for work email, city or municipality name, and a primary infrastructure challenge selected from a dropdown. No credit card is required. The secondary path is a gated download for an Infrastructure ROI Report requiring only an email address, designed to capture planners not yet authorized to start a trial.
Sticky Bottom Conversion Bar
After the second module reveal, a persistent bottom bar appears carrying the primary call to action. It stays visible as visitors continue scrolling, reinforcing the next step without interrupting the content experience.
Animated Node-Mesh Background
The header background features a subtly animated mesh of interconnected nodes. It reads as a network topology while remaining abstract enough to feel universal across different city contexts. The animation is understated, keeping focus on the calculator and headline above it.
Page sections overview
| Section | Purpose |
|---|---|
| Header Calculator | Presents population slider, module toggles, and animated cost-savings estimate |
| Hero Headline | Anchors the value proposition with "How much is your city losing to blind infrastructure?" |
| Traffic Intelligence Module | Reveals animated intersection heatmap on first scroll depth trigger |
| Traffic Interstitial Stat | Delivers a single bold predictive-maintenance statistic on full black |
| Energy Grid Module | Reveals live load-balancing diagram on second scroll depth trigger |
| Sticky call to action Bar | Appears after energy module and persists through remaining scroll |
| Water Network Module | Reveals pressure-flow visualization on third scroll depth trigger |
| Energy Interstitial Stat | Delivers a single bold energy or grid statistic between modules |
| Trial Signup Form | Collects work email, city name, and infrastructure challenge via dropdown |
| ROI Report Gate | Offers gated Infrastructure ROI Report download requiring email only |
Design & branding system
The visual identity is built around a Teal Catalyst color system designed to evoke an operations center at full alert. Dark tones hold most of the canvas so data visualizations have room to breathe.
- Core palette: deep operations-room black (#0B1219) covers roughly 80% of the canvas; catalyst teal (#00BFA6) drives gradients, animated line-work, and active states; signal white (#E8F0FE) is reserved for data labels and body text; alert amber (#FFAB00) appears only on interactive hover states and call-to-action pulses
- Motion language follows a Dynamic Motion theme with scroll-triggered transforms, edge-entry animations for module reveals, and ticking number animations in the calculator
- Typography is purely functional, using signal white to keep data labels and body copy readable against the dark canvas without competing with teal visual elements
Mobile & speed optimization
The scroll-reveal structure and animated components are designed with a progressive experience in mind. The template is built to translate the operations-center aesthetic to smaller screens without losing the sense of depth or motion.
- Animations and motion-eased transforms are structured to work within a single-column mobile layout, keeping the reveal sequence intact on touch devices
- The calculator slider and module toggles are designed for touch interaction, so mobile visitors can still engage with the estimator and see savings figures animate in real time
- Section-by-section progressive disclosure naturally limits how much content loads on screen at once, supporting a lean rendering approach across device sizes
How this template helps you convert
The conversion architecture works because it earns trust before asking for anything. By the time a visitor reaches the primary call to action, they have already interacted with their own savings estimate.
- The header calculator creates a personalized savings number early in the visit, so the call to action "Launch Your City Dashboard" feels like verifying a result rather than responding to a sales pitch
- The sticky bottom bar repeats the primary call to action after the second module reveal, catching visitors who are convinced but still scrolling, without forcing them to scroll back to the top
- The gated ROI Report download gives a second conversion path for planners who are interested but not yet authorized to start a trial, keeping them in the pipeline with a single email field
Other information about this template
Nexus is categorized under Technology, with a sub-category focus on the Internet of Things and hardware ecosystems, and a niche alignment with smart city and infrastructure platforms. The template was designed for a Freemium or Trial conversion model, meaning the primary signup flow requires no payment details.
- The template style is Scroll Reveal (Progressive), meaning sections animate into view as visitors reach each scroll depth rather than loading all at once
- The header concept is a Calculator or Estimator, which is the primary interactive element and the main persuasion engine of the page
- The creative direction follows a Feature Matrix structure where each row represents one infrastructure module, revealed in sequence to reward visitor curiosity
- The Teal Catalyst color system and Dynamic Motion theme are designed to be customizable within the operations-room aesthetic, so teams can adapt headline copy, statistics, and module labels to reflect their platform's actual data
Theme
Dynamic Motion
Creative direction
Feature Matrix
Color system
Teal Catalyst
Style
Scroll Reveal (Progressive)
Direction
Freemium/Trial
Page Sections
Interactive Cost-savings Calculator
Progressive Scroll-reveal Modules
Single-stat Interstitial Sections
Two-path Conversion Flow
Sticky Bottom Conversion Bar
Animated Node-mesh Background
Related questions
Who is Nexus designed for?
Does the calculator require a back-end integration to work?
Can I adapt the three infrastructure modules to different platform features?
What does the trial signup form collect?
What is the gated ROI Report download for?



