Hospitality AI Analytics Dashboard Landing Page
Occupancy is a hospitality AI analytics landing page template built for hotel groups and resort chains that need portfolio-wide performance data at a glance. It combines a dark glassmorphic visual system with live-simulated KPI panels, animated data visualizations, and two conversion paths, a demo click-through and a report download, all without a single form on the page.
by Rocket studio
Quick summary
Occupancy is a bold, data-forward landing page template designed for hospitality AI analytics platforms. It places six live-simulated KPI panels front and center, guides visitors through an industry-report-style scroll narrative, and funnels qualified leads directly into an interactive demo environment. The aesthetic is dark, deliberate, and built for revenue-focused hospitality professionals.
Who this template is for
This template is built for hospitality technology companies and AI analytics platforms that sell to hotel and resort operators. It speaks directly to data-driven decision-makers who have no patience for slow, fragmented reporting tools.
- Revenue managers who toggle between multiple legacy property management systems daily
- VP-level operations leads preparing performance presentations for ownership groups
- Hospitality chief financial officers who need portfolio-wide snapshots without waiting for manual reports
What problem this template solves
Hotel groups and resort chains lose recoverable revenue every day because their performance data lives across disconnected systems. This template helps analytics platforms communicate the cost of that fragmentation and position their product as the solution.
- No unified view means revenue leaks go undetected until the night audit, or later
- Stakeholders waste time compiling spreadsheet reports instead of acting on signals
- Visitors arriving at a typical SaaS landing page have no immediate sense of the product's live data power
What you get with this template
You get a single-page layout that functions like a live control room briefing. The design, scroll structure, and conversion logic are all pre-built around the hospitality analytics buyer journey.
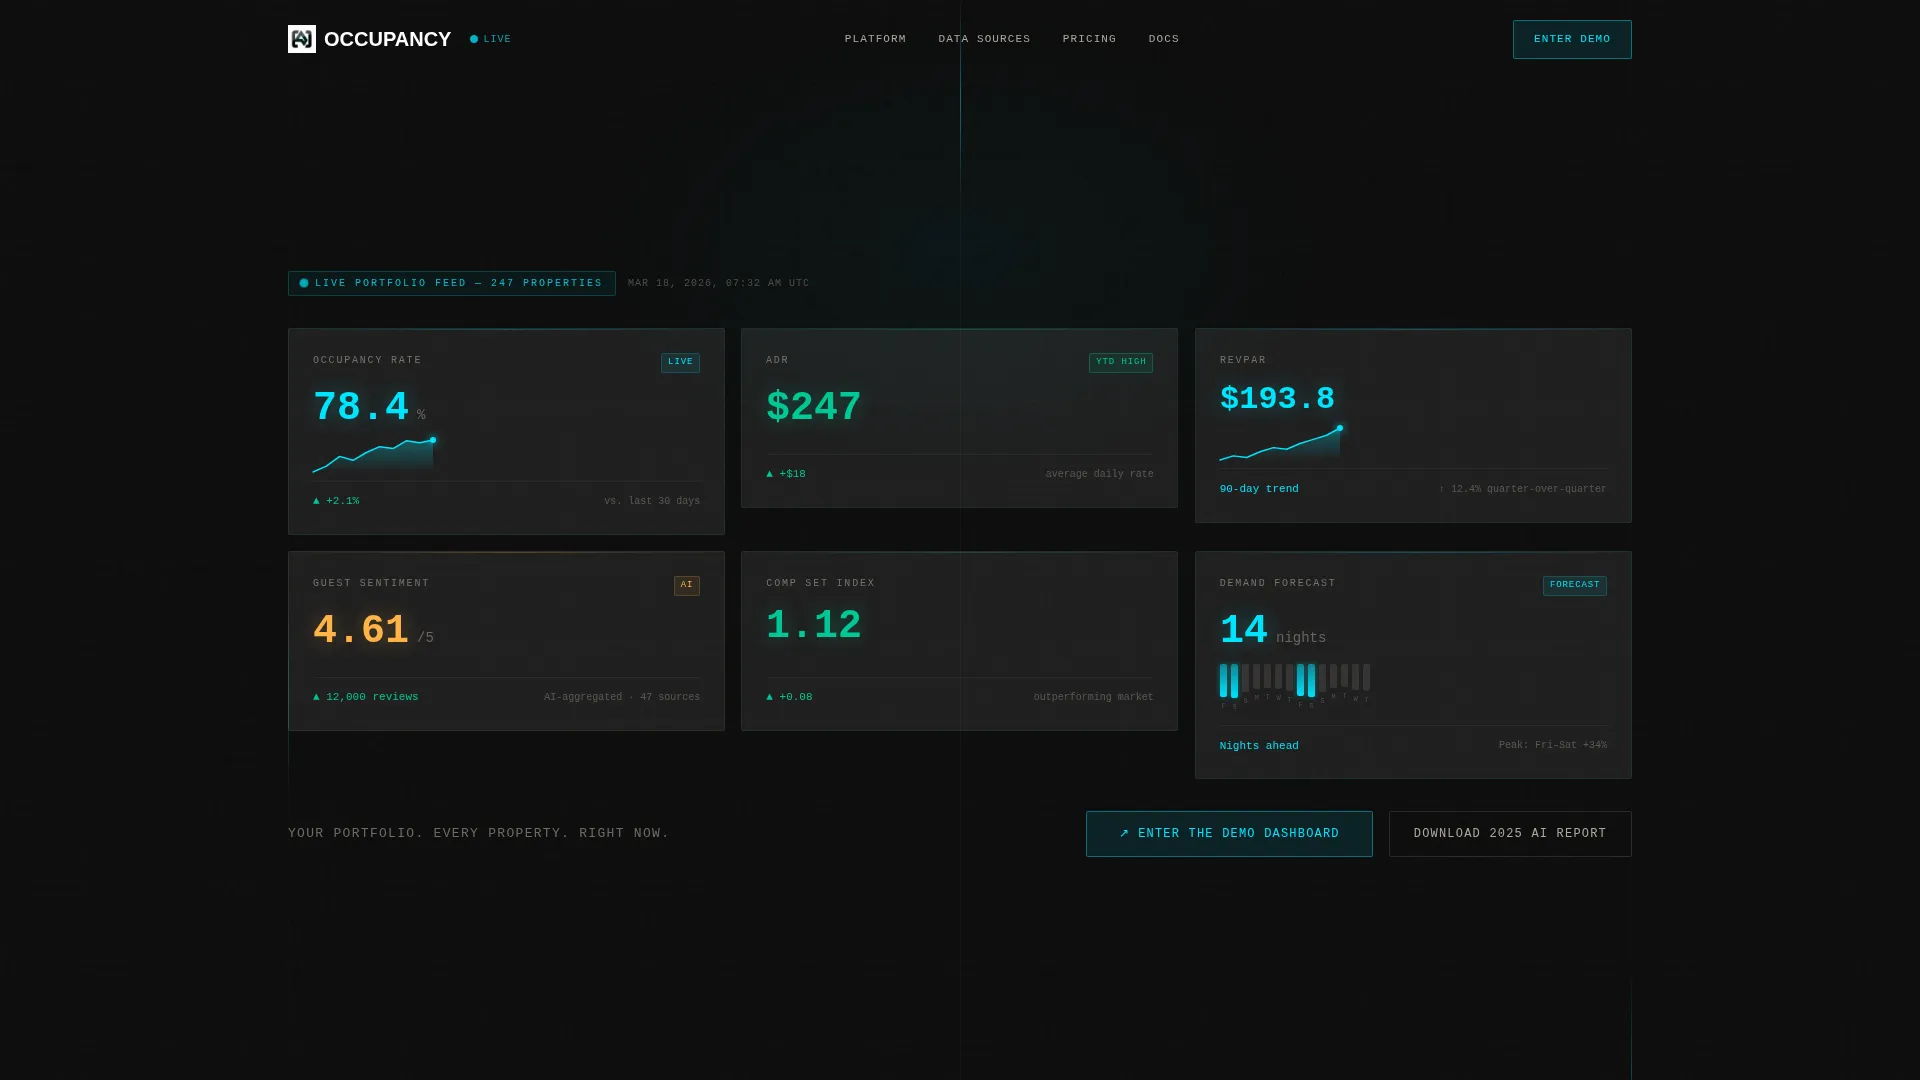
- A six-panel KPI header grid with live-simulated metrics including occupancy rate, average daily rate (ADR), revenue per available room (RevPAR), guest sentiment score, competitive set index, and a 14-night demand forecast heatmap
- Three content sections unfolding as an industry report: a macro revenue loss waterfall chart, a before-and-after property case study, and an exposed methodology block with data source and model diagrams
- Two frictionless conversion paths: a primary click-through to a gated demo and a secondary report download for visitors who need more context first
Feature list
This section highlights the core built-in capabilities of the Occupancy template.
Six-Panel KPI Header Grid
The header is a tight 3x2 grid of frosted-glass cards. Each card displays a live-simulated hospitality metric, including occupancy rate with a micro-sparkline, ADR with a delta indicator, RevPAR on a 90-day trend line, guest sentiment drawn from 12,000 reviews, a competitive set index, and a 14-night demand heatmap. A single line of monospaced text below reads: "Your portfolio. Every property. Right now."
Parallax Glass Depth Effect
Each header panel responds to mouse movement with a subtle parallax drift. The glass layers shift independently on hover, creating the impression of physical depth behind the screen. This motion reinforces the sense that live data is always in motion beneath the surface.
Industry Report Scroll Narrative
Scrolling past the header unfolds three escalating content sections. Section one presents a macro industry insight with an animated waterfall chart. Section two shows a property-level before-and-after dashboard comparison. Section three exposes the platform methodology using brutalist diagram blocks styled like architectural blueprints.
Dual Conversion Path Architecture
The primary call to action, "Enter the Demo Dashboard," appears twice: anchored below the header grid and again after the case study section with contextual copy. A secondary path offers a downloadable hospitality AI report for lead capture without requiring a demo commitment. No form appears on this page itself.
Bold Brutalist Glassmorphic Design System
Oversized monospaced section headers in all caps contrast against delicate frosted-glass containers. The tension between raw typographic authority and refined translucency is intentional. Every surface, from chart lines to button states, uses the electric cyan accent to create visual hierarchy without clutter.
Animated Data Visualizations
The template includes an animated waterfall chart for the macro revenue loss section and trend-line chart components used across the KPI panels. These visualizations are built into the scroll flow, activating as the visitor moves down the page to maintain engagement at every stage.
Page sections overview
| Section | Purpose |
|---|---|
| KPI Header Grid | Lead with six live-simulated hospitality metrics in frosted-glass panels |
| Primary call to action Block | Drive click-through to the interactive demo environment below the header |
| Macro Trend Section | Present industry-wide revenue loss data with an animated waterfall chart |
| Property Case Study | Show before-and-after dashboard views for a single anonymized property |
| Methodology Block | Expose data sources and AI model logic using brutalist diagram layouts |
| Secondary call to action Block | Re-engage visitors with contextual demo prompt after the case study |
| Report Download Path | Capture leads through a PDF report offer for visitors not ready to demo |
Design & branding system
The visual identity pairs a Bold Brutalist typographic structure with a Glassmorphic color system. The result feels like a luxury hotel lobby at midnight: every element deliberate, every layer suggesting depth behind it.
- Color palette: deep obsidian (#0D0D0D) as the primary background, translucent frost (white at 8% opacity) for glass card layers, electric cyan (#00E5FF) for chart lines and KPI highlights, and muted warm gray (#B0A999) for secondary text and axis labels
- Typography: oversized monospaced section headers in all caps create structural authority, while body text and data labels remain tight and readable at small sizes
Mobile & speed optimization
The template is built with a layout system that adapts the dense KPI grid and scroll-narrative sections for smaller viewports without losing the atmospheric visual quality.
- The 3x2 header grid reflows to a single-column card stack on mobile, keeping all six KPI panels visible without horizontal scrolling
- Animated elements and parallax effects are scoped to pointer-capable devices, so mobile visitors receive a clean, fast-loading version of the page
How this template helps you convert
The conversion logic is baked into the scroll structure itself. Visitors are never asked to commit before they understand the value.
- The KPI header grid immediately demonstrates the product's data depth, so visitors arrive in the right headset before reading a single line of copy.
- The case study and methodology sections build trust progressively, answering the implicit question "how does this actually work?" before either call to action appears again.
- Two exit paths ensure no qualified visitor leaves empty-handed: the demo click-through captures buyers, and the report download captures researchers.
Other information about this template
This template is designed specifically for the hospitality AI analytics niche and the technology category within template marketplaces. It is suited for platforms operating in the AI for hospitality space, particularly those targeting hotel revenue management and portfolio performance use cases.
- The template style is Dashboard and Data Grid, making it appropriate for products that lead with live data rather than marketing copy
- The creative direction follows an Industry Report format, which positions the platform as a thought leader rather than just a vendor
- The header concept is Dark Glass Panels, a visual approach that signals premium, data-intensive software to a hospitality finance and operations audience
- This template works well for platforms building toward an interactive demo funnel, as the entire page flow is optimized to deliver one frictionless click to the demo environment


Theme
Bold Brutalist
Creative direction
Industry Report
Color system
Glassmorphic
Style
Dashboard/Data Grid
Direction
Click-Through
Page Sections
Six-panel Live-simulated KPI Grid
Parallax Glass Depth on Hover
Industry Report Scroll Narrative
Dual Frictionless Conversion Paths
Bold Brutalist Glassmorphic Visual System
Scroll-activated Animated Charts
Related questions
Can I replace the simulated KPI data with real live data from my platform?
Does this template include the gated demo environment or the PDF report?
Is this template suitable if my platform serves individual hotels rather than large groups?
How does the dual call-to-action structure reduce friction for visitors?


