AI Farming Solutions Landing Page Template
The Yield AI Lead Scoring Agriculture landing page template is a dashboard-style, data-dense single-page layout built for ag-tech sales platforms. It combines an interactive lead card, bento-grid modules, a scoring methodology section, and a live revenue calculator, all wrapped in a dark instrument-panel aesthetic designed to turn territory data into confident sales calls.
by Rocket studio
Quick summary
Yield is a Click-Through landing page template built for AI lead scoring platforms serving the agricultural industry. It features a floating dashboard hero, an interactive lead card with a commodity price slider, expandable bento modules, a four-factor scoring methodology section, and a revenue calculator, all styled in a dark, data-dense instrument-panel theme that speaks directly to ag-tech sales directors.
Who this template is for
This template is built for teams selling AI-powered lead scoring tools into the agricultural industry. The layout, tone, and interactive sections all speak to buyers who live inside CRM dashboards, manage wide territories, and make decisions based on data, not gut feeling.
- Ag-tech sales directors managing multi-state territories who need AI-prioritized call lists
- Seed company sales reps juggling hundreds of grower accounts across tight planting windows
- Precision agriculture firms whose pipeline contracts and swells with the harvest calendar
What problem this template solves
Traditional lead scoring relies on manual analysis and heuristics that cannot keep pace with ag-sector sales cycles. Harvest windows open and close fast. Commodity prices shift overnight. A scoring system built on static scoring rules and generic demographic data simply cannot prioritize leads the way an AI-driven platform can.
- Sales reps waste sales efforts calling low-intent accounts while high-value grain buyers go cold
- Marketing teams lack the real time scoring visibility needed to align digital marketing spend with peak buying windows
- Traditional methods fail to account for seasonal shifts in customer behavior across large ag territories
What you get with this template
This template delivers a complete, production-ready landing page layout built around the Yield platform's core features. Every section is designed to move a visitor from curiosity to a live sandbox demo without a single form field blocking the path.
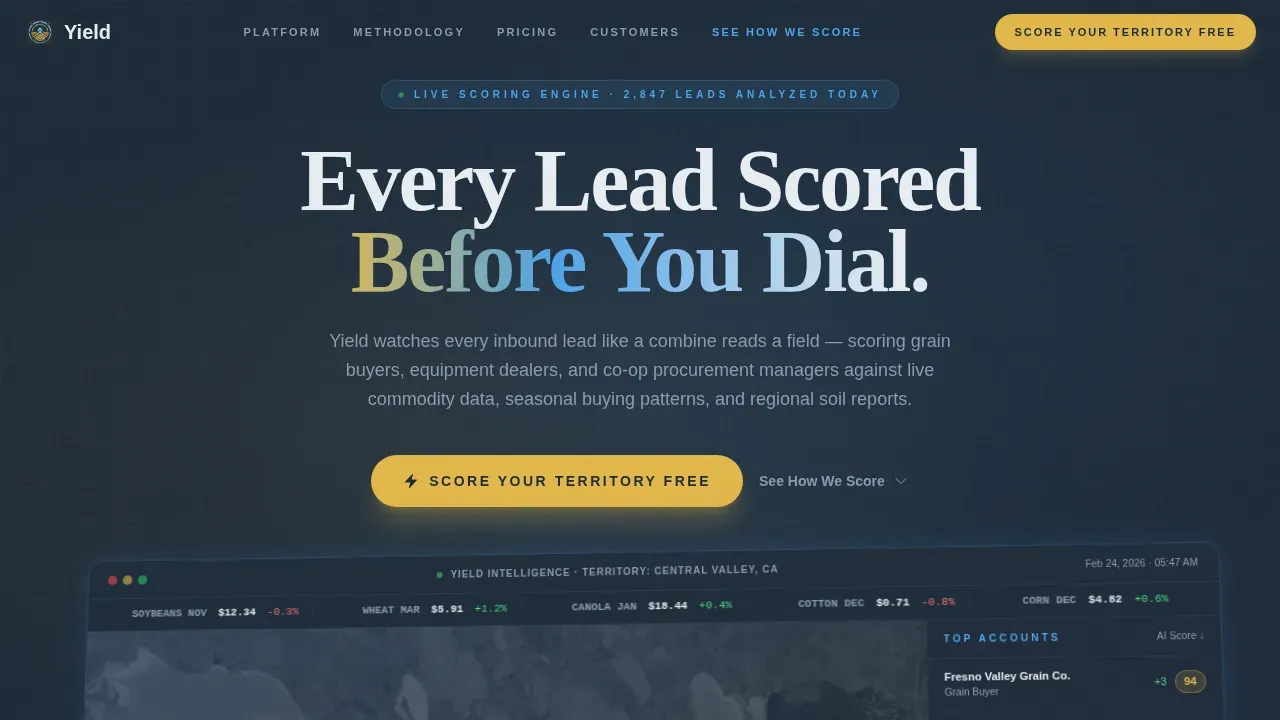
- A hero section with an angled, floating dashboard screenshot showing heat-mapped lead clusters and a live commodity ticker
- An interactive lead card where visitors toggle a commodity price slider and watch lead scores recalculate in real time
- A bento-grid module section covering territory mapping, seasonal pipeline forecasting, and CRM sync status, each expandable with animated data
Feature list
This template includes several purpose-built sections that reflect how an AI-powered lead scoring platform actually works in an agricultural business context.
Interactive Lead Scoring Card
Visitors can manipulate a commodity price slider directly on the page. As the slider moves, the lead score updates to reflect changes in purchase history weight, seasonal timing modifier, crop-price correlation, and engagement recency. This hands-on interaction demonstrates real time scoring before a prospect ever books a demo.
Floating Dashboard Hero
The hero section displays a pixel-perfect product screenshot angled on a charcoal background with a depth shadow. It shows a Central Valley map view with heat-mapped lead clusters, a sidebar ranking the top fifteen accounts by AI confidence score, and a live commodity price ticker. One lead card is expanded to show visible numerical values for each scoring factor.
Bento-Grid Module Explorer
Section three breaks the dashboard into expandable modules. Each card covers a core platform capability, territory mapping, seasonal forecasting, and CRM sync status. Visitors click to expand each module, triggering animated data fills that demonstrate how machine learning algorithms process engagement metrics and crm data in context.
Four-Factor Scoring Methodology
A dedicated methodology section explains the four weighted factors that drive the scoring model: purchase history, seasonal timing, crop-price correlation, and engagement recency. Animated data fills reinforce that this ai powered lead scoring system is built on historical data and live market signals, not guesswork or outdated scoring rules.
Revenue Leakage Calculator
Visitors enter their territory size and average deal size to receive a projected pipeline leakage estimate. This interactive tool uses predictive analytics logic to help potential customers quantify what they lose by relying on traditional lead qualification methods. It also reinforces the call to action that follows immediately below.
Ag-Sector Social Proof Strip
The template includes a social proof section with ag-sector-specific testimonials, displayed with territory sizes and company names. These trust signals serve both the analytical buyer who needs confidence in the scoring model and the sales director who wants peer validation before committing to a sandbox demo.
Page sections overview
| Section | Purpose |
|---|---|
| Hero Dashboard Screenshot | Anchors product credibility with a live-data visual and primary call to action |
| Interactive Lead Card | Lets visitors manipulate commodity data and observe score recalculation |
| Bento Module Grid | Expands platform capabilities across territory, forecast, and CRM views |
| Scoring Methodology Panel | Explains the four weighted factors driving each lead score |
| Revenue Calculator | Converts territory inputs into a projected pipeline leakage figure |
| Social Proof Strip | Ag-specific testimonials with territory and company context |
| Footer Row | Single-row linear footer with secondary navigation and legal links |
Design & branding system
The template follows a Dashboard Pro theme using the Slate & Sky color system. The palette mimics a weather radar at 5 a.m., dark and data-dense, with one high-contrast accent color signaling everything that demands action.
- Charcoal (#1E2A38) background and freshly turned soil slate (#3B4A5C) for panel surfaces, creating instrument-panel depth
- Open-sky blue (#4DA3E8) for primary interactive elements, calls to action, and data labels
- Early-wheat gold (#E2B84A) reserved exclusively for score badges and active-state indicators, so the eye always knows where to look first
- DM Sans for body copy and user interface elements; Fraunces for display headlines that carry the weight of the brand message
Mobile & speed optimization
The template is designed desktop-first, reflecting how ag-tech sales directors and sales reps actually review data grids, on large monitors during territory planning sessions. That said, the layout adapts cleanly for smaller screens without losing the instrument-panel feel.
- GSAP animations power the hero entrance and the interactive lead card, keeping transitions smooth without blocking content load
- Intersection Observer triggers section animations only when they enter the viewport, reducing unnecessary processing during scroll
- Server Components handle all static content while Client Components isolate the interactive calculator and slider, keeping the overall page footprint lean
How this template helps you convert
This template is built around a single conversion goal: push the visitor into a live sandbox demo loaded with anonymized ag-sector data. Every layout decision serves that goal.
- The primary call to action, "Score Your Territory Free," appears three times, in the navigation bar, beneath the interactive lead card, and after the revenue calculator, so there is always a clear next step visible without scrolling back to the top
- The interactive lead card and the revenue calculator both create a felt sense of value before any sales conversation begins, reducing friction for the analytical buyer who needs to trust the scoring system before committing
- A secondary text link, "See How We Score," anchors down to the methodology section for buyers who need to understand how machine learning algorithms and engagement metrics drive each score before they act
Other information about this template
The Yield AI Lead Scoring Agriculture Landing Page Template was designed with the specific challenges of the agricultural industry in mind. The agricultural industry faces unique business cycles, regional variation in soil conditions, and commodity price volatility that generic scoring tools cannot address. This template reflects those realities in both its interactive design and its narrative structure.
- The scoring model section acknowledges that ai algorithms require ongoing model training and that the platform continuously learns from new data to improve predictions over time
- The revenue calculator is built around the principle that an interactive ROI calculator can estimate improvements in lead conversion rates or reductions in customer acquisition costs for potential clients
- Demographic information, firmographic data, company size, and job title are all referenced within the expandable bento modules as data points the platform draws on to deliver accurate lead scores
- Various data points across data sources, including engagement patterns, website activity, website interactions, and crm data, feed the scoring system to support data quality and reduce human error
- The template supports overall efficiency for sales and marketing teams by surfacing lead qualification signals that would otherwise be time consuming to gather manually
- Marketing automation integration context is embedded in the CRM sync module, showing how the platform can integrate seamlessly with existing workflows and help save time on routine tasks
- The template is suitable as a starting point for teams building case examples, running market analysis, or validating an ai powered solution to skeptical stakeholders
- This layout can help align sales teams and marketing teams around shared engagement metrics, converting new leads more reliably across the sales funnel


Theme
Dashboard Pro
Creative direction
Interactive Explorer
Color system
Slate & Sky
Style
Dashboard/Data Grid
Direction
Click-Through
Page Sections
Interactive Commodity Price Slider
Floating Dashboard Hero Section
Expandable Bento Module Grid
Four-factor Scoring Methodology Panel
Revenue Leakage Calculator
Ag-sector Social Proof Strip
Related questions
What sections are included in this landing page template?
Can the interactive lead card and revenue calculator be customized?
How does the template demonstrate AI lead scoring to visitors?
Is this template suitable for teams new to AI-powered lead scoring?
What is the primary call to action on this landing page?


