Precision CAT MBA Coaching Landing Page Template
This landing page template is built for CAT and MBA coaching institutes that rely on structured, data-backed persuasion. It pairs a half-page classroom hero with frequently asked question-driven comparison tables, a percentile predictor quiz, and a gated 200-Day Study Plan download. Every scroll section answers a real aspirant question, turning a coaching page into the most useful free resource a CAT 2025 candidate will read all week.
by Rocket studio
Quick summary
The Percentile Precision CAT MBA Coaching Landing Page Template is a single-page, frequently asked question-driven layout built to convert anxious aspirants into engaged leads. It opens with a classroom hero, moves through side-by-side comparison tables, embeds a live percentile predictor quiz, and closes with a gated PDF download. Every section is designed to answer the question a candidate actually typed into a search bar before landing on this page.
Who this template is for
This template suits coaching institutes and independent mentors who prepare candidates for the common admission test and need a page that earns trust before asking for a sign-up. It is ideal for brands that rely on real outcome data, sectional strategy depth, and structured study architecture to differentiate themselves from larger platforms.
- Final-year engineering students, working professionals with three or more years of corporate experience, and commerce graduates retaking the CAT exam after a first attempt.
- Coaching institutes that can show verified percentile data, real admit results, and a clear score versus percentile improvement story.
- EdTech teams building a content-led funnel around a free resource such as a 200-day study planner or a cat percentile predictor quiz.
What problem this template solves
Aspirants who have appeared for CAT before, or who are researching institutes at midnight on a phone screen, do not want a brochure. They want answers. Most coaching pages answer with marketing copy. This template answers with structured comparison tables, real marks data, and a live score calculator, so by the time a visitor reaches the call to action, they have already received more clarity than most paid consultations offer.
- Visitors cannot compare study plans, mock test counts, or mentor ratios side by side on typical coaching pages, so they leave without converting.
- Candidates do not understand how their raw score becomes a scaled score and then a final percentile, which creates uncertainty that undermines confidence and delays enrollment decisions.
- Institutes lose leads because their pages ask for commitment before demonstrating value.
What you get with this template
The template delivers a complete single-page layout structured around seven content sections, a Forest Trust color system, and two conversion paths, a gated PDF download and an email-gated percentile predictor quiz. Every element maps to a real aspirant need, from the hero stat strip to the IIM admit results table at the bottom of the page.
- A half-page hero with a classroom photograph, headline, and a three-stat social proof strip showing selections, IIM converts, and average cat percentile for completers.
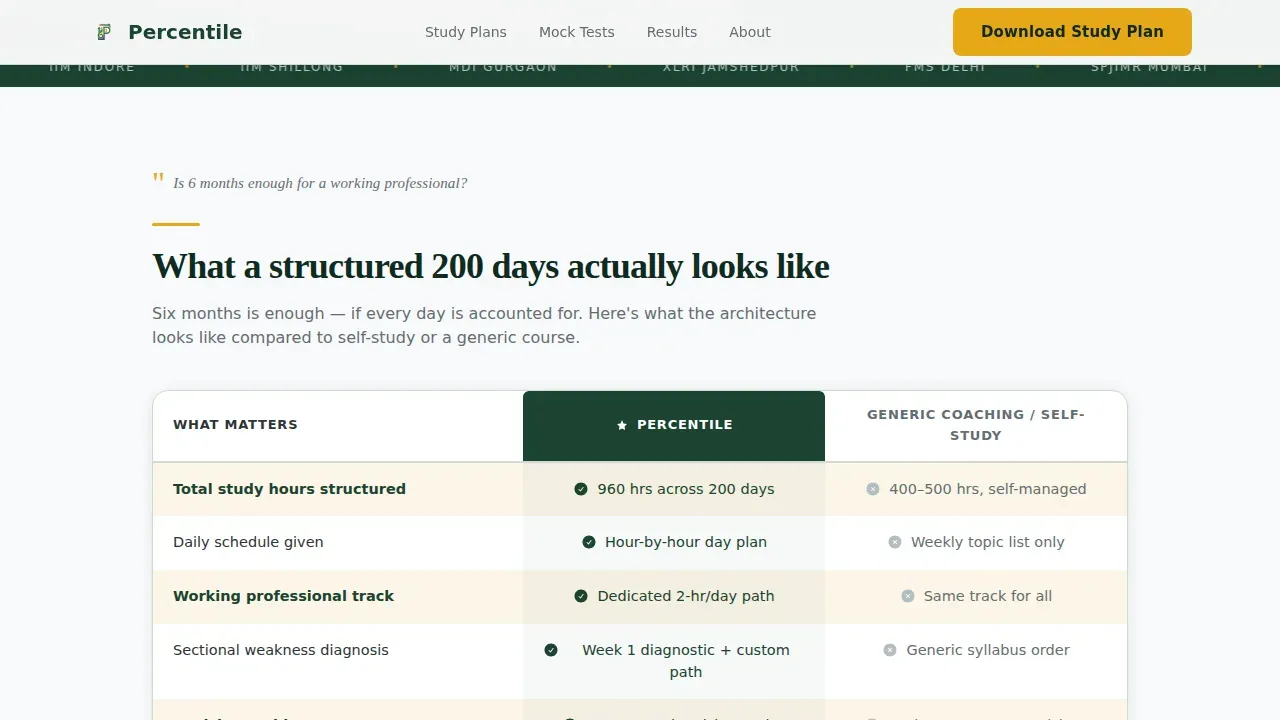
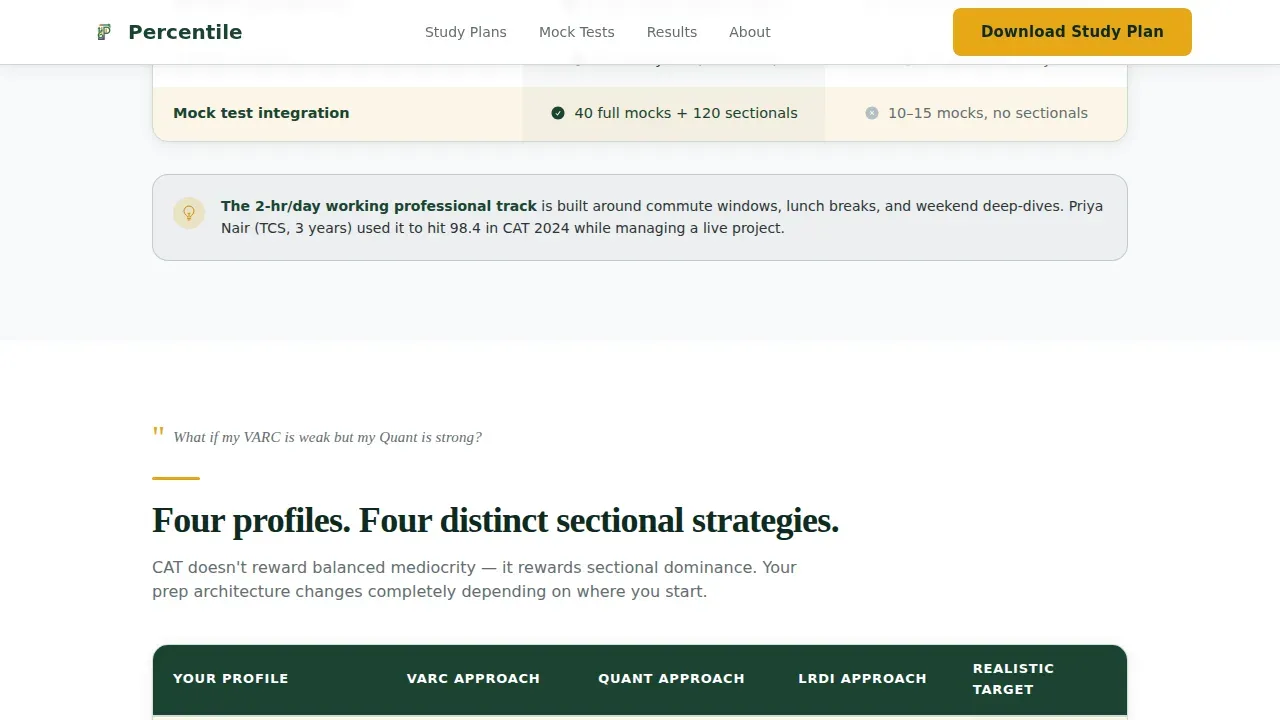
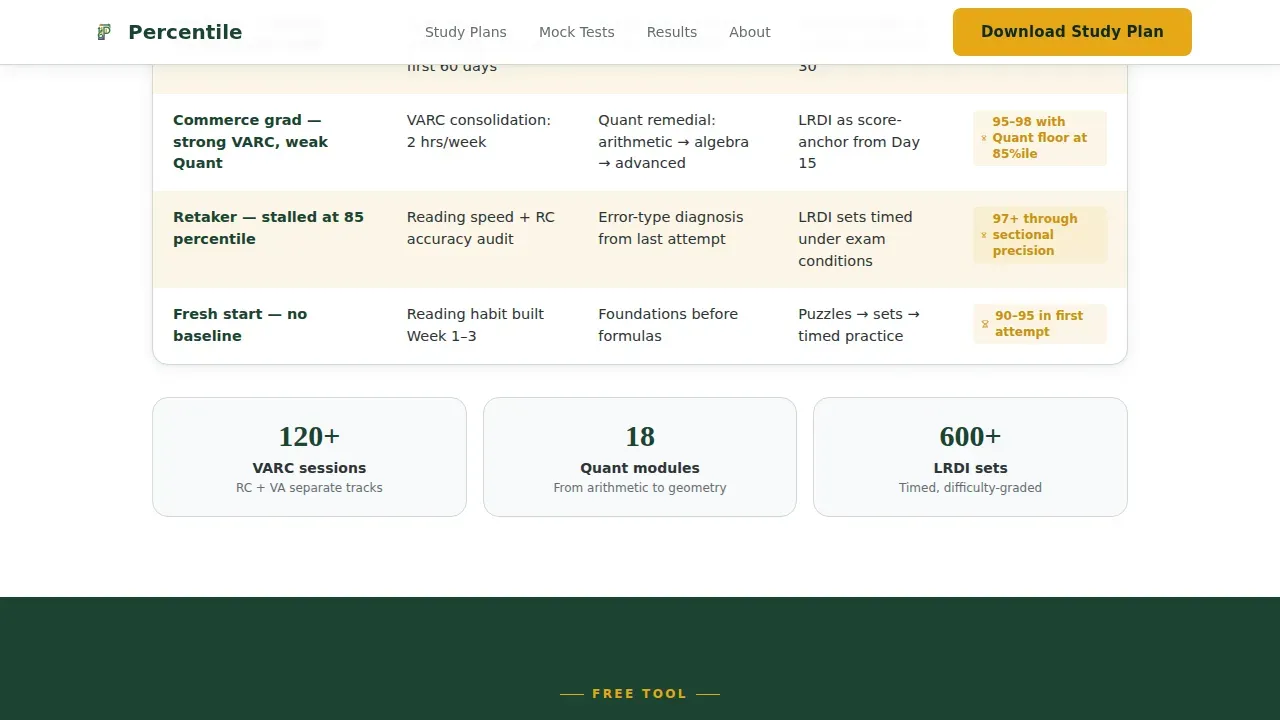
- Three frequently asked question-anchored comparison tables covering study plan duration, sectional strategy depth across varc section, dilr sets, and quant questions, and a feature comparison against competing platforms.
- A gated 200-Day Study Plan PDF form with three fields: name, exam target year, and current preparation stage, plus a mid-page percentile predictor quiz that captures email id only after showing results.
Feature list
This template is built around features that match the real decision-making process of a CAT 2025 aspirant. Each component below is drawn directly from the brief.
frequently asked question-Driven Comparison Table Layout
Each major scroll section opens with a question candidates actually search for before the exam. That question anchors a structured comparison table. Rows highlight on hover using amber, and the most important row stays permanently highlighted so visitors can scan quickly. The tables compare study plans, sectional depth, mock tests coverage, and mentor ratios side by side, making score versus percentile impact visible in one glance.
Embedded Percentile Predictor Quiz
A mid-page interactive quiz acts as the template's second conversion path. Candidates enter data about their preparation stage and expected performance. The cat percentile predictor shows a predicted percentile on screen and then asks for an email id to deliver a detailed analysis. This approach gives the visitor a useful expected cat percentile estimate before requesting any contact detail, which increases form completions significantly.
Gated 200-Day Study Plan Download
The primary call to action sits at the bottom of the page as a three-field form. Candidates choose their profile: fresh start, retaker, or working professional. The form gates a sectional PDF planner that covers all the topics across VARC (Verbal Ability and Reading Comprehension), DILR (Data Interpretation and Logical Reasoning), and QA (Quantitative Ability). It is the template's anchor lead-capture mechanism and is placed only after every comparison question has been answered.
IIM Admit Results Table
A dedicated results section displays last season's admit data sorted by IIM tier, including new IIM seats. This table functions as the most powerful trust signal on the page. It shows candidates where students who appeared for CAT with this institute actually landed, moving the conversation from predicted percentile to real cat result outcomes.
Score Normalization Explainer Section
The template includes a section that explains how raw scores become scaled scores using the CAT normalization process. Candidates learn that scores across three slots cannot be directly compared due to difficulty level variation, and that normalization is used to ensure fairness. Understanding this process helps aspirants interpret their cat score calculator outputs and mock test performance with more accuracy.
Forest Trust Visual Identity System
The design uses a structured color palette: deep institutional green for section backgrounds, blackboard slate for body text, chalk-dust white for breathing room between comparison rows, and selection-highlight amber for every interactive element. Typography pairs DM Sans for body copy with Fraunces for authoritative headline treatment. No gradients, no decorative illustration, credibility comes from the data on the page.
Page sections overview
| Section | Purpose |
|---|---|
| Hero classroom photo | Establishes credibility with real classroom imagery, headline, and a three-stat proof strip |
| frequently asked question Comparison One | Answers study plan duration question with a side-by-side table for working professionals |
| frequently asked question Comparison Two | Compares sectional strategy depth across VARC, DILR sets, and quant questions |
| Percentile Predictor Quiz | Captures email after showing the candidate their expected cat percentile result |
| frequently asked question Comparison Three | Feature table comparing the institute against other platforms on key preparation dimensions |
| IIM Admit Table | Displays real admit results by IIM tier to show where last season's candidates were selected |
| Download call to action Form | Three-field gated form delivering the 200-Day Study Plan PDF to segmented aspirant profiles |
| Footer linear row | Single-row footer with navigation links and minimal contact information |
Design & branding system
The visual identity follows a Corporate Precision theme that feels like the wood-paneled seminar room of a serious institution. Every color choice is functional: green commands attention, slate carries the argument, white gives the eye space to rest, and amber marks every action worth taking.
- Forest Trust palette: deep institutional green (#1B4332) for section backgrounds and header bars, blackboard slate (#2D3436) for body text, chalk-dust white (#F8F9FA) for row breathing room, and selection-highlight amber (#E6A817) for all call-to-action buttons and active table rows.
- Typography system: DM Sans handles all body copy for clean on-screen readability, while Fraunces delivers authoritative serif weight to headlines, creating a tone that feels earned, not decorated.
Mobile & speed optimization
Over 60 percent of CAT aspirants browse coaching pages on a phone late at night. This template is built mobile-first, with tap-friendly button sizing, stacked comparison table layouts for smaller screens, and scroll-reveal animations that load content progressively rather than all at once.
- Comparison tables reformat to vertically stacked cards on mobile so candidates can still scan score versus percentile data without horizontal scrolling.
- The percentile predictor quiz and gated download form use large input fields and a single visible call to action per screen, keeping the conversion path friction-free on small displays.
How this template helps you convert
The template is built around a content-first conversion model. Visitors receive strategic value on every scroll before they are asked for anything. By the time the download form appears, the candidate has already used the cat percentile predictor, reviewed the admit table, and compared study plans. Trust is built before commitment is requested.
- The frequently asked question-anchored tables answer every comparison question a candidate brings to the page, removing the need to visit competitor sites. Candidates who find their answer here stay on the page and move toward the download form with higher intent.
- The embedded percentile predictor quiz shows the visitor their expected cat score and predicted percentile before asking for an email id, following the principle of delivering value first, then capturing the lead.
- The gated PDF form segments leads by profile (fresh start, retaker, or working professional), giving the institute immediately usable data about each candidate's preparation stage and cat 2025 or cat 2026 timeline.
Other information about this template
This section covers additional context about the data, scoring mechanics, and broader preparation landscape that the template is designed to address, helping both visitors and template users understand the full scope of what this page communicates.
- The CAT exam consists of three sections: VARC, DILR, and QA. The CAT selection process uses a composite score that includes CAT performance, Written Ability Test (WAT), Personal Interview (PI), and candidate profile details. Candidates need to prepare for WAT and PI rounds after the cat result is declared. Each B-school conducts its own process based on its admission policy.
- CAT score normalization is applied to ensure fairness across the three slots. The CAT uses a two-stage normalization process to convert raw scores into scaled scores. Raw scores from different slots cannot be directly compared because each slot uses a different test form. The scaled score for each section is summed to get the overall score. Scaled scores above 100 are capped at 100 in final reporting. The final percentile uses the formula P = ((N - r) / N) x 100, where N is the total number of candidates and r is rank. If two candidates share the same scaled score, they receive the same rank.
- A strong cat percentile predictor adjusts your raw score for the difficulty level of your specific slot and compares it against historical score distributions to estimate a realistic percentile. The accuracy of any cat percentile predictor depends primarily on how well it accounts for slot-wise difficulty variations. The outcome is always an approximation, and actual cat results may differ.
- Effective rough sheet use during the exam can impact your cat score significantly. A well-organised rough sheet leads to faster problem-solving, fewer wrong answers, and a higher percentile score. Knowing what to put on your rough sheet keeps it clean and useful. Messy rough work forces you to start over when you return to a question, wasting time on exam day. Using columns or small tables on the rough sheet helps organize skipped questions and topics. Maintaining a small table noting question numbers and topics on a dedicated page supports efficient last-minute review.
- The template design follows principles well-established across effective CAT coaching pages: benefit-driven headlines, verified social proof with actual percentile improvements, prominent calls to action above the fold, and a minimalist layout that avoids overwhelming candidates browsing on a phone screen.
- iQuanta's cat score calculator helps students compute scores quickly from their response sheet. A cat response sheet is the official record of all choices made during the exam. Reviewing the response sheet after mock tests and the live exam is a standard step in any effective preparation strategy. The cat percentile calculator tools available from platforms like Career Launcher use percentile based normalization models to deliver predicted percentile estimates with minimal deviation from actual results.
- For cat 2025 and cat 2026 aspirants, the template supports both immediate enrollment campaigns and longer-horizon drip funnels by segmenting the download form response into three preparation profiles. Evening sessions and working-professional batch details can be surfaced in comparison table rows without any additional page modifications.
- B schools in India vary widely in their selection criteria. Top b schools weight cat performance heavily in the first screen, but profile details, group discussions, written ability test scores, and personal interview performance all factor into the final selection. Candidates who focus only on achieving a good score without preparing for post-exam rounds risk losing calls even with a higher percentile.

Theme
Corporate Precision
Creative direction
FAQ-Driven
Color system
Forest Trust
Style
Comparison Table
Direction
Content/Resource
Page Sections
Faq-driven Comparison Tables
Embedded Percentile Predictor Quiz
Gated 200-day Study Plan Download
IIM Admit Results Table
Score Normalization Explainer
Forest Trust Visual Identity
Related questions
How does the percentile predictor quiz work on this template?
What does the score normalization section explain to visitors?
Can working professionals and retakers both use this template layout?
What sections handle post-exam preparation like WAT and PI?
How is this template different from a standard coaching brochure page?