Complete Pharmaceutical Software & SaaS Professional Website Template
Pharmacommand is a pharmaceutical analytics landing page template built for professionals who work at the speed of market-moving data. It combines a live code snippet header, an interactive pipeline query tool, and dark-background data visualizations to put visitors inside a real decision environment from the first scroll. The template is designed for freemium and trial conversion flows.
by Rocket studio
Quick summary
Pharmacommand is a single-page template that puts pharmaceutical analytics front and center. It opens with a live-styled API code block, drops visitors into an interactive clinical trial pipeline tool, and walks them through escalating data views, from patent expiry heatmaps to FDA calendar overlays. The design uses a deep midnight navy palette that feels like a real operations command center.
Who this template is for
This template is built for teams and individuals who make high-stakes decisions using drug development data. It speaks directly to professionals who need to evaluate a platform quickly and trust what they see before signing up.
- Biotech equity analysts running pre-market models across clinical trial pipelines and probability-of-approval scores
- Medical affairs directors mapping competitive landscapes across multiple therapeutic areas
- Business development teams at mid-size pharmaceutical companies scanning for in-licensing opportunities before conference windows close
What problem this template solves
Pharmaceutical analytics platforms serve a sophisticated audience. A generic software landing page, hero image, bullet list of features, a "Book a Demo" button, does not earn trust from analysts who live inside data tools all day. The real challenge is proving capability before asking for a commitment.
- Visitors leave before they understand the platform's depth when there is no interactive demonstration
- Biotech and pharma professionals are skeptical of feature descriptions and respond better to seeing actual data rendered on screen
- Conversion suffers when the gap between "reading about the tool" and "using the tool" feels too large
What you get with this template
You get a fully structured pharmaceutical analytics landing page that leads with a working product experience rather than marketing copy. Every section is built around a data visualization or interactive component, not a text description.
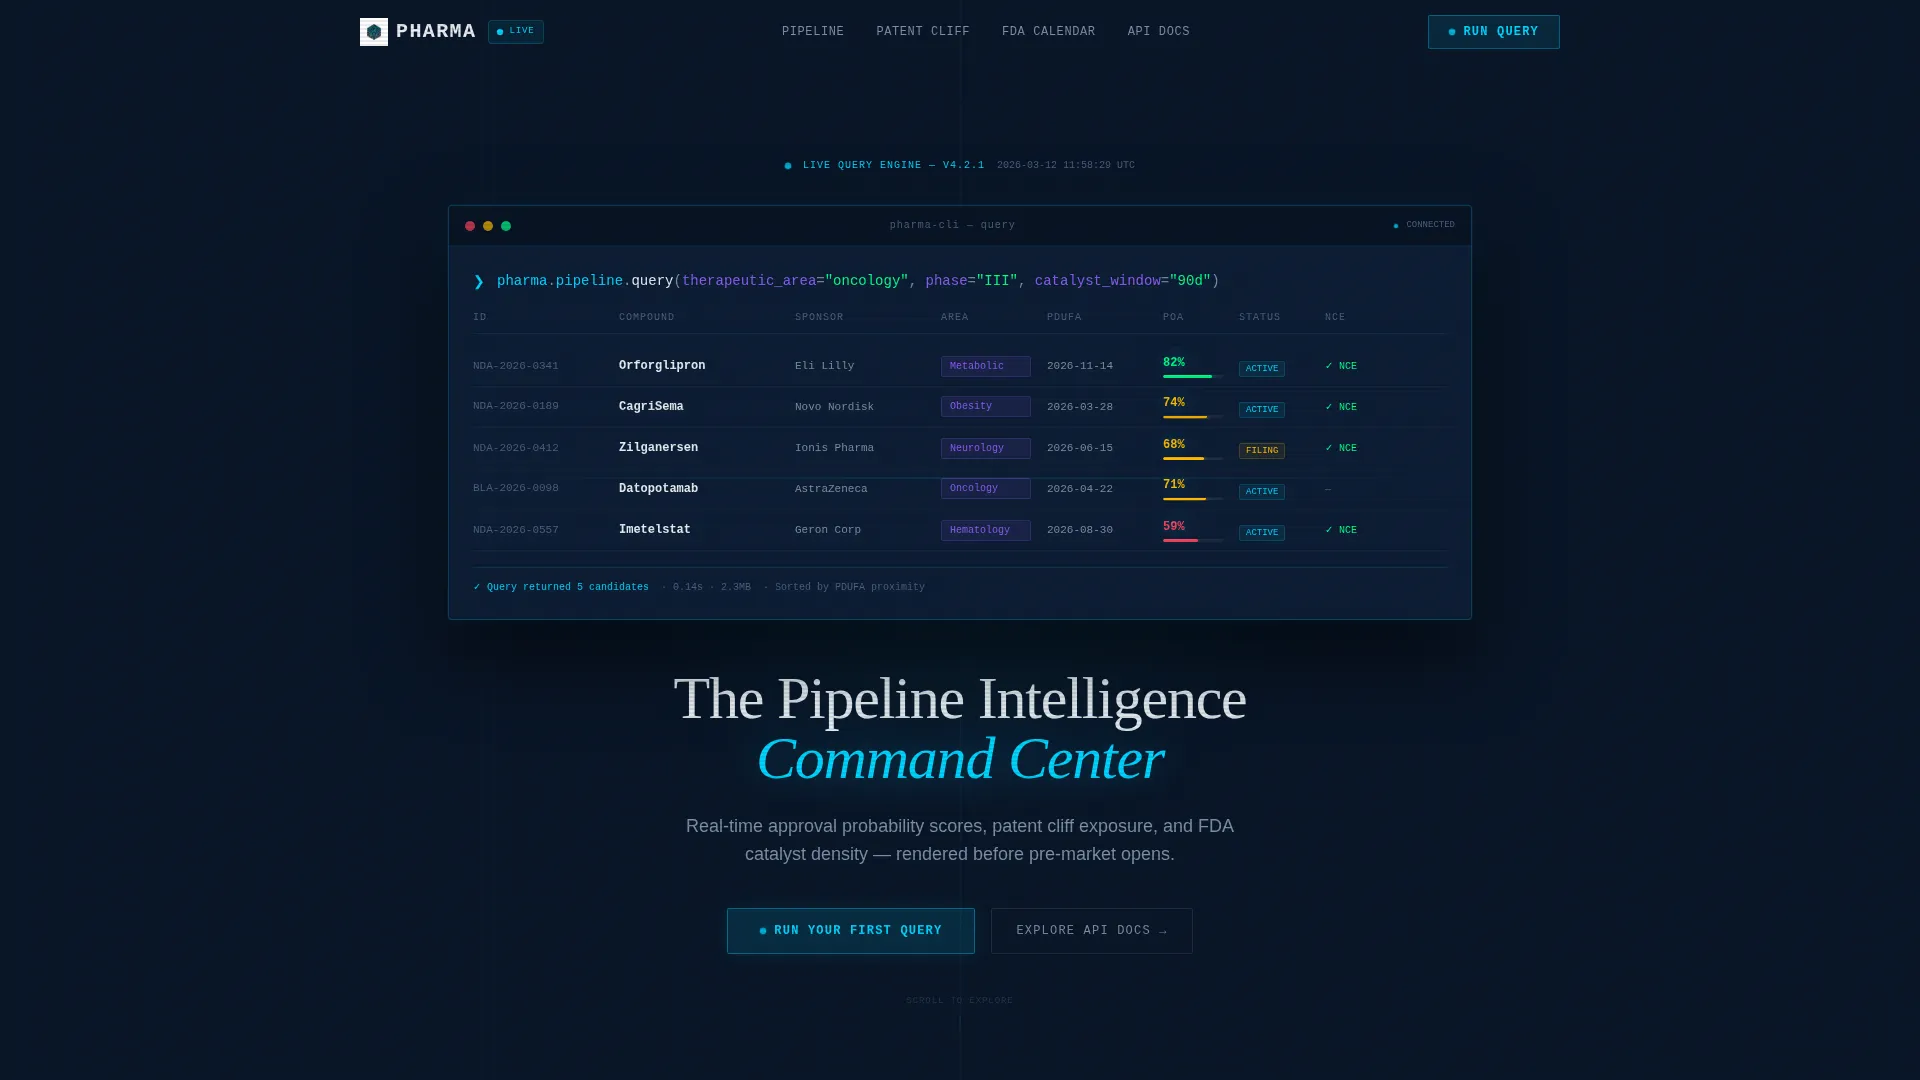
- A live-styled code snippet header showing a real application programming interface (API) query call with syntax-highlighted output rendered as a data grid
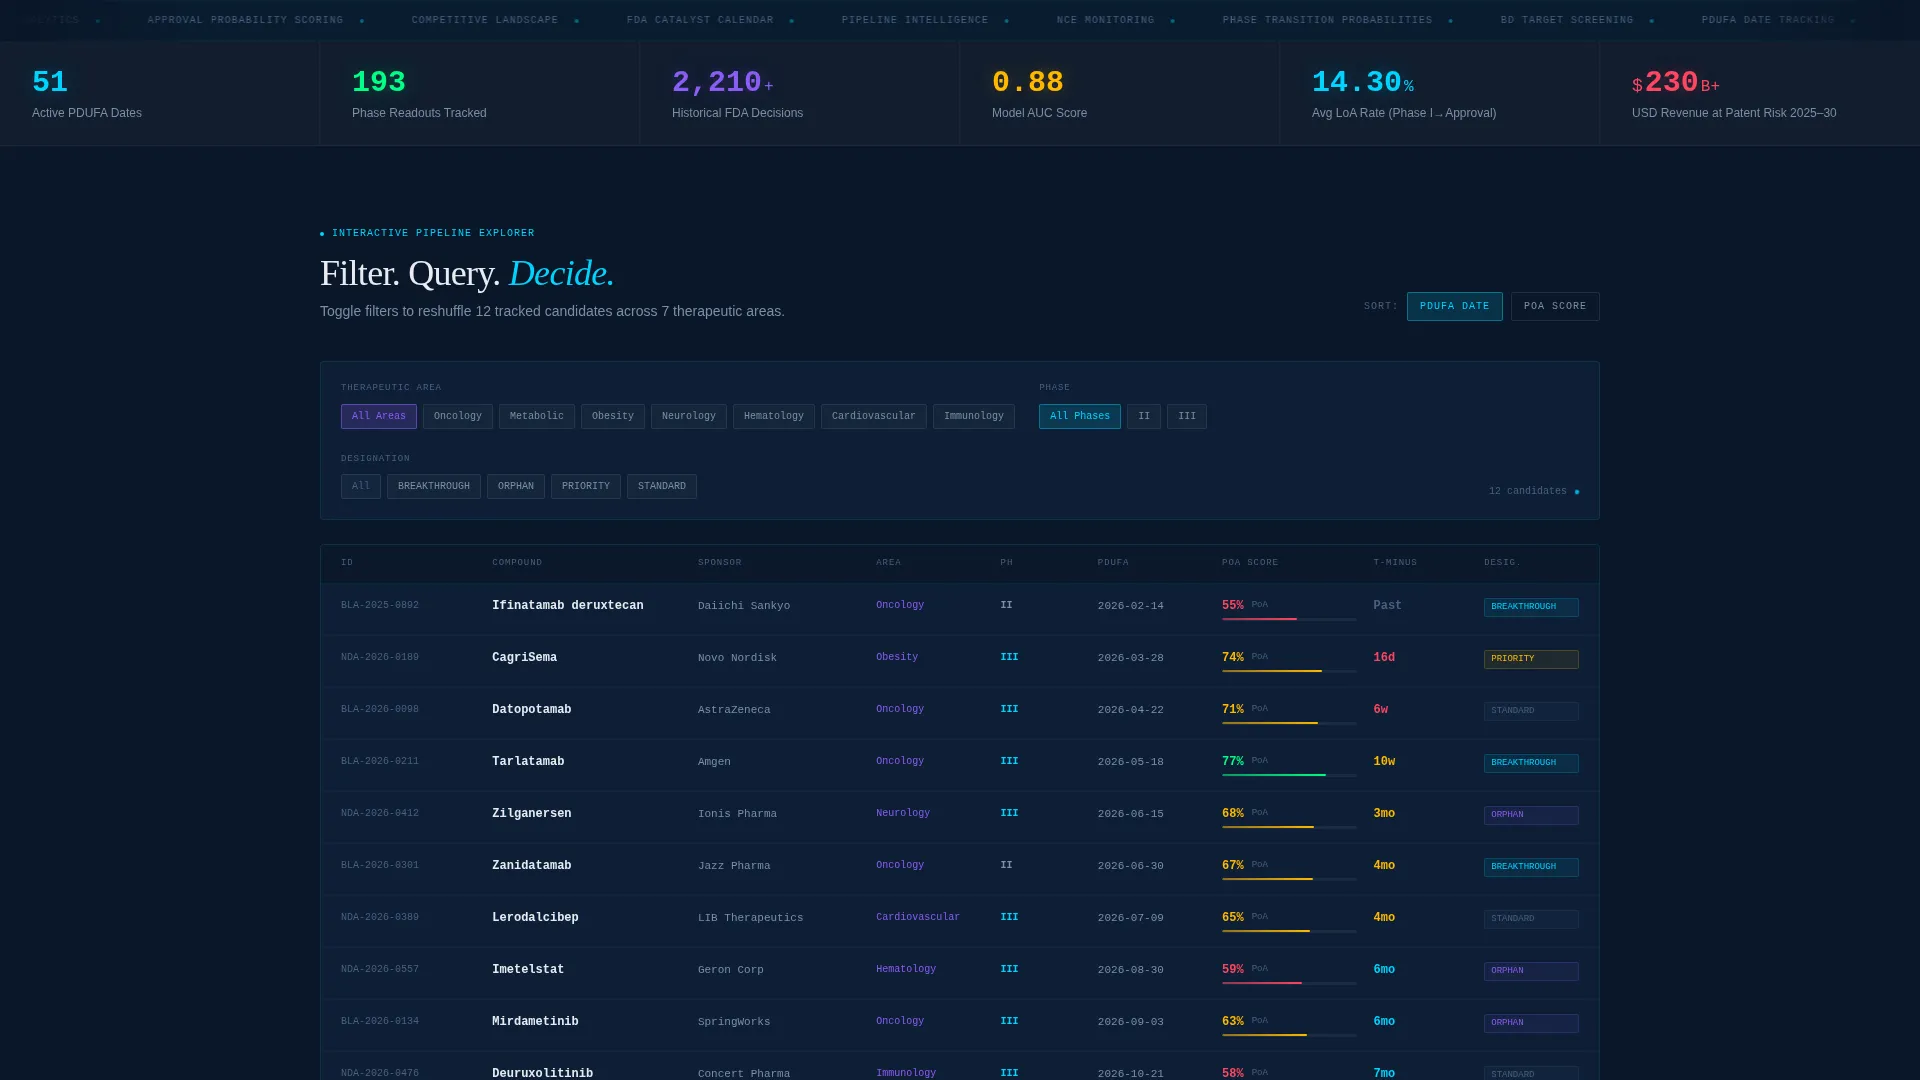
- An interactive therapeutic area selector and pipeline phase filter that reshuffles a sample data grid with real compound names and dates
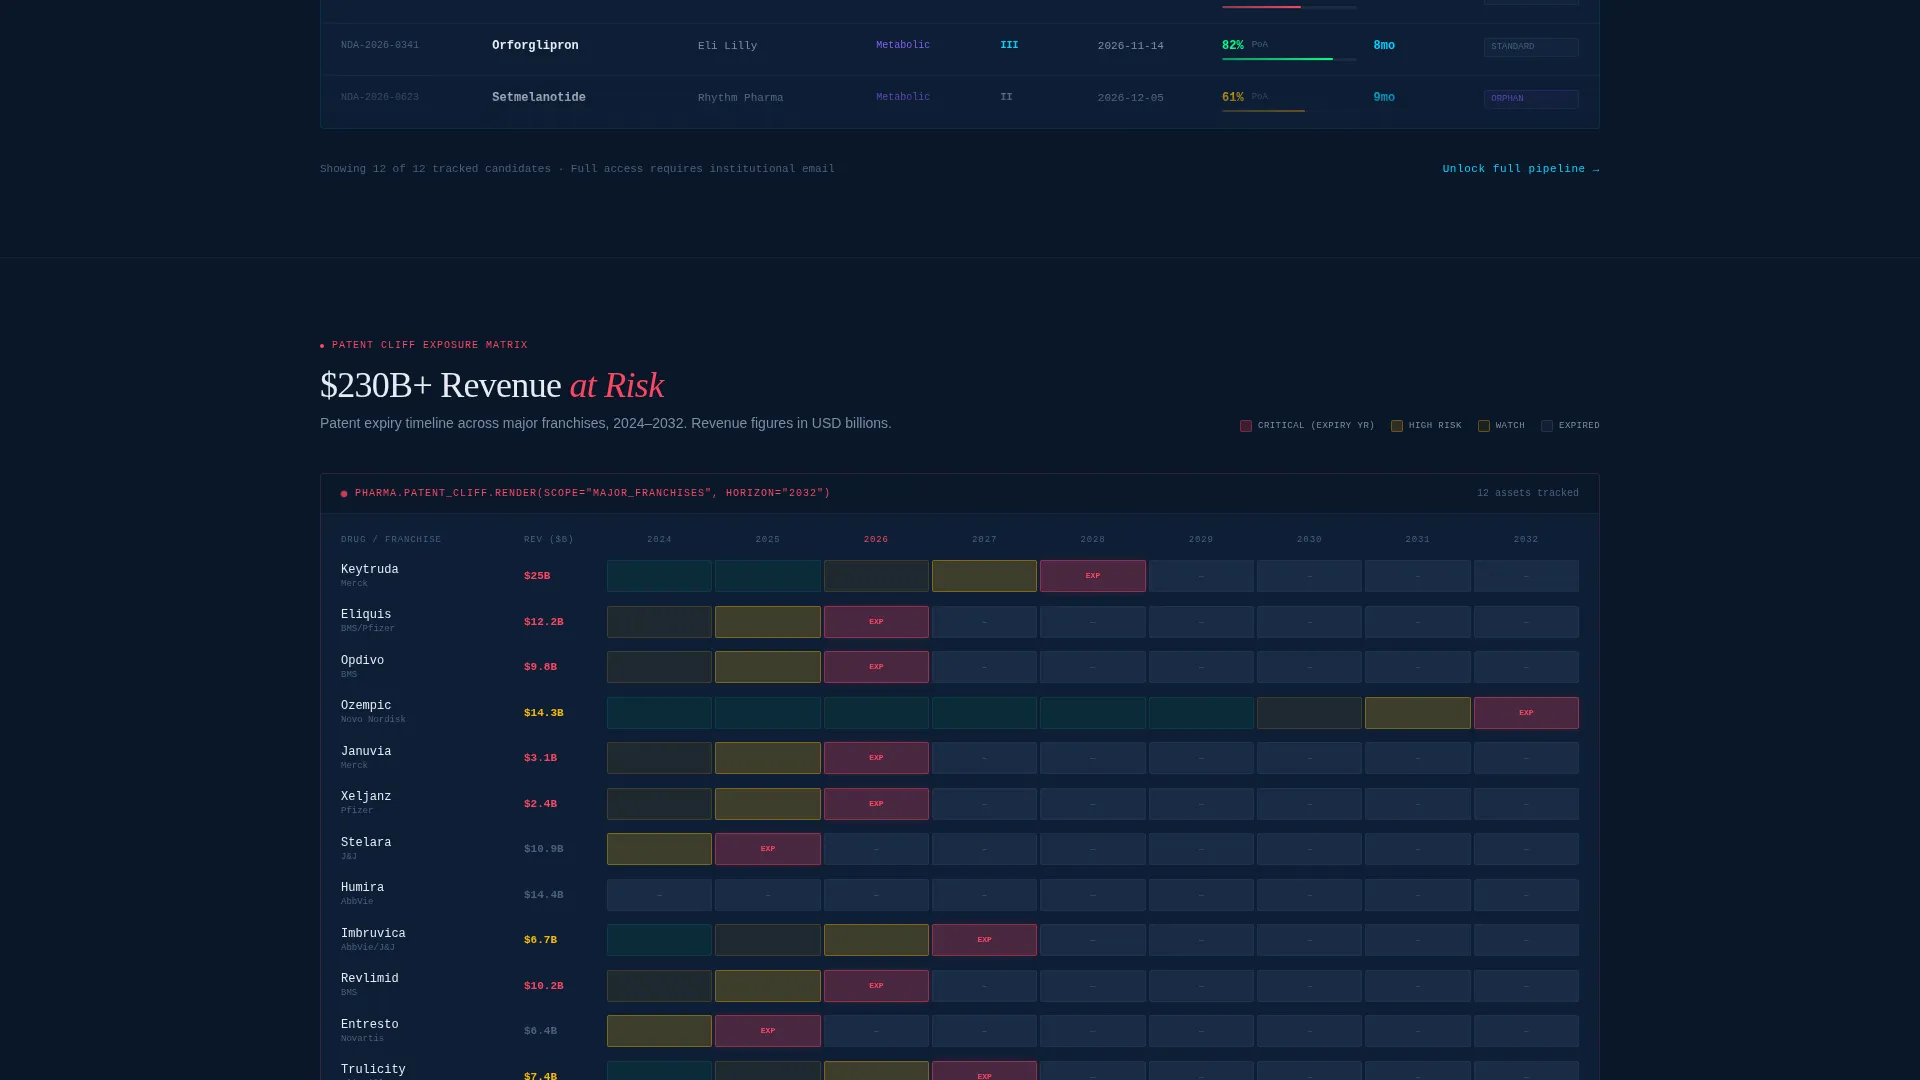
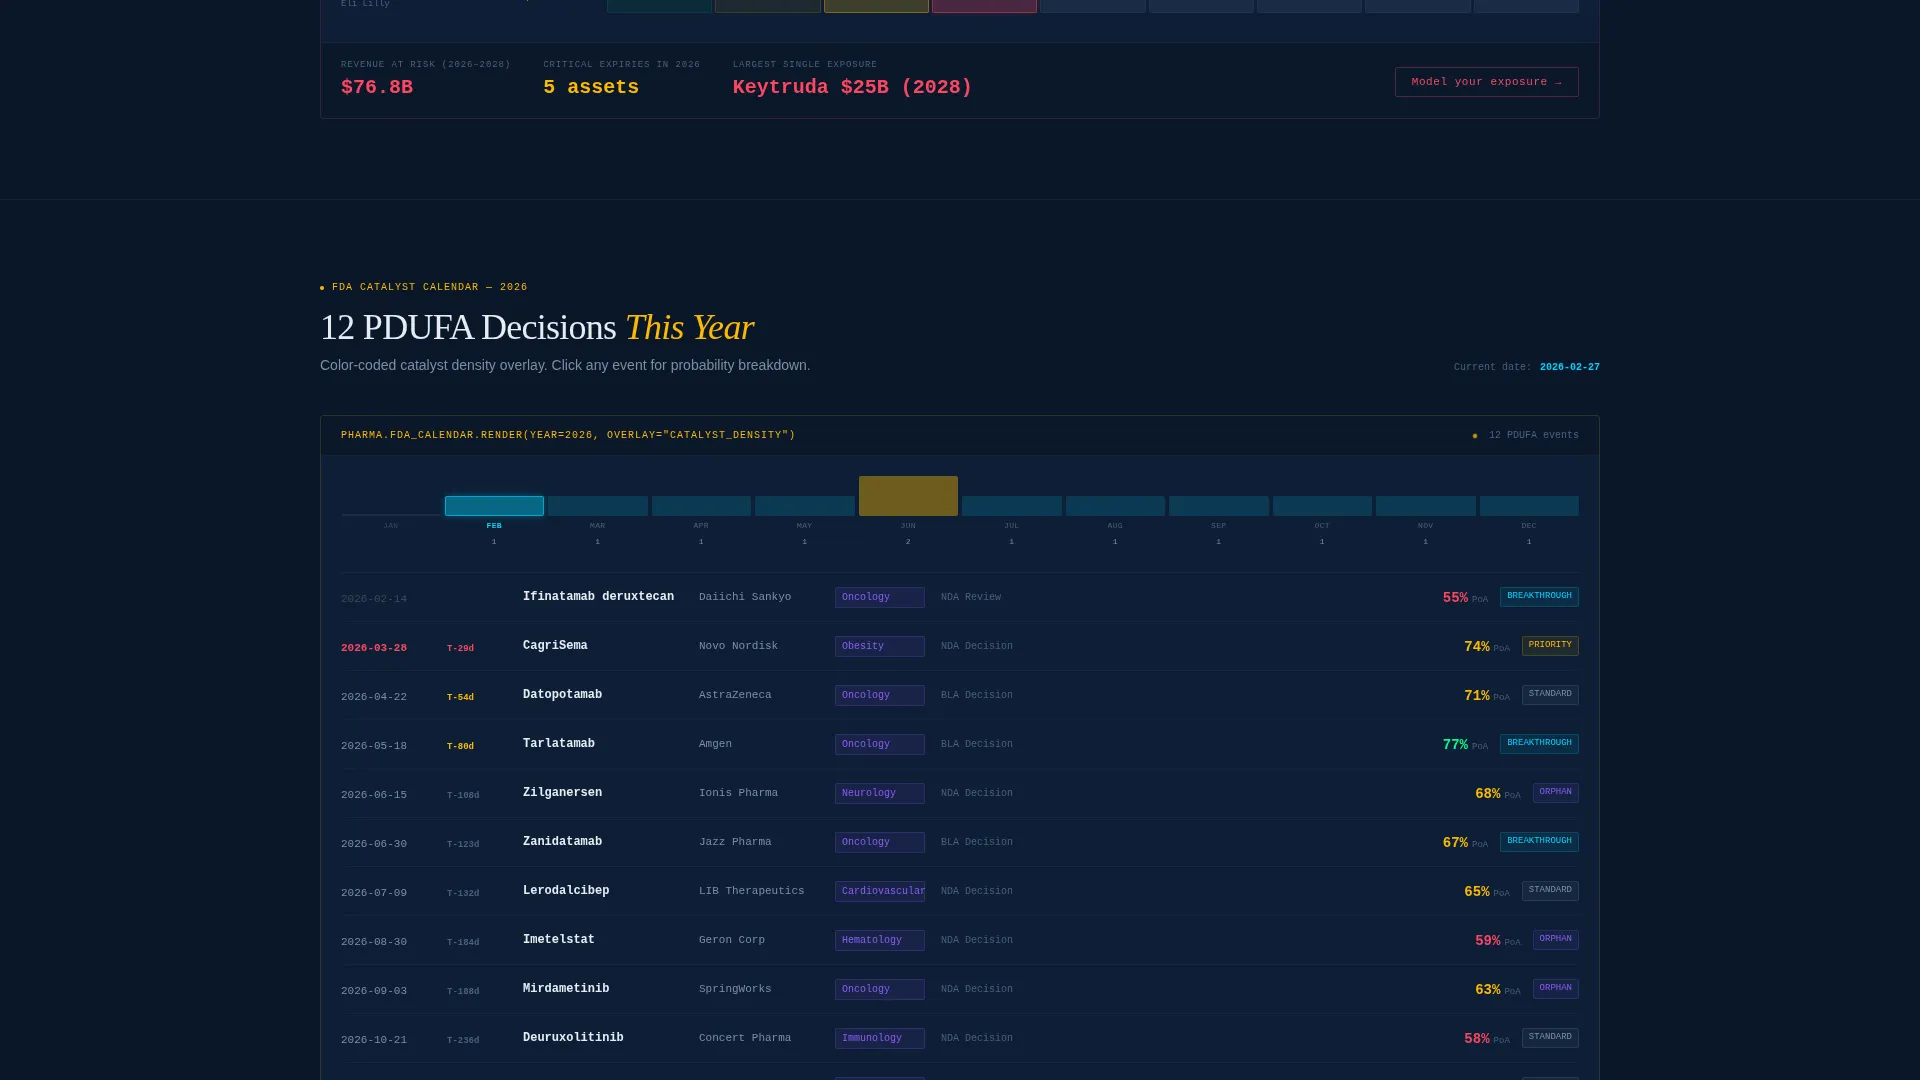
- Scroll-depth sections featuring patent expiry heatmaps, competitive landscape matrices, and FDA calendar overlays, each shown inside a dashboard frame
Feature list
This template includes purpose-built components that deliver the pharmaceutical analytics experience directly on the page.
Live API Code Snippet Header
The page opens with a centered, terminal-styled code block. It displays a real API call, pharma.pipeline.query(therapeutic_area="oncology", phase="III", catalyst_window="90d"), with signal cyan and steel gray syntax highlighting. Below it, a formatted data grid populates row by row, simulating a live database response complete with drug candidates, New Chemical Entity (NCE) status, PDUFA (Prescription Drug User Fee Act) dates, and probability-of-approval scores.
Interactive Pipeline Query Tool
A therapeutic area selector and a pipeline phase filter sit below the header section. Toggling either control reshuffles the visible data grid using real compound names and real development dates. Visitors experience the platform's filtering logic within seconds of arriving on the page, before any call to action appears.
Patent Expiry Heatmap Section
A dedicated scroll section renders patent cliff data as a dark-background heatmap visualization. The layout presents expiry density across time using color intensity, giving portfolio managers an at-a-glance view of upcoming generic entry windows without leaving the page.
Competitive Landscape Matrix
This section displays a head-to-head molecule comparison table inside a dashboard frame. Medical affairs directors and business development teams can see how competing drug candidates stack up across the same indication, making the platform's competitive intelligence use case immediately tangible.
FDA Calendar Overlay Section
A full-width FDA submission and approval calendar uses color-coded catalyst density markers to show decision date clustering. The visual makes it clear how the platform handles regulatory timeline tracking and why that matters for event-driven investment and portfolio decisions.
Freemium Conversion Module
The primary call to action sits directly beneath the interactive query tool. A single work email field with a signal cyan border captures leads with minimal friction. A micro-note explains that an institutional email unlocks full pipeline access. A secondary path invites technical evaluators to explore the API documentation before authenticating.
Page sections overview
| Section | Purpose |
|---|---|
| Code Snippet Header | Opens with a live-styled API query and animated data grid response |
| Interactive Query Tool | Lets visitors filter pipeline data by therapeutic area and phase |
| Primary call to action Module | Captures work email with a single field beneath the demo tool |
| Patent Expiry Heatmap | Visualizes patent cliff density as a dark-background data chart |
| Competitive Landscape Matrix | Shows head-to-head molecule comparisons inside a dashboard frame |
| FDA Calendar Overlay | Displays regulatory catalyst density using a color-coded calendar view |
| API Docs call to action | Offers a secondary path for technical users to evaluate before signing up |
Design & branding system
The visual identity follows a Data Command theme. Every color and typographic choice reinforces the feeling of a live operational environment rather than a marketing page.
- Color palette: deep terminal navy (#0A1628) as the primary background, desaturated steel (#1B2838) for card surfaces, clinical white (#E8ECF1) for body typography, and signal cyan (#00D4FF) reserved for live data points, active states, and interactive highlights
- No stock photography or illustration is used anywhere on the page; all visual content is data-native, appearing as grids, heatmaps, matrices, and calendar overlays inside dashboard frames
- Color appears only when something demands attention, creating a visual hierarchy that guides the eye toward live indicators and interactive controls without competing noise
Mobile & speed optimization
The template is structured for a clean experience across screen sizes. The data-native visual approach avoids heavy image assets that can slow rendering on smaller devices.
- Dashboard frame components and data grid layouts are designed to reflow cleanly for narrower viewports
- The single-field email capture form remains prominent and usable at mobile screen widths
- The absence of decorative imagery keeps the page visually lean, letting the interactive components remain the primary focus on any device
How this template helps you convert
The conversion strategy is built on demonstrated value rather than persuasive copy. Visitors earn confidence through interaction before they are ever asked to act.
- The interactive pipeline query tool puts visitors inside the product experience within the first ten seconds, so the primary call to action to "Run Your First Query" feels like continuing a task rather than starting a commitment.
- The single work email field and micro-note about institutional access lower the perceived cost of signing up, while the secondary API documentation path captures technical evaluators who need more context before they authenticate.
Other information about this template
This template is categorized under Technology, with a specific focus on Pharmaceutical Software and Software-as-a-Service (SaaS) products. It is positioned within the pharmaceutical analytics dashboard niche and is matched to a freemium or trial conversion flow.
- The template style is a Dashboard and Data Grid layout, suited for platforms where the interface itself is the product demonstration
- The header concept is a Code Snippet, a creative direction classified as Calculator and Tool First, meaning the visitor uses something before they read anything
- The Data Command theme and Midnight Blue color system are intentional design decisions that align the page's aesthetic with the professional environment of its target audience: after-hours analysts, pre-market traders, and operations-room decision makers
- This template can support pharmaceutical analytics platforms, clinical pipeline intelligence tools, regulatory calendar services, and competitive landscape monitoring products where showing real data is more persuasive than describing it
Theme
Data Command
Creative direction
Calculator/Tool First
Color system
Midnight Blue
Style
Dashboard/Data Grid
Direction
Freemium/Trial
Page Sections
Live API Code Snippet Header
Interactive Pipeline Query Tool
Patent Expiry Heatmap Visualization
Competitive Landscape Matrix
FDA Calendar Overlay
Freemium Conversion Module
Related questions
Who is this landing page template designed for?
Can I customize the sample data grid and therapeutic area filters?
Does the template support a freemium or trial signup flow?
What visual assets does this template use?
Is this template suitable for a single-page layout?



