Intelligent Toy Analytics Landing Page Template
The Toyline Data Command toy manufacturing analytics dashboard landing page template is a hub and spoke landing page built for operations directors, procurement leads, and VP strategists. It presents live production metrics, supply chain costs, and retail intelligence inside a dark cockpit interface. Visitors interact with real toy-industry sample data before any sign-up is required.
by Rocket studio
Quick summary
This template gives toy and games industry teams a command-center landing page that showcases a purpose-built analytics dashboard. Every section activates on scroll, lets visitors manipulate real data, and guides them from monitoring to diagnosis to prediction. The page earns the click by making decision makers feel the product before asking for anything.
Who this template is for
The toy and games industry runs on tight production windows and shifting retail demand. This template is built for teams that need to move fast on real data, not assumptions. It suits a range of decision makers across operations, procurement, and strategy.
- Operations directors tracking defect rates across multiple manufacturing lines
- Procurement leads managing resin costs against retailer replenishment windows
- VP-level strategists benchmarking licensed intellectual property against house brands
What problem this template solves
The games industry faces serious data challenges every quarter. Sales data lives in spreadsheets. Manual reports pile up before a single informed decision gets made. Seasonal demand shifts during school seasons and holidays catch teams without the inventory data they need.
- Fragmented raw data across factories, channels, and product lines slows decision making
- Legacy tools and manual reports cannot surface monthly trends or demand shifts in real time
- Operations and strategy teams lack a shared control center for production, supply chain, and retail metrics
What you get with this template
This template delivers a fully structured, desktop-first landing page designed around interactive data experiences. Every spoke section loads a dormant dashboard module that activates on scroll-enter. Visitors get full control of date ranges, category filters, and competitor comparisons before a single sign-up prompt appears.
- Five anchor-nav sections: Hero, Production, Supply Chain, Retail Intelligence, and Competitor Bench
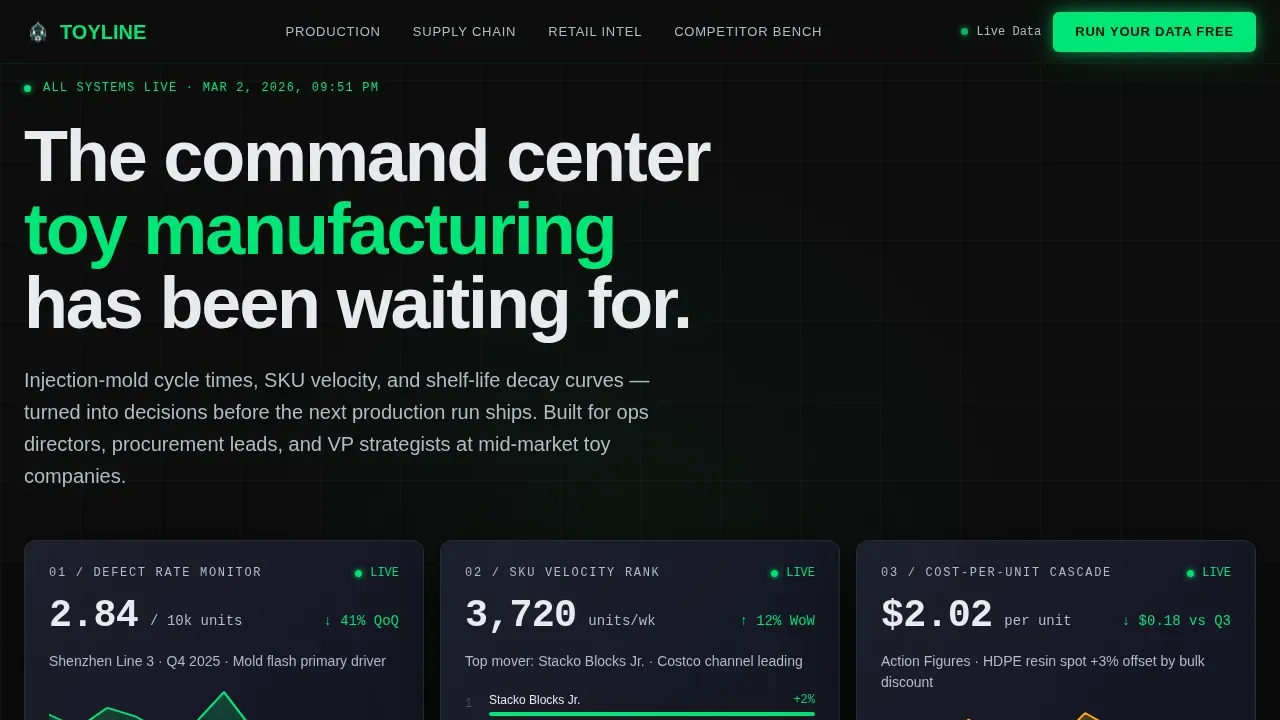
- Three floating glassmorphic header panels showing defect rate, SKU velocity, and cost-per-unit data
- A persistent split-view comparison module and a dual-call to action structure with an email-gated benchmark report
Feature list
This template surfaces key features that match the complexity of the toy and games industry without adding visual clutter.
Glassmorphic Live Metric Panels
Three translucent dark glass panels float against a pure black header. Each panel displays a different live metric: defect rate per 10,000 units with a micro-sparkline, SKU velocity ranked by sales channel, and a cost-per-unit waterfall chart. A green pulse line traces the bottom edge of each panel, confirming the system is active.
Scroll-Activated Dashboard Modules
Each spoke section holds a dormant dashboard module that activates when it enters the viewport. Sliders adjust date ranges for month analysis, dropdowns swap between toy and game categories, and hovering any data point spawns a tooltip showing the exact query it answers. This gives visitors powerful insights through direct interaction.
Split-View Competitor Comparison
A persistent toggle lets visitors switch between their current tool and the Toyline dashboard side by side. Matched screenshots show the same key business metrics rendered in both environments. This supports sales strategies by making the value gap immediately visible.
Role-Specific Data Views
The template structures each section around a distinct audience. Production views surface First Pass Yield (FPY) and Overall Equipment Effectiveness (OEE). Supply chain views cover raw material availability and weeks of supply. Retail views show units sold by sales channel and total revenue trends. Each record represents a specific operational layer.
Anchor Navigation with Persistent call to action
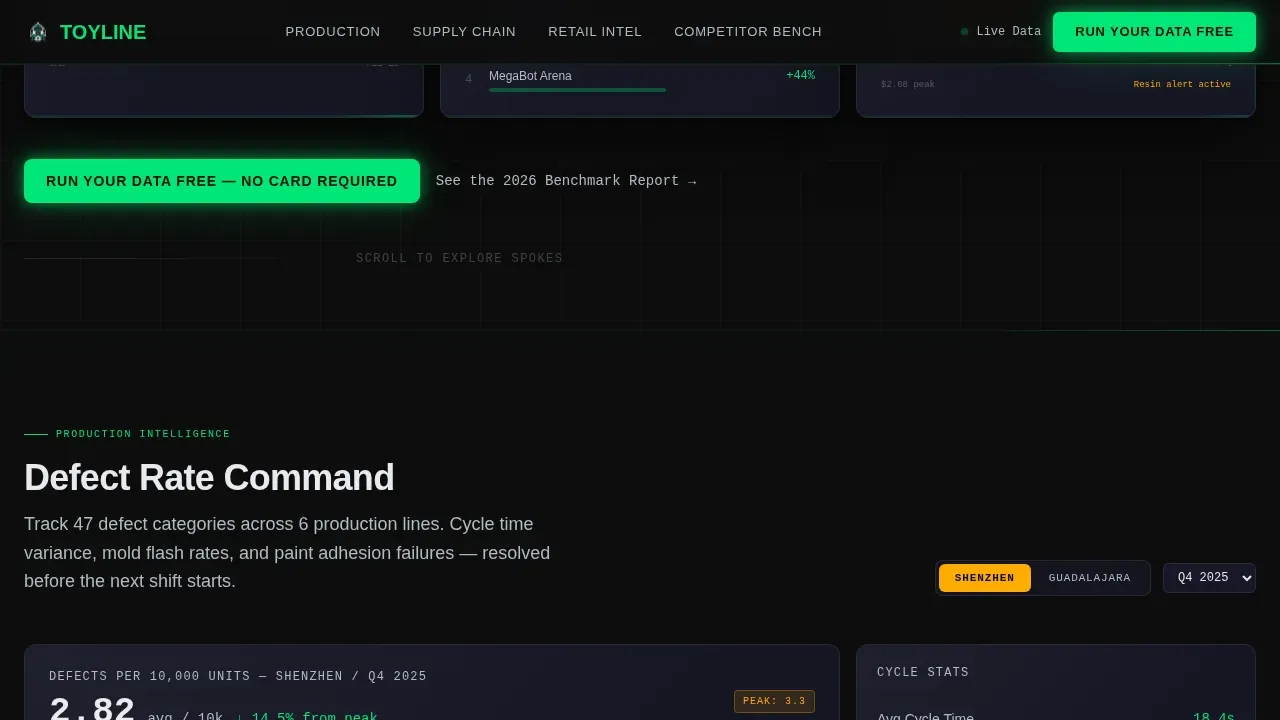
A sticky anchor nav pins to the top of the page with four labeled spokes: Production, Supply Chain, Retail Intelligence, and Competitor Bench. The primary call to action, "Run Your Data Free," appears in the nav and repeats after each section. A secondary path offers a benchmark report behind a single email field.
Page sections overview
| Section | Purpose |
|---|---|
| Hero Glass Panels | Display live defect rate, SKU velocity, and cost-per-unit metrics with pulse animations |
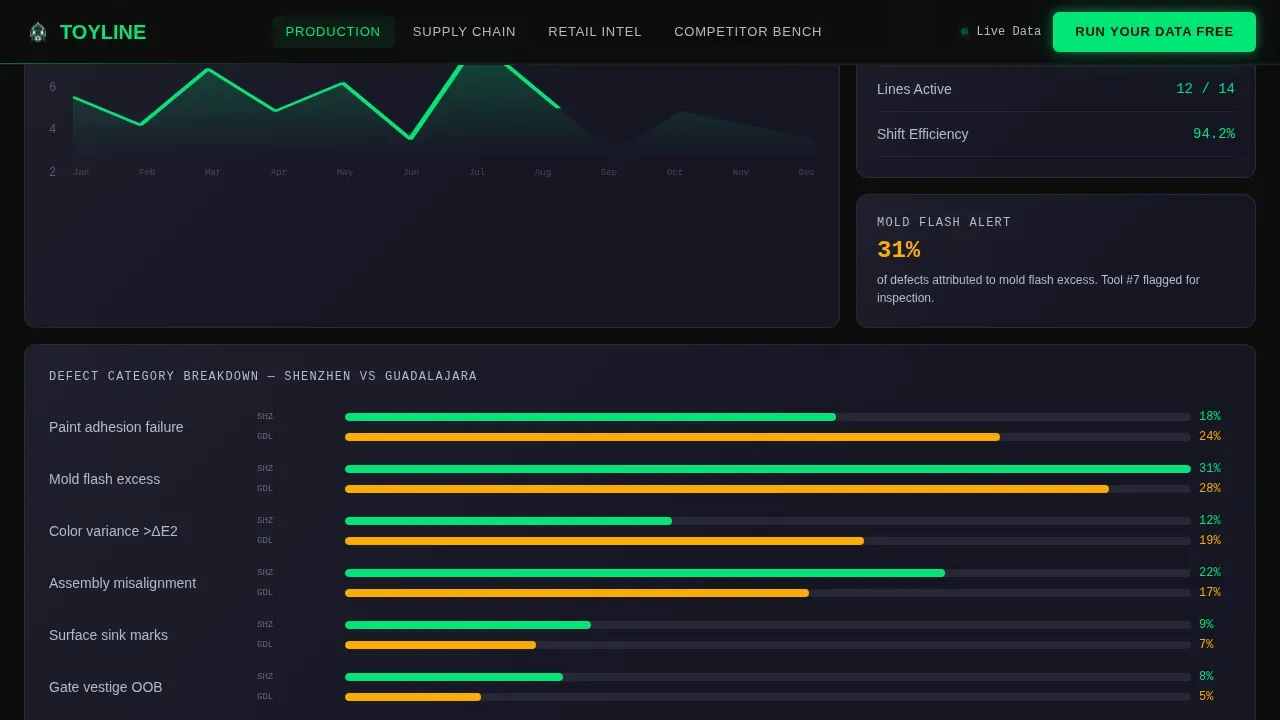
| Production Module | Interactive defect rate explorer with date slider and manufacturing line toggle |
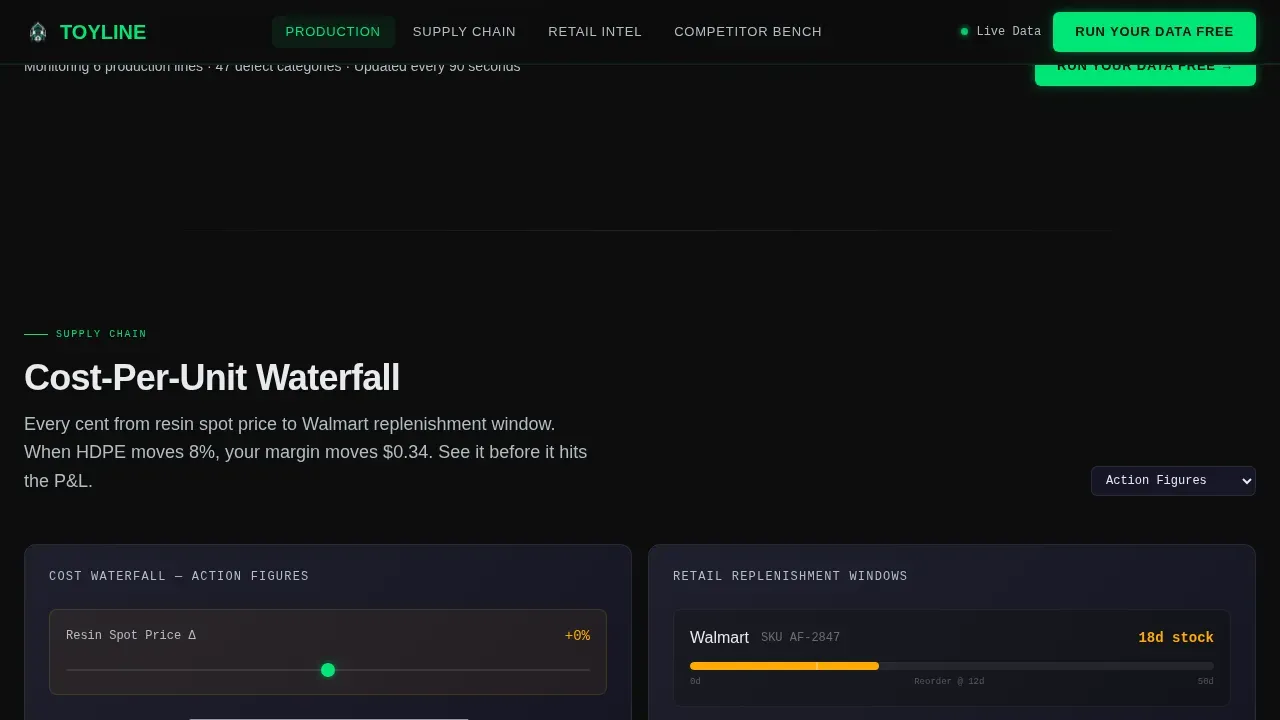
| Supply Chain View | Cost waterfall and resin-versus-replenishment visualization with category filters |
| Retail Intelligence Hub | SKU velocity bento grid and intellectual property cannibalization split view |
| Competitor Bench | Side-by-side comparison of Toyline versus legacy tools with matched KPI screenshots |
| Footer Row | Single linear row with links and secondary navigation |
Design & branding system
The visual identity follows a Data Command theme built on a Carbon Fiber color system. The palette feels engineered and precise, with no lifestyle imagery. The data itself is the visual.
- Background deep cockpit black (#0D0D0D), panel woven carbon gray (#1A1A2E), status green (#00E676) for live metrics and positive deltas
- Warning amber (#FFAB00) on alerts and interactive hover states, cool titanium (#B0BEC5) for secondary text and divider lines
- DM Sans for headings and IBM Plex Mono for all data labels, metrics, and supporting data fields
Mobile & speed optimization
This template is desktop-first by design. Operations directors and procurement leads work at wide-viewport workstations where dashboard complexity reads best. Animations use GPU-accelerated transforms to keep interactions smooth.
- Parallax mouse-tracking on header panels and beam border pulse animations use GPU-accelerated CSS transforms only
- Scroll-enter module activation uses Intersection Observer, so modules load only when they enter view
- Sparkline draw animations and counter animations trigger on visibility, avoiding unnecessary background rendering
How this template helps you convert
The page is designed to create product confidence before any sign-up friction appears. Visitors interact with real toy-industry sample data across every section, which builds trust faster than static screenshots.
- Visitors engage with live sample data across Production, Supply Chain, and Retail sections, experiencing the product directly before any call to action appears
- The split-view competitor module surfaces the gap between Toyline and generic tools at the exact moment a visitor is comparing options, turning curiosity into a conversion trigger
Other information about this template
This template draws inspiration from established patterns in toy industry data analysis and business intelligence tooling. It is well-suited for both small businesses entering the analytics space and large enterprises replacing legacy reporting stacks.
- The Maven Toys dataset structure, which includes a products table, sales table, stores table, and inventory table, reflects the kind of structured data this template is designed to visualize. Each record represents a transaction, a store name, a specific store location, or a product category row.
- The Maven Toys Challenge tasks analysts with building a single page visual to outline a potential expansion plan. This template provides a production-ready design foundation for that kind of work.
- Dashboards built in Power BI transform raw data into interactive kpi cards, dynamic visuals, and actionable insights. This template is structurally aligned with how Power BI report pages present brand analysis, product category analysis, and sales channel analysis across game categories.
- A dedicated brand analysis page and a product category analysis page are common in Power BI games industry dashboard builds. The template's spoke structure mirrors that pattern, making it straightforward to connect real sales data from a data sheet or live data source.
- The month analysis page convention in Power BI games industry dashboard reports tracks monthly trends, units sold, total revenue, and customer type breakdowns. This template uses the same visual hierarchy for its Retail Intelligence section.
- Teams that previously relied on pivot tables or excel toy reporting tools will find the interactive module pattern in this template a cost effective upgrade path. It supports visualization skills at every level, from analysts building their first data visualization to experienced decision makers who need to share insights across departments.
- The template supports product category analysis, brand analysis, and sales channel analysis views. It can surface interesting patterns across customer segments, retail price bands, educational toys versus board games lines, and e commerce versus in-store performance, helping games businesses analyze interesting patterns across all toy and game categories.
- Data-driven decisions in the toy and games industry require accurate, timely data. This template provides a framework for presenting that data clearly to both internal teams and prospective customers, and it applies smart pricing and potential expansion plan insights at the right moment in the visitor journey.
Theme
Data Command
Creative direction
Interactive Explorer
Color system
Carbon Fiber
Style
Hub & Spoke (Anchor Nav)
Direction
Comparison/Versus
Page Sections
Glassmorphic Live Metric Header Panels
Scroll-activated Interactive Modules
Persistent Split-view Comparison
Role-specific Spoke Sections
Dual Call to Action with Email-gated Report
Related questions
What kind of teams benefit most from this template?
Does the template include real sample data?
Can I use this template to compare Toyline against other tools?
How is the page structured for navigation?
Is this template suitable for showcasing a games industry dashboard to stakeholders?



