Intelligent Stock Optimization Landing Page Template
Forecast is a modular card-grid landing page template built for AI inventory forecasting platforms serving multi-unit restaurant operators and food-service businesses. It pairs an interactive forecast dashboard header with a spec-sheet card layout, a case-study ROI section, and a three-step lead-generation form, all styled in a Data Command monochrome steel palette designed to earn buyer trust fast.
by Rocket studio
Quick summary
Forecast is a single-page, section-led landing page template built for B2B software teams selling AI inventory forecasting solutions to restaurant groups, hotel food and beverage directors, and food-service distributors. It combines a live interactive header, modular spec-sheet cards, hard-number social proof, and a progressive lead capture form into one high-clarity, conversion-focused layout.
Who this template is for
This template is designed for software founders, product marketers, and sales teams who need to present an ai inventory forecasting platform to serious, data-literate operators. It fits teams who want to lead with proof before asking for a meeting.
- Multi-unit restaurant technology companies selling demand forecasting and inventory management tools to operators running fifteen or more locations
- Food-service distributors and hotel food and beverage software vendors who need to communicate ai forecasting value to operations teams quickly
- B2B SaaS teams replacing outdated traditional methods with ai driven inventory solutions and need a landing page that matches the product's precision
What problem this template solves
Restaurant operators and food-service buyers lose money on two fronts: excess inventory that spoils before service and stockouts that kill Saturday night revenue. Traditional methods, spreadsheets, gut feel, weekly sales history reviews, cannot react fast enough to shifting customer demand. An effective landing page for an ai inventory forecasting solution must bridge the gap between complex technology and tangible business outcomes, and most generic templates fail to do that.
- Visitors arrive skeptical; the template leads with a working forecast dashboard so prospects see ai inventory accuracy before reading a single claim
- Generic layouts bury the ROI case; this template surfaces hard numbers, 31% waste reduction, 74% fewer stockout incidents, 12 hours saved per week in purchasing labor, in oversized type inside a dedicated case-study card
- Standard forms create friction; the three-step progressive disclosure form reduces drop-off by asking for company size first, then system details, then a calendar booking
What you get with this template
You get a fully structured, modular card-grid landing page with every section laid out and ready to customize. The layout is desktop-first and fully responsive, built around a Data Command visual identity that communicates operational precision from the first pixel.
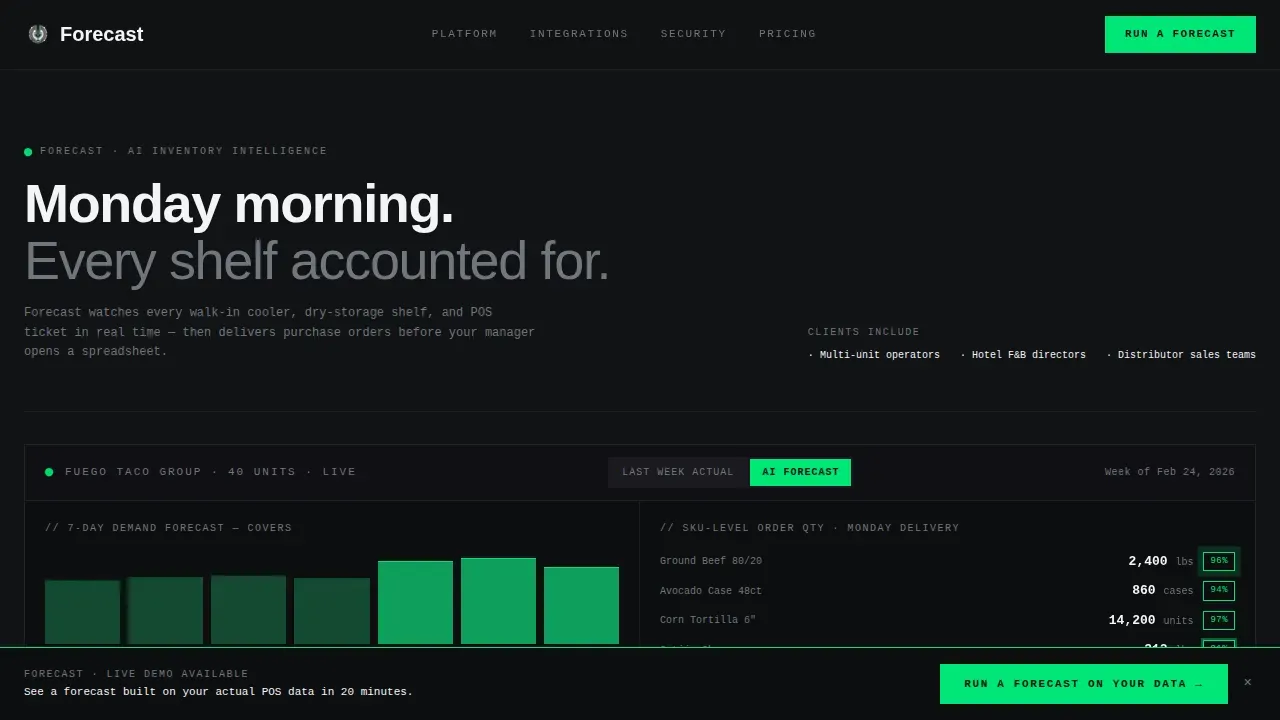
- An interactive forecast dashboard header showing animated SKU-level predictions with a Last Week Actual versus AI Forecast accuracy toggle
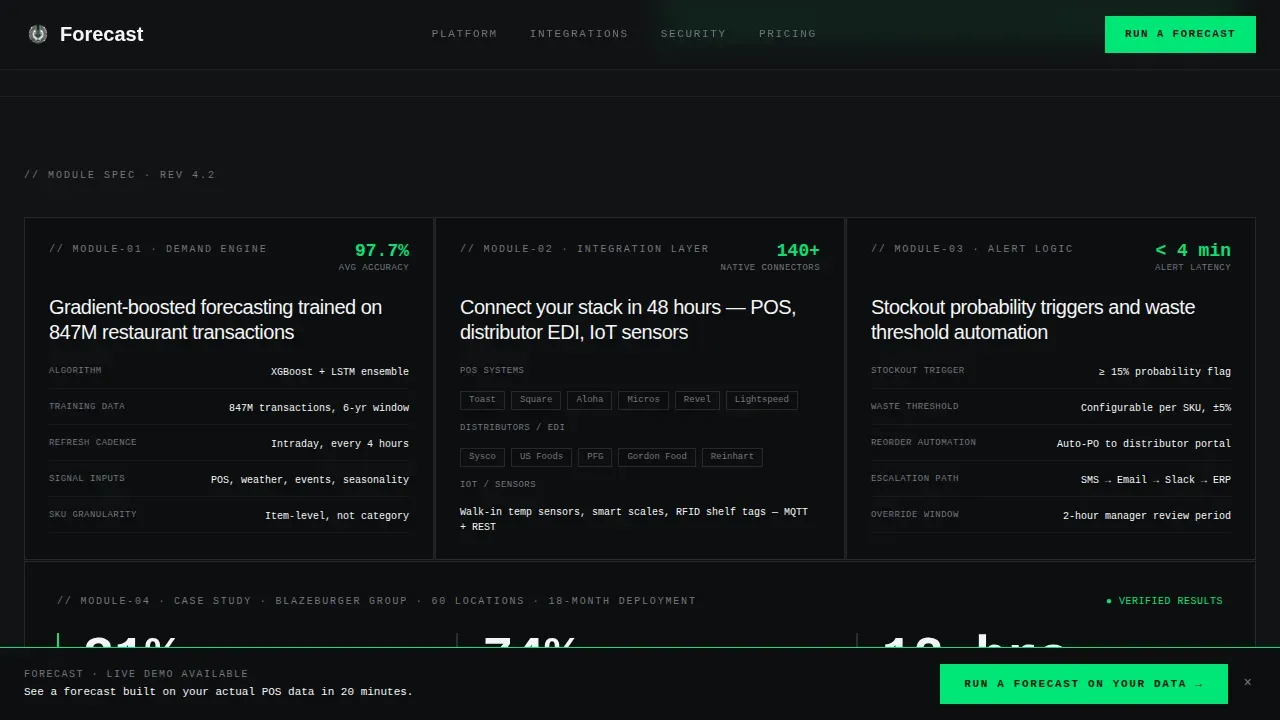
- Six spec-sheet cards covering the Demand Engine, Integration Layer, Alert Logic, Security and Compliance, Deployment Timeline, and Pricing Architecture, each with a monospaced label and one signal-green data point
- A full-width case-study card with oversized ROI metrics, a secondary download call to action, a three-step lead-generation form, and a sticky bottom call-to-action bar
Feature list
This template includes purpose-built sections and interactive components drawn directly from the platform brief. Each module is designed to move a skeptical operator closer to booking a demo.
Interactive Forecast Dashboard Header
The header renders a functioning seven-day demand curve for a fictional 40-unit concept, with animated SKU predictions resolving from blurred estimates to sharp figures. Each prediction carries a confidence percentage badge pulsing in signal-green. A toggle lets visitors switch between Last Week Actual and AI Forecast views, demonstrating forecasting accuracy before the visitor scrolls. This is the primary proof point, the product is the hero.
Spec-Sheet Card Grid
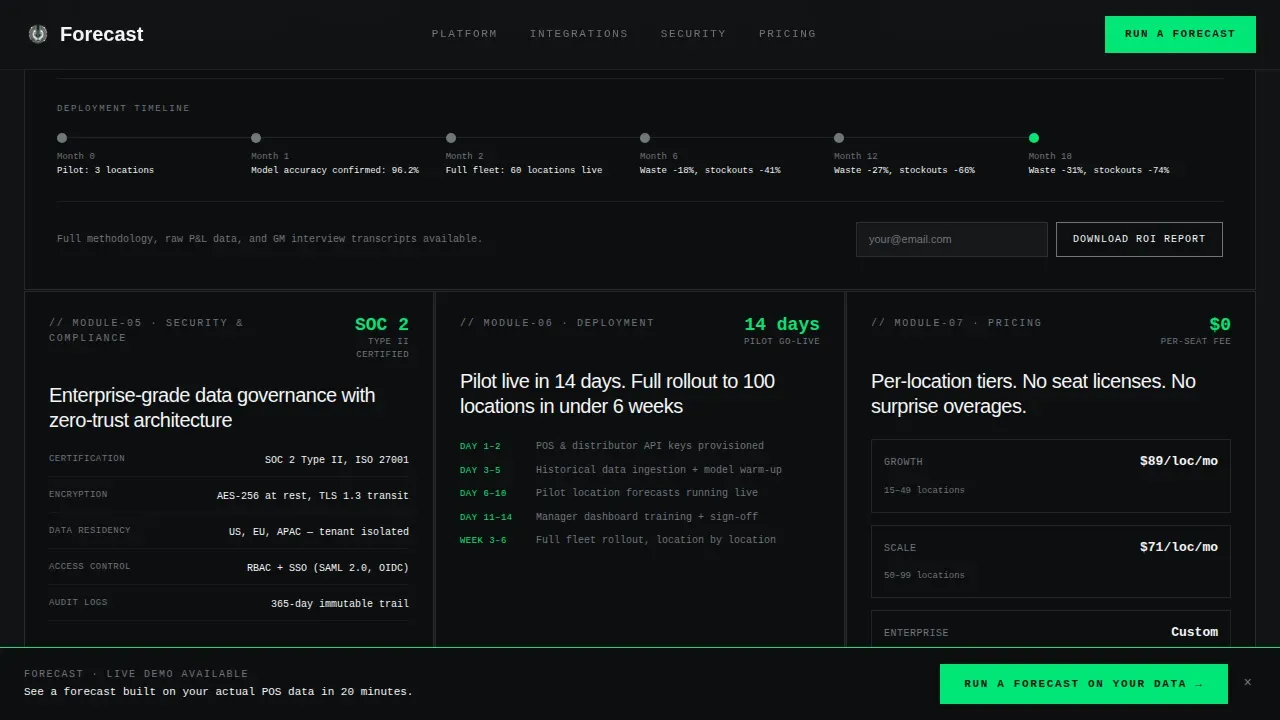
Six modular cards are arranged across two rows, each styled like a technical module from an engineering document. Cards cover the Demand Engine (algorithm specs, training data sources, refresh cadence), Integration Layer (point-of-sale systems, distributor EDI feeds, IoT sensor compatibility), and Alert Logic (waste thresholds, stockout probability triggers, reorder automation rules). The second row handles Security and Compliance, Deployment Timeline, and Pricing Architecture. Every card carries a steel-gray border, a monospaced top-left label, and exactly one signal-green data point.
Full-Width Case Study ROI Card
A wide card spanning the full page width presents a before-and-after timeline for a 60-location burger chain. Hard numbers appear in oversized type: waste reduced 31%, stockout incidents down 74%, purchasing labor cut 12 hours per week. A secondary conversion path, "Download the Full ROI Report", is gated behind a single email field inside this card, giving visitors a low-commitment way to engage before booking a call.
Three-Step Progressive Lead Capture Form
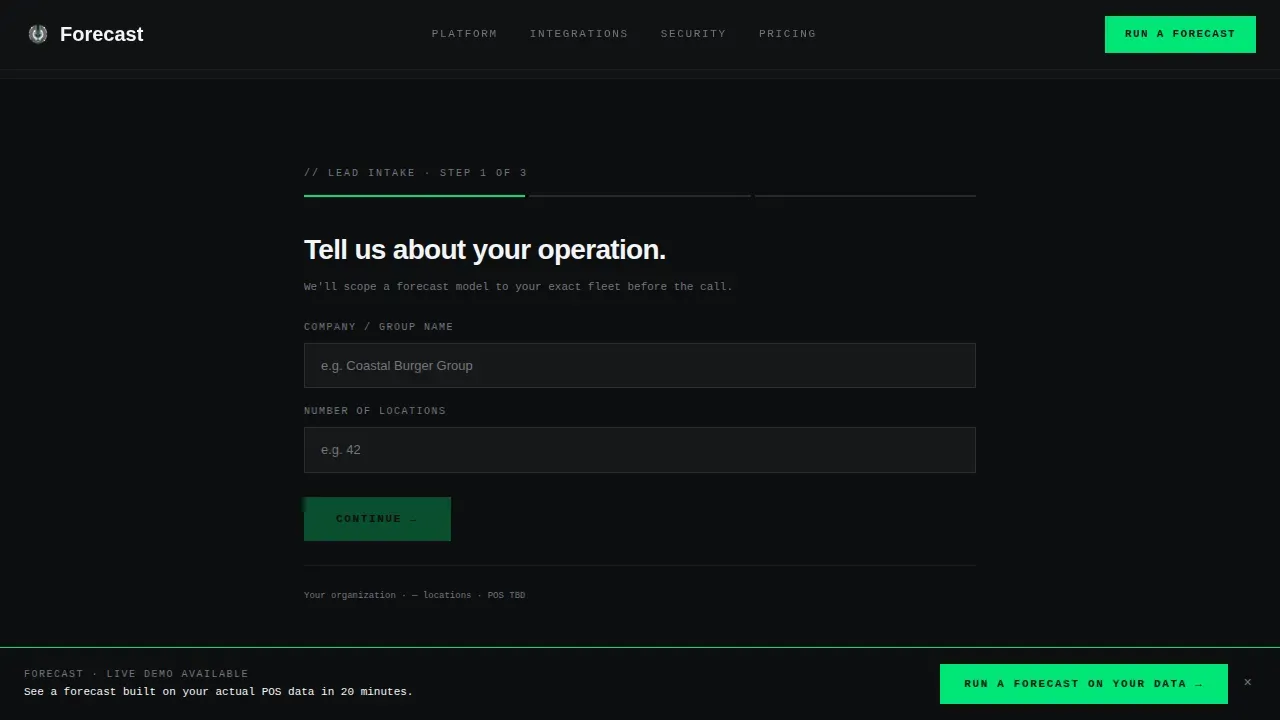
The lead form uses progressive disclosure across three steps. Step one collects company name and number of locations. Step two presents checkboxes for point-of-sale and distributor systems rather than free-text fields. Step three embeds a calendar for booking a 20-minute data walkthrough. This structure reduces perceived friction and improves completion rates by asking for context before commitment.
Sticky Call-to-Action Bar
After the visitor passes the second card row, a sticky bottom bar appears with the primary call to action: "Run a Forecast on Your Data." The bar stays visible as the visitor continues scrolling, reinforcing the conversion goal without interrupting the reading flow.
Page sections overview
| Section | Purpose |
|---|---|
| Interactive Dashboard Header | Show live AI forecast output; primary call to action placement |
| Demand Engine Card | Communicate algorithm specs and data refresh cadence |
| Integration Layer Card | Detail POS, EDI, and IoT compatibility |
| Alert Logic Card | Explain waste thresholds and reorder automation rules |
| Case Study ROI Card | Surface hard ROI numbers; host secondary email call to action |
| Security Compliance Card | Display SOC 2 trust signals and data residency details |
| Deployment Timeline Card | Show 14-day pilot path; reduce launch anxiety |
| Pricing Architecture Card | Outline per-location tiers; remove seat-license confusion |
| Lead Generation Form | Capture company details, systems used, and calendar booking |
| Sticky call to action Bar | Persistent conversion prompt after second card row |
| Footer | Linear single-row links and brand close |
Design & branding system
The visual identity follows a Data Command theme built on a Monochrome Steel color system. Every design decision reinforces operational precision, the aesthetic equivalent of a stainless-steel kitchen pass at a high-volume restaurant. There is no warmth, no decoration, only surfaces that reflect work being done.
- Colors: forge-black (#111215) for dark backgrounds, brushed-steel gray (#71767E) for secondary type and borders, cold-white panel (#F4F5F7) for light card surfaces, and signal-green (#00E676) reserved exclusively for live data points, positive deltas, and primary call-to-action elements
- Typography: DM Mono and JetBrains Mono for monospaced card labels and data readouts; Manrope for headings and body copy, the combination creates a clear separation between machine output and human explanation
- Layout: backgrounds alternate between forge-black and cold-white cards; text uses steel gray on light surfaces and cold white on dark surfaces; signal-green appears sparingly so every flash of it signals something performing
Mobile & speed optimization
The template is desktop-first, designed for operators who review vendor tools on a laptop during a morning briefing. It is fully responsive so mobile visitors, a sales rep checking a link mid-shift, get a clean, readable experience without broken layouts.
- Interactive components including the forecast toggle, animated SKU counters, and three-step form are built as client-side components, keeping static sections server-rendered for faster initial loads
- The sticky call-to-action bar and card grid reflow cleanly at tablet and mobile breakpoints, maintaining the spec-sheet visual identity across screen sizes
How this template helps you convert
The layout is engineered around a single conversion goal: book a 20-minute data walkthrough. Every section earns the next click rather than demanding it.
- The interactive dashboard header lets visitors interact with real ai forecasting output, animated inventory predictions, a confidence badge, an accuracy toggle, so the form at the bottom feels like a natural next step, not a leap of faith
- The case-study card presents specific, metric-driven results in oversized type, giving operations teams and procurement leads the cost savings argument they need to justify a demo internally
- The three-step progressive form and sticky call-to-action bar together provide two low-friction paths to conversion, one for buyers ready to book and one for buyers who need one more piece of evidence first
Other information about this template
This template is purpose-built for the food and beverage ai inventory forecasting niche, but its underlying structure applies wherever ai driven insights need to drive enterprise sales. The spec-sheet creative direction, interactive header, and progressive form pattern can support other ai driven forecasting products beyond food service.
- The demand forecasting use case extends naturally to e commerce brands, raw materials procurement teams, and logistics providers who need to meet customer demand efficiently across complex supply chain networks
- The integration layer card is pre-structured for erp systems and erp integration detail, teams can swap in their own erp platforms, distributor connectors, or supplier lead times data without redesigning the card layout
- Inventory segmentation, safety stock levels, reorder points, and automated replenishment logic can all be documented inside the existing card modules without adding new sections
- The case-study card pattern supports any vertical where real time data and sales velocity metrics tell a stronger story than feature lists, including scenarios involving seasonal trends, demand spikes, and promotional events
- Revenue model flexibility is built into the Pricing Architecture card, which supports per-location subscription tiers, usage-based pricing, and enterprise license structures, making this forecast ai inventory forecasting platform landing page template adaptable to a range of go-to-market approaches
- The template's data foundation and data quality messaging slots naturally support narratives around historical data, historical sales, and sales data hygiene that buyers need to trust before committing to a pilot
- Partnerships with erp platforms, cloud vendors, and logistics providers can be surfaced inside the Integration Layer card to strengthen supply chain credibility
- The layout supports trust signals such as SOC 2 compliance badges and data residency callouts inside the Security Compliance card, addressing customer expectations for enterprise-grade software
Theme
Data Command
Creative direction
Spec Sheet
Color system
Monochrome Steel
Style
Card Grid (Modular)
Direction
Lead Generation
Page Sections
Interactive AI Forecast Dashboard Header
Modular Spec-sheet Card Grid
Full-width Case Study ROI Card
Three-step Progressive Lead Capture Form
Sticky Conversion Bar
Related questions
Who is this template designed for?
Can I adapt this template for industries outside food and beverage?
What makes the header different from a standard hero section?
How does the three-step form reduce drop-off?
What conversion paths does the template include?



